
Analyze Marketing Metrics from Google Ads in Tableau
Are you looking to connect Google Ads data with Tableau? Wonder how other people are doing it? Thankfully, Google Ads Tableau integration is a simple process you can accomplish with a connector and basic knowledge of the two platforms.
The procedure is a great way to improve your marketing strategy and spend your ad budget more wisely. Advertisements are a huge part of any business, and if you’re not analyzing your Google Ads data, you’re missing a lot of valuable insights.
When running Google Ads, it’s important to see how they’re performing. Tableau is a data analytics platform you can use to analyze and share data insights. It then visualizes this data in an easily digestible format. This makes it simpler to understand your marketing campaign’s progress.
This guide will show you how to use a Google Ads connector Tableau to integrate both platforms and better visualize your data. You’ll see things like cost per click (CPC) and impression data in graphs and tables. With this information, you can optimize your campaigns for the best results. Let’s get started!
Table of contents:
- Introduction to Google Ads
- Introduction to Tableau
- Prerequisites
- Steps to connect Google Ads to Tableau With Windsor.ai
- Customize the Dashboard
Introduction to Google Ads
Google Ads, formerly Google AdWords, is an advertising platform where businesses can display ads to users searching for terms related to their products or services. These ads can appear on Google Search, YouTube, and millions of websites.
Google Ads is a powerful tool that allows businesses of all sizes to reach new customers and grow their businesses. When used correctly, Google Ads can be an effective way to drive traffic to your website and generate leads and sales.
However, running a successful Google Ads campaign is not always easy. It takes time, effort, and a lot of trial and error to get it right.
How does Google Ads work?
Google Ads works by auctioning off ad space to businesses willing to pay for it. When a user searches for a particular term on Google, businesses that have placed a bid on that term will have their ads displayed in the search results.
The amount a company is willing to pay for a particular ad spot will determine its position in the search results.
The higher you bid, the more likely your ad will be displayed. However, you also have to consider your quality score, which measures the quality and relevance of your ad. A high-quality score will help you to get a better position in the search results, even if you have a lower bid.
When someone clicks on your ad, you will be charged your bid amount. This is known as your cost-per-click (CPC). In some cases, you may also be charged for other interactions with your ad, such as ad impressions.
Introduction to Tableau
Tableau is a data visualization tool that allows you to see and understand data in new ways. Tableau can help you to make sense of large data sets, find patterns and correlations, and tell stories with your data. For example, Google Ads in Tableau can show you how your ad campaign is performing and help you make decisions about improving it.
Integrating Tableau with ad campaign platforms such as Google Ads is an easy way to get more value from your data. By visualizing your data in Tableau, you can quickly see what is working and what is not and make changes to improve your results.
Features of Tableau
Tableau offers many features that make it a powerful data visualization tool. Some of the features include:
- Connect to data sources
- Prepare and clean data
- Creating visualizations
- Publishing visualizations
Prerequisites
Google Ads Tableau integration is a simple process that will let you connect your Google Ads account to Tableau so that you can start visualizing your data.
Before you begin, you will need the following:
- A Google Ads account
- A Tableau account (Free or paid)
- Windsor.ai connector
- Knowledge of data visualization
Steps to Connect Google Ads to Tableau
Google Ads Tableau integration is a simple process that will let you view your Google Ads dashboard in Tableau so that you can start visualizing your data.
Before you begin, you need a Google Ads connector, that is compatible with Tableau. A good option is the Windsor.ai connector, available for both Tableau.
Windsor.ai platform has many features that make it a powerful data visualization tool. It is important to note that the Windsor.ai connector is a paid service, but it offers a free trial to try it out before you commit to a paid subscription.
Once you have the Windsor.ai connector, you can follow these steps to connect Google Ads to Tableau:
Step one
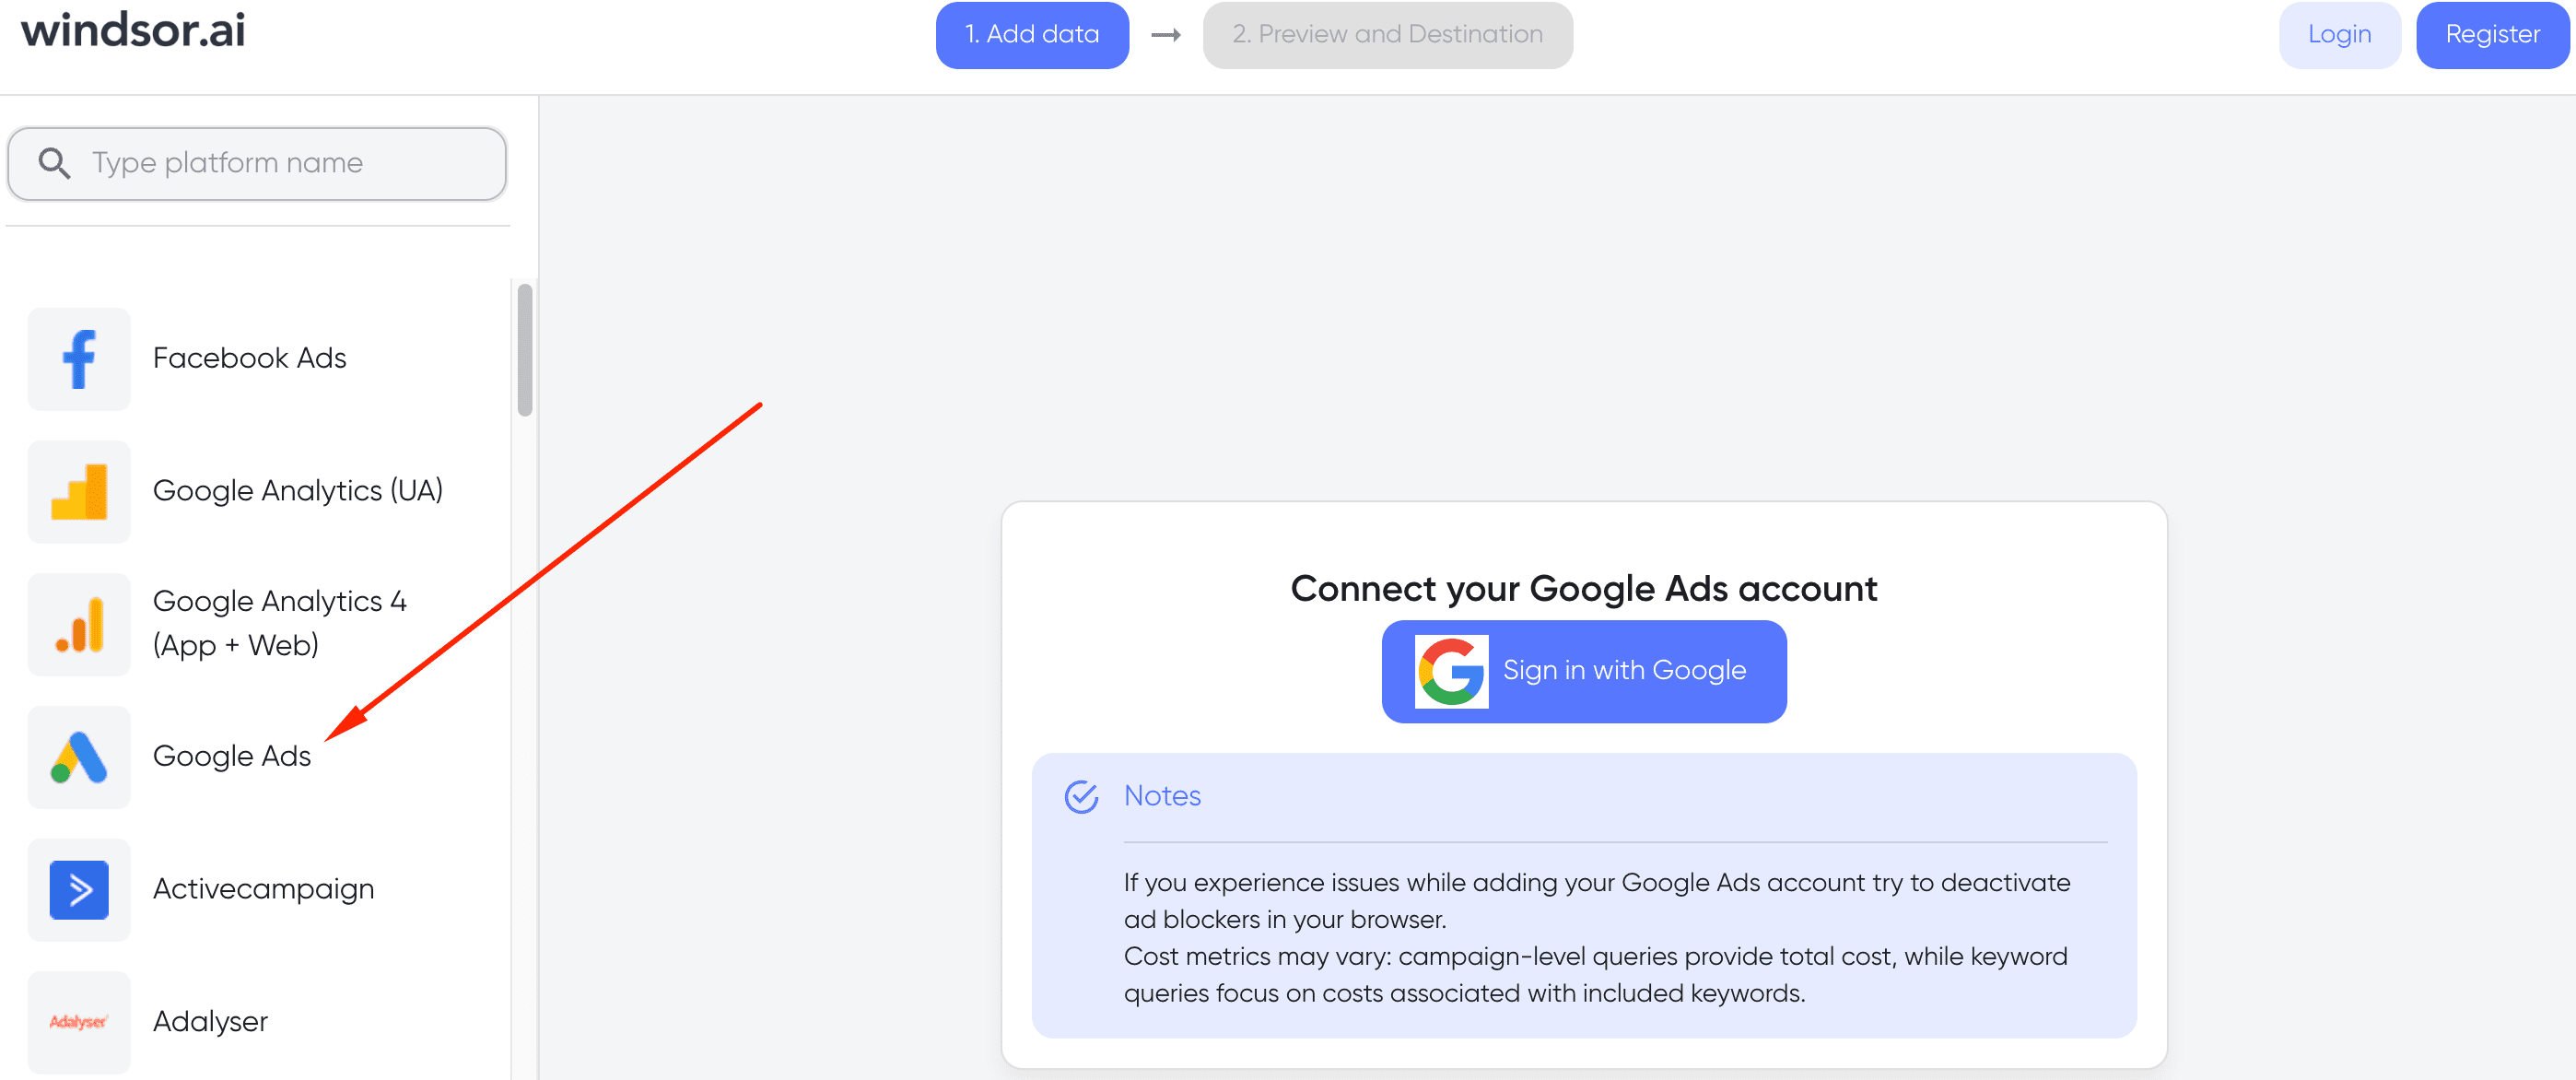
Select ‘Google Ads‘ in the “Search Data Sources” on the Windsor.ai platform. This step will prompt you to sign in with Google and grant Windsor.ai platform access to your Google Ads account.
Step two
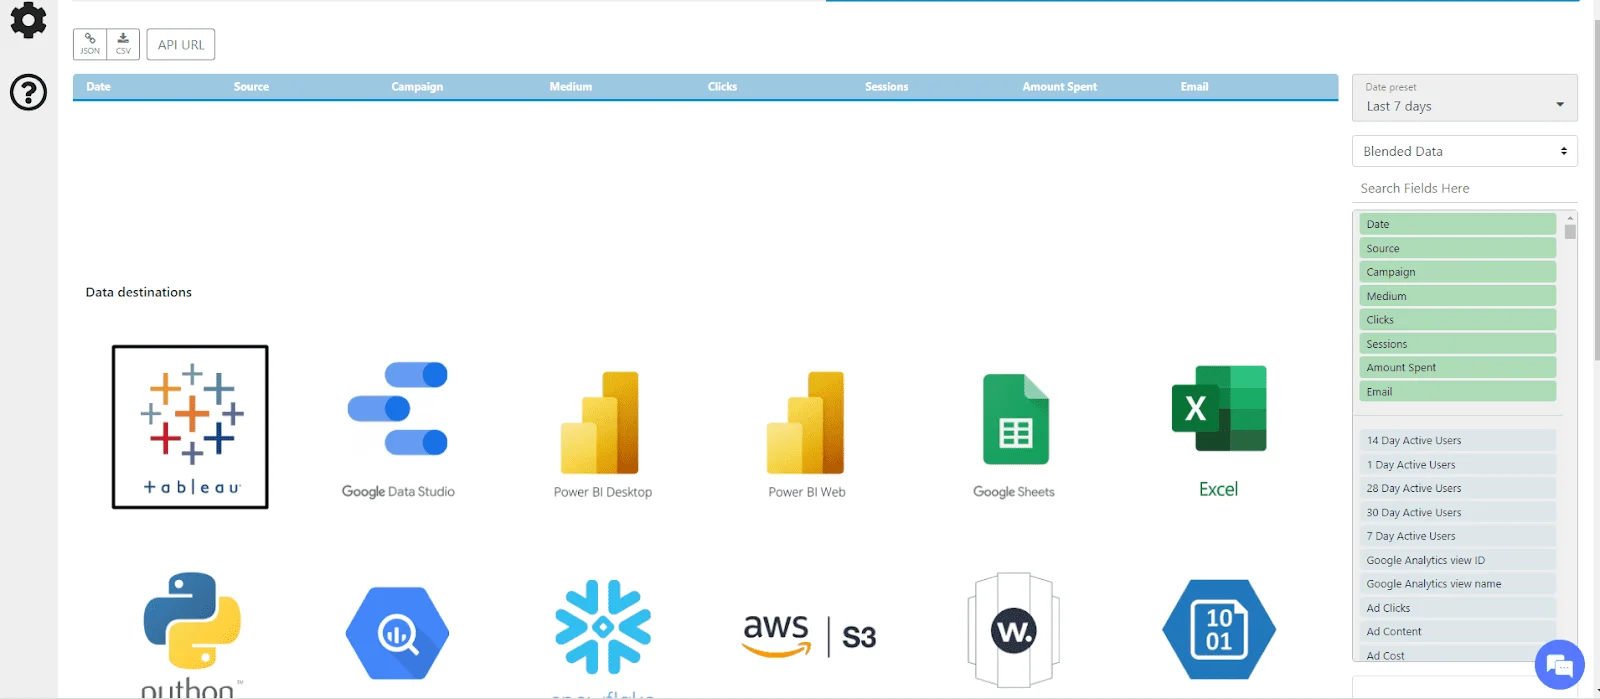
The next page will require you to select a data destination. Click “Tableau” and select the fields you want to include in your data set on the right-hand side.
Step three
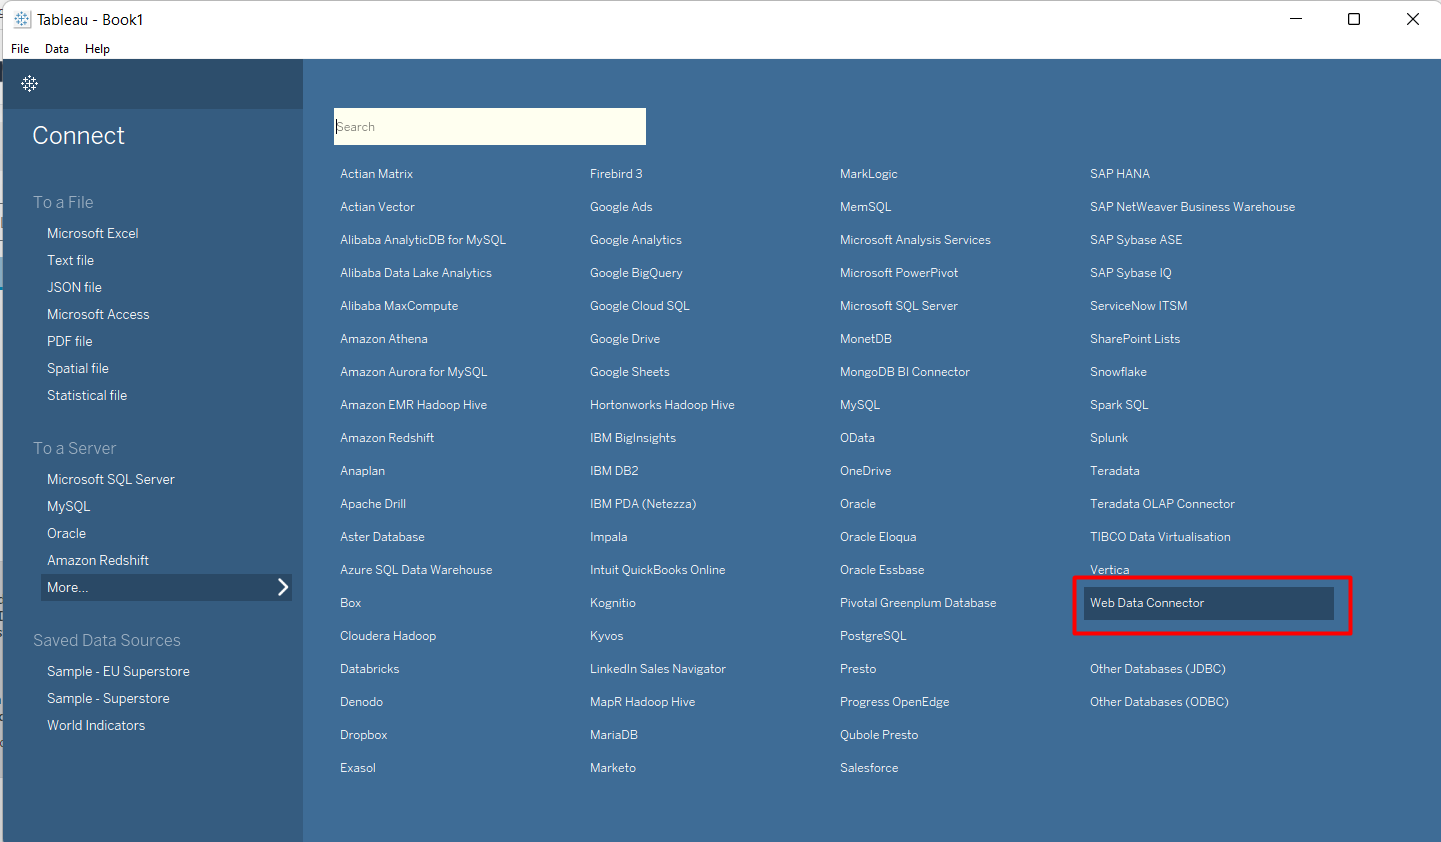
Open Tableau, and under “Connect”, click “To a Server”. Select “Web Data Connector” from the list of data sources and input the address https://tableau.windsor.ai/.
Step four
Copy the URL from the box below. This URL has a unique identifier that will allow Windsor.ai to connect to your Google Ads account and pull the data that you have selected.

Step five
In the Tableau URL field, paste the URL you copied in Step four and click “Enter”.
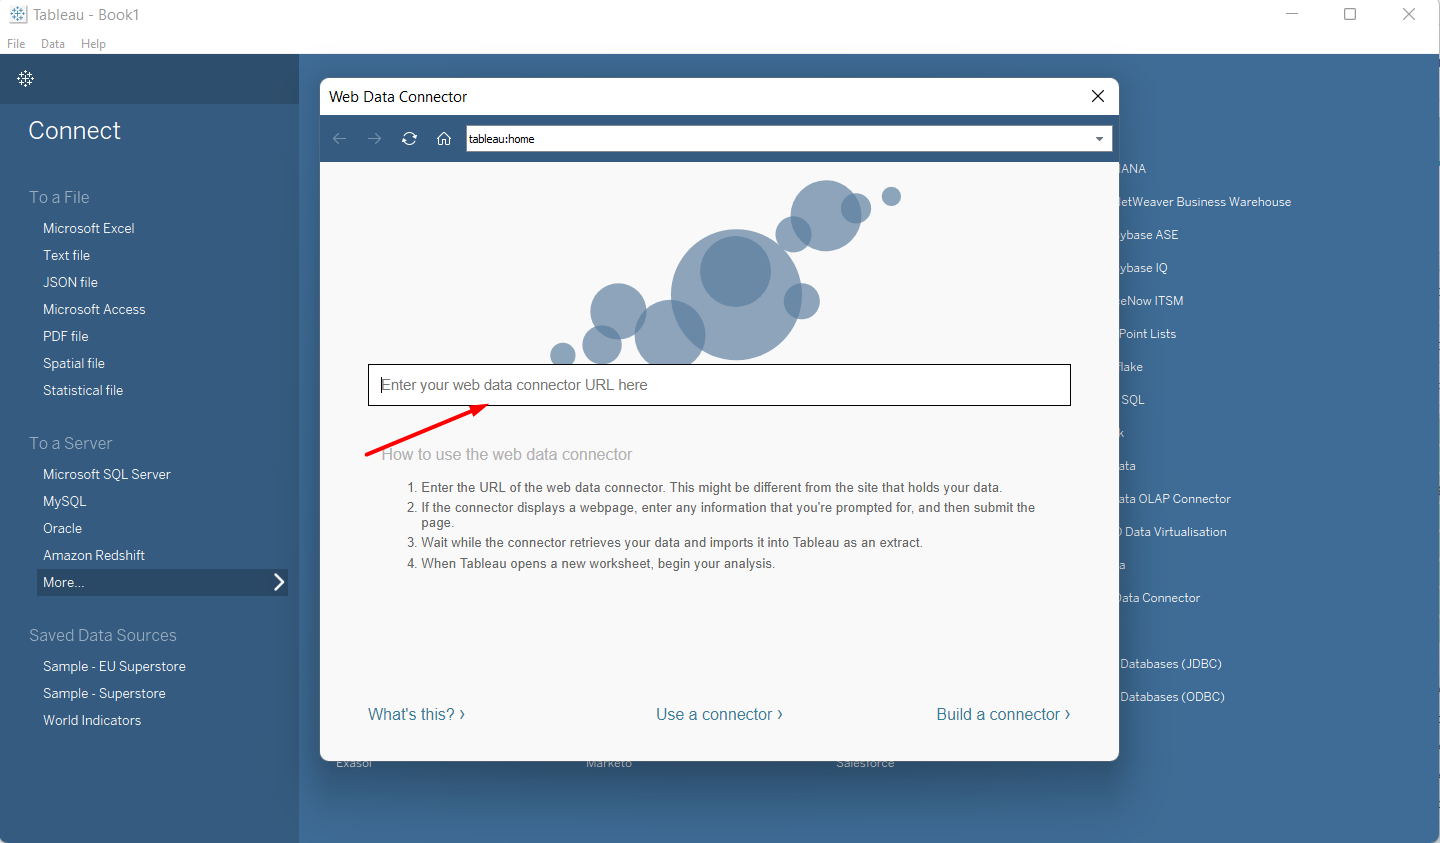
The connector may display a webpage asking you to enter some information. This is normal; you can fill in the details as prompted and submit the page.
When you submit the page, Windsor.ai will begin pulling data from your Google Ads account and creating a Tableau workbook.
You can now start exploring your Google Ads data in Tableau!

Try Windsor.ai today
Access all your data from your favorite sources in one place.
Get started for free with a 30 - day trial.
Customize the Dashboard
Once you have connected your Google Ads to Tableau, you can start creating visualizations. The Tableau Google Ads connector offers a wide variety of visualization types that you can use to represent your data.
You can also customize the Tableau Google Ads dashboard to make it more informative and user-friendly. Some of the things that you can do to customize the dashboard include:
1. Use custom filters
Custom filters will let you focus on the data that is most important to you. For example, you can add campaign type, language, or location filters. This will help you to narrow down the data and make it easier to analyze.
The filtering options will depend on your selected data when connecting Google Ads to Tableau. If you want to change the data that is being filtered, you can go back to the Windsor.ai platform and select different fields.
2. Blend data
Data blending is a process of combining data from multiple sources into one visualization. This is helpful when you want to compare data from two different data sources. For example, you can blend data from Google Ads and Google Analytics to compare traffic data.
To blend data in Tableau, you need to create a new connection to the data source that you want to blend. Once you have created the connection, you can drag and drop the fields you want to blend into the visualization.
3. Themes, templates, and extensions
Tableau offers a wide variety of themes, templates, and extensions that you can use to customize your Google Ads dashboard in Tableau. These will help you to make your dashboard more visually appealing and informative.
Themes will change the color scheme and layout of your dashboard. Templates are pre-built dashboards you can use as a starting point for your dashboard. They are a great way to save time and get inspiration for your dashboard design. Extensions are add-ons that you can use to add new functionality to your dashboard.
4. Visual elements
The visual elements in your dashboard are important for making it more user-friendly. Tableau offers various visual elements, such as charts, graphs, and maps, that you can use to represent your data. They also offer a wide variety of color schemes that you can use to make your dashboard more visually appealing.
Some of the most popular visual elements that you can use in your Tableau Google Ads dashboard include:
- Time-series charts: These charts help visualize data over time. You can use them to track trends and patterns in your data.
- World Map: The world map is a great way to visualize data with a geographical component. For example, you can use it to track the location of your website visitors.
5. Calculated field
A calculated field is a space where you can enter a formula to calculate values based on the data in your table. This is helpful when creating custom formulas to analyze your data and gain more insights. For example, you can create a calculated field to calculate the conversion rate for each campaign.
6. Publish your dashboard
Once you have customized your Google Ads dashboard in Tableau, you can publish it so that others in your organization can view and interact with it. Tableau Online and Tableau Server are two popular options for publishing your dashboard.
You can start a conversation using your dashboard to get feedback and ideas from others in your organization. This will help you to make further improvements to your analysis.
FAQ
This section will answer some common questions about connecting Google Ads to Tableau.
Can Tableau connect to Google Ads?
Yes, Tableau can connect to Google Ads. To complete the Google Ads Tableau integration, you need a connector that will connect the two platforms. Windsor.ai is a Tableau Google Ads connector that helps you improve your Google Ads campaigns by providing insights and recommendations based on data analysis.
The connector helps you to connect your Google Ads account to Tableau by authenticating the connection and then retrieving the data from your account.
How do I link Google Ads to Tableau?
To link Google Ads to Tableau, you can use a connector that will connect the two platforms. Windsor.ai can help you connect your Google Ads account to Tableau. It helps you manage and automate your Google Ads campaigns by providing insights and recommendations based on data analysis.
Try Windsor.ai today
Access all your data from your favorite sources in one place.
Get started for free with a 30 - day trial.
Templates fo Google Ads and Tableau


Google Ads metrics available for streaming into Tableau
Extract Google Ads data to Tableau with Windsor.ai
See the value and return on every marketing touchpoint

Providing 70+ marketing data streams, we make sure that all the data we integrate is fresh and accessible by marketers, whenever they want.

Spend less time on manual data loading and spreadsheets. Focus on delighting your customers.


