Tableau is widely used for data visualization. To get your GA4, Facebook Ads, Google Ads, Bing Ads, LinkedIn Ads to Tableau is easy. Depending on your set up you work with a set of spreadsheets or database tables. Using a service like what I describe below is a good alternative to get started fast and have the whole process automated.
With the connector below you can easily get all your data from:
- GA4
- Google Ads
- Facebook Ads
- Bing Ads
- LinkedIn Ads
- Snapchat Ads
- Twitter Ads
- Salesforce
- HubSpot
- Stripe
- Pipedrive
- Zoho
- …
into Tableau. The actual list of channels is longer (and growing) and can be found here: Tableau Data Connectors
Let’s get started. The process will take a few steps:
It’s important that before you start that you have access (to authorise apps) on all the platforms you wish to integrate. You should also have Tableau Desktop installed. No programming skills are required.
Connecting your data
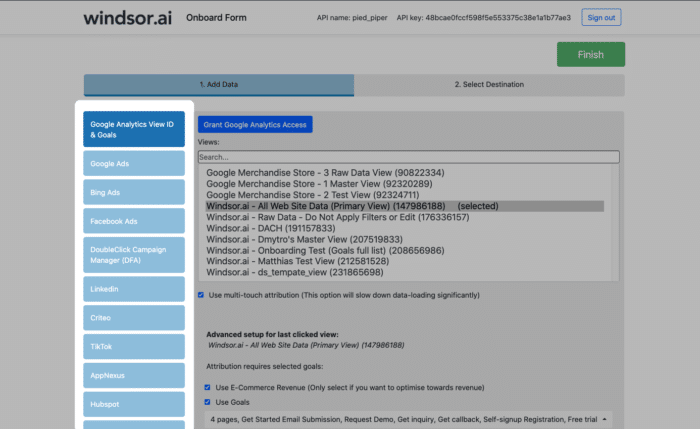
1. Head to Data Onboarding and connect all the data sources:
Add Data – you want to have available in Tableau.
1. Once you are done connecting your data head to
2. Select Destination and select Tableau in the I want to have my data in dropdown. Then select I do any transformations in my own tool. Click on the Copy button to save your API URL into your clipboard. We will use it later when we load the data into Tableau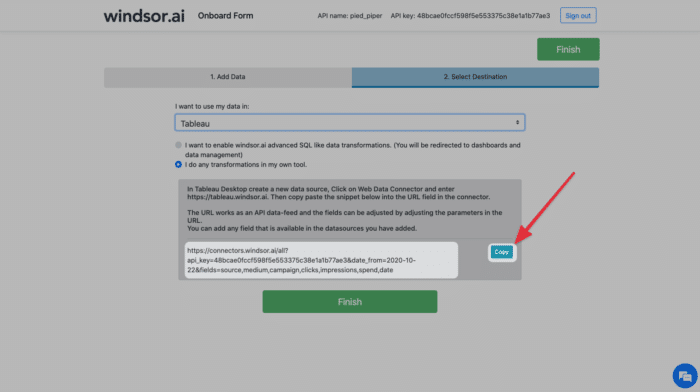
Importing data into Tableau using a Web Data Connector
Now that you have your data sources connected. Let’s get it into Tableau. Let’s get back to the
Our Tableau Connector allows you to visualise all your Windsor.ai data directly in Tableau.
To get the data visualised you will need to do the following:
- Configure the Windsor.ai Connector in your Tableau Desktop: Open Tableau Desktop, head to Connect > To a Server > More… > Web Data Connector
In the window you enter the URL https://tableau.windsor.ai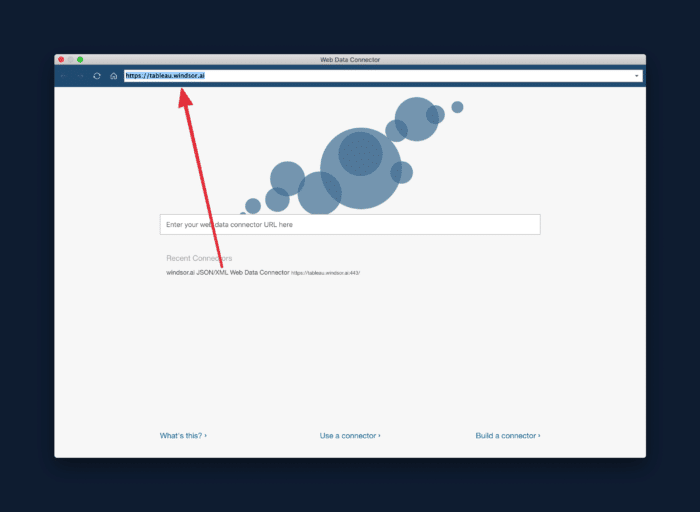
- Load your data using the Windsor.ai Connector: Inside the connector enter your Windsor.ai API URL. For this you will need the PAI url you have generated in the first part of this tutorial. Here is a sample URL:
https://connectors.windsor.ai/all?api_key=[your API key]&date_from=2020-10-22&fields=source,medium,campaign,clicks,impressions,spend,dateAs you can see in the URL we have a set of fields, your API key and a start date. You can adjust the API url by changing the date (in YYYY-MM-DD format).I strongly recommend to test this first with the standard URL you get in Step 1. Once this works and you have the data set in Tableau you can look at customising your query:To see what other fields are available you can refer to the documentation of connectors. If you want to query specific metrics from connectors, for example Google Analytics custom dimensions or Facebook Ads custom conversions, you can find information on how to get your fields into Tableau here. - Configure your data set
Select the columns you want to load and specify the name of the table and click Submit
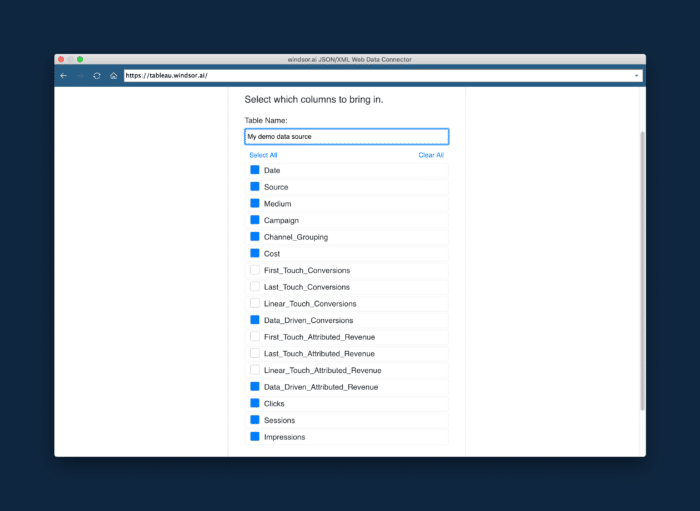
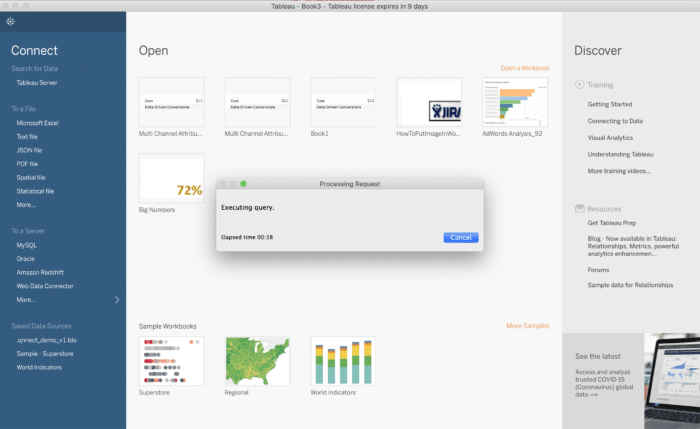
- Start visualising your data Now your data is connected and you will be able to create reports, dashboards and join your data with other data sets you might have.
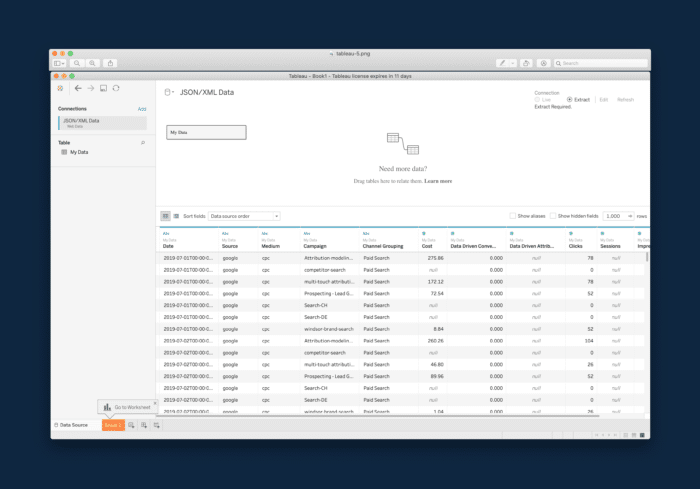
In case you do not have a marketing dashboard at hand to connect your data to, please have a look at our Marketing Report Template gallery. You can find examples and templates which are ready to be used with our data sets. If you have any questions just drop us a message in the chat and we’ll get back to you immediately.
