
One of the reasons Facebook is such a popular and successful marketing platform is the fact that it provides detailed insight that allows marketers to scale and optimize their campaigns with ease.
Having fresh Meta Ads (Facebook Ads) in Power BI is very useful. Especially in case, you are investing heavily in Facebook and Power BI is your central reporting platform. Here we are going to explain how to connect Facebook Ads to Power BI.
Table of Contents:
- Detailed information about Facebook Ads and Power BI
- How to start with Facebook Ads and Power BI Connector?
- What data can I investigate with Power BI Facebook Ads report?
- Free Power BI Facebook Ads Dashboard Templates
- FAQ: Facebook Ads Power BI Integration
Detailed information about Facebook Ads and Power BI
About Power BI
Power BI isn’t just a visualisation tool, it is a service offered by Microsoft, it has a very simple interface and in addition to visualisations it also has business intelligence capabilities. There is a Power BI desktop and a Power BI web service, you can use either or both depending on your preference.
You can create interactive reports and model your data as you prefer and if you have used any Office product, working in Power BI will come naturally to you.
About Facebook Ads
Facebook Ads, via Meta Ads Manager is the platform that allows you to use Facebook as a marketing tool. You can target users based on their geolocation, their gender, age or a range of other characteristics. It is possible to build custom audiences, but it is also possible to build audiences based on their interests as well as lookalike audiences.
A lookalike audience is an audience which is created by Facebook based on an existing audience data provided by you. Facebook uses the data it has on the existing base audience to create a group that matches it. If the base audience are your customers, it is likely that the lookalike audience will have a high conversion rate.
If your goal is to collect leads, you can do that as well and we already explained how to connect Facebook Ads to Power BI in the detailed step-by-step process above.
How to start with Facebook Ads and Power BI Connector?
The whole process should not take more than 5 minutes and you can choose between >200 different dimensions and metrics from Facebook Ads.
As a prerequisite, you’ll need a Windsor.ai account which you can get here.
Option One
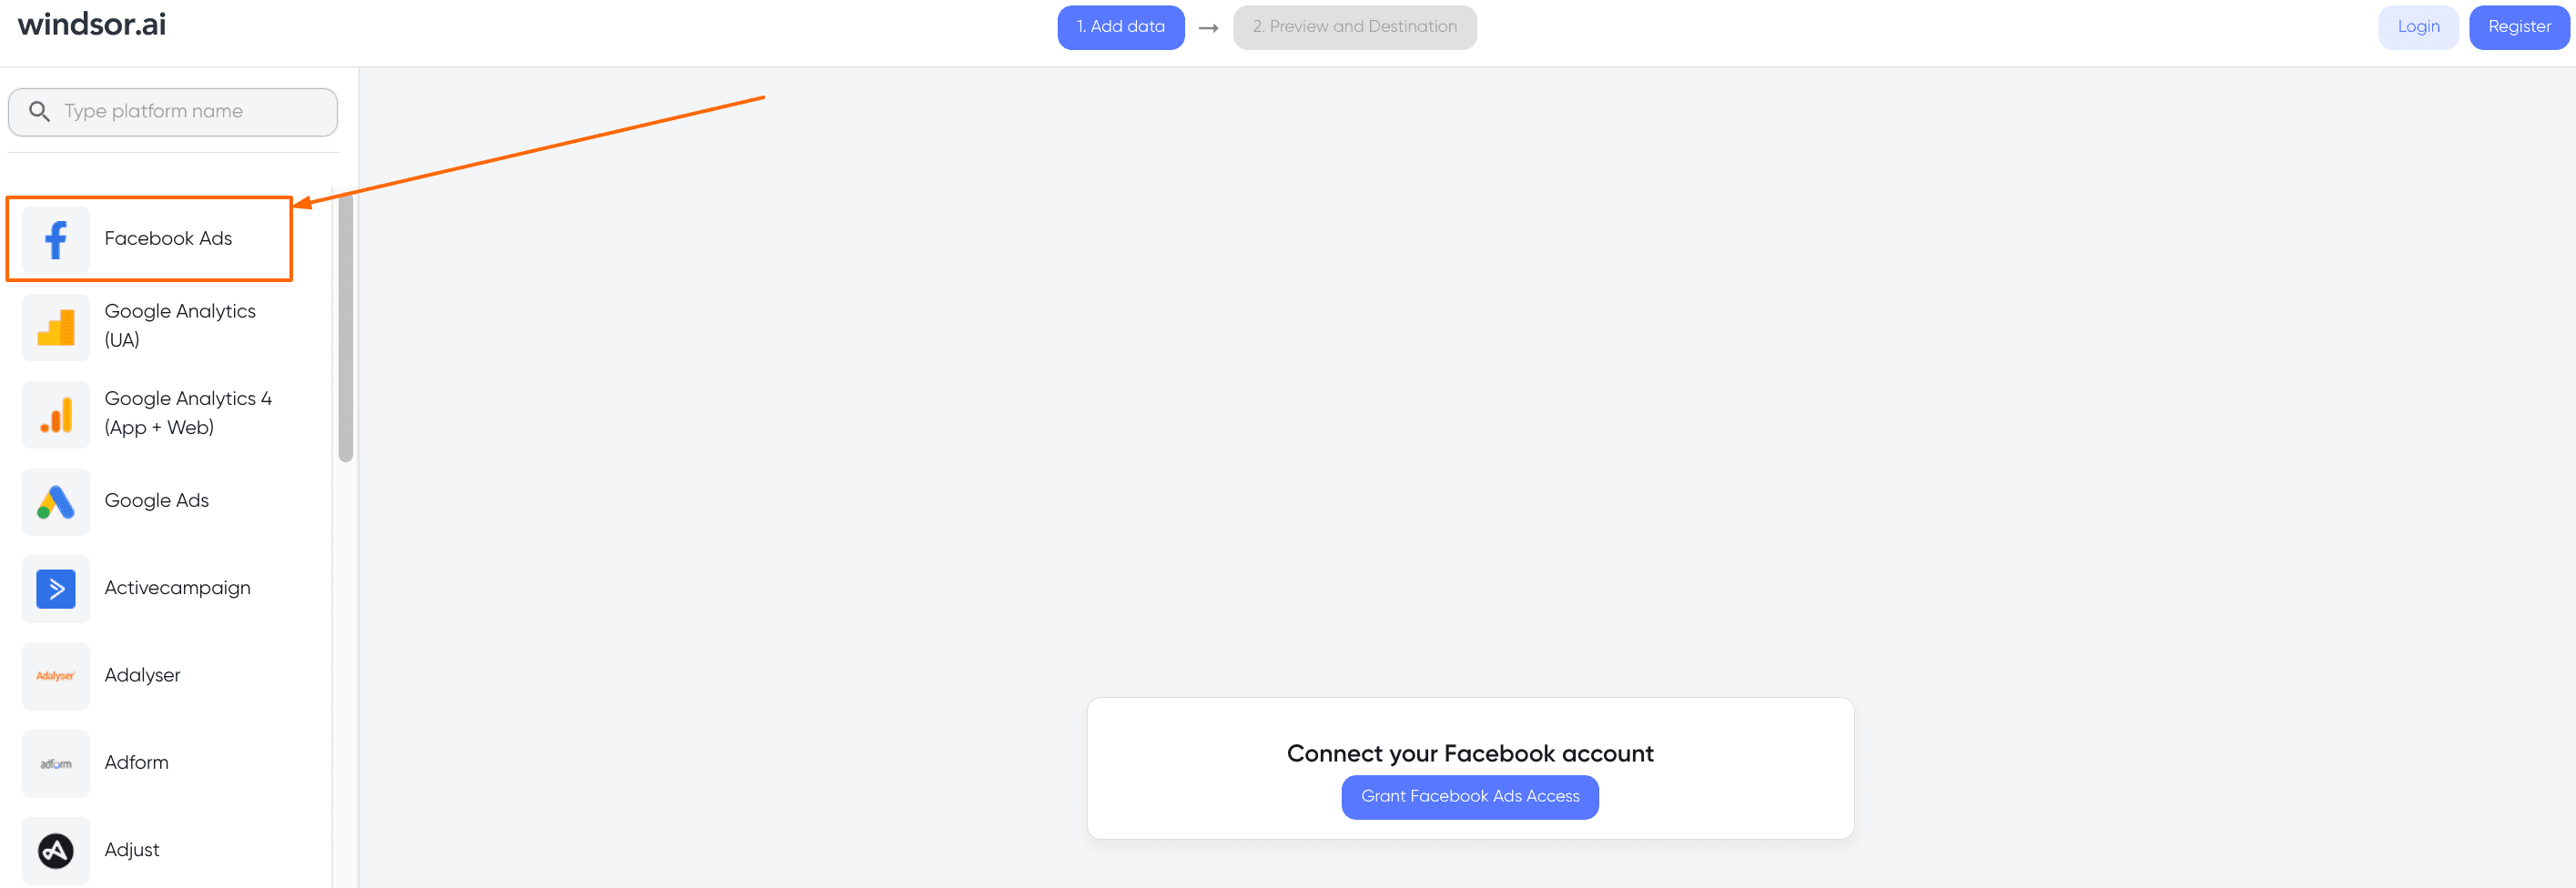
1. First, you need to select Facebook Ads as Data Source and Grant Facebook Access to Windsor.ai.
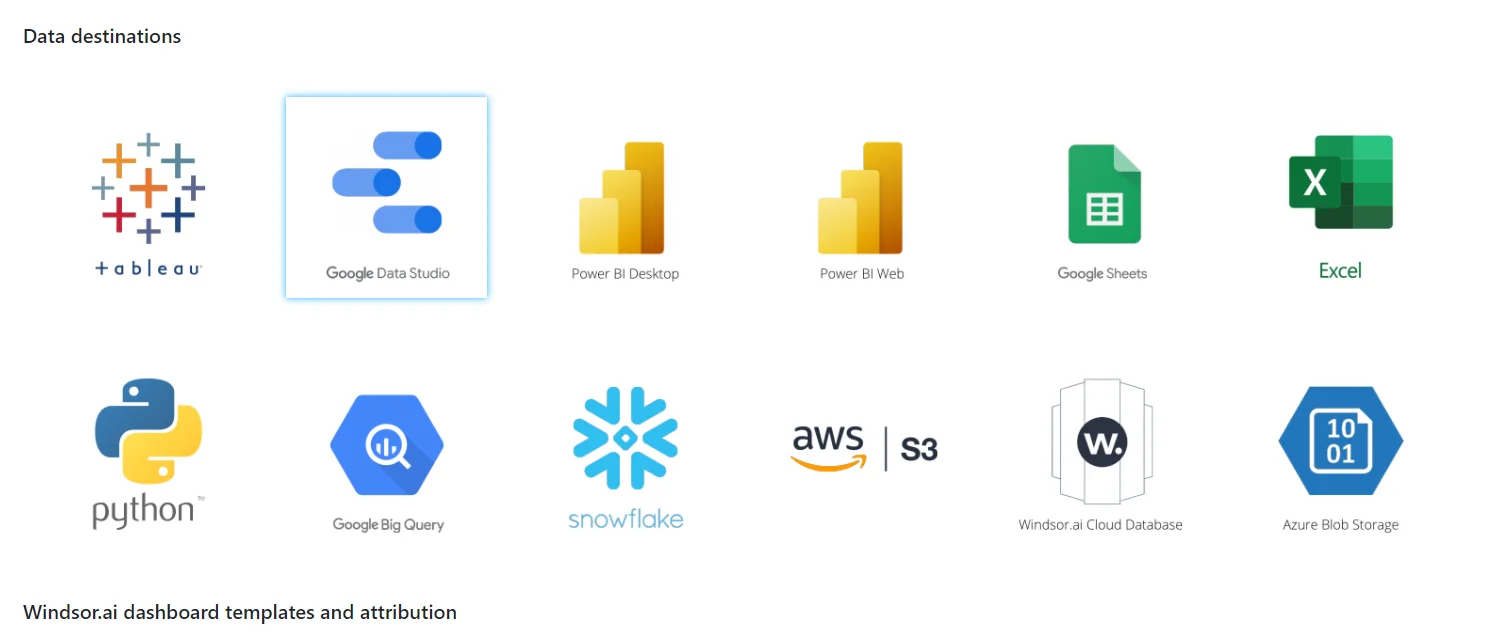
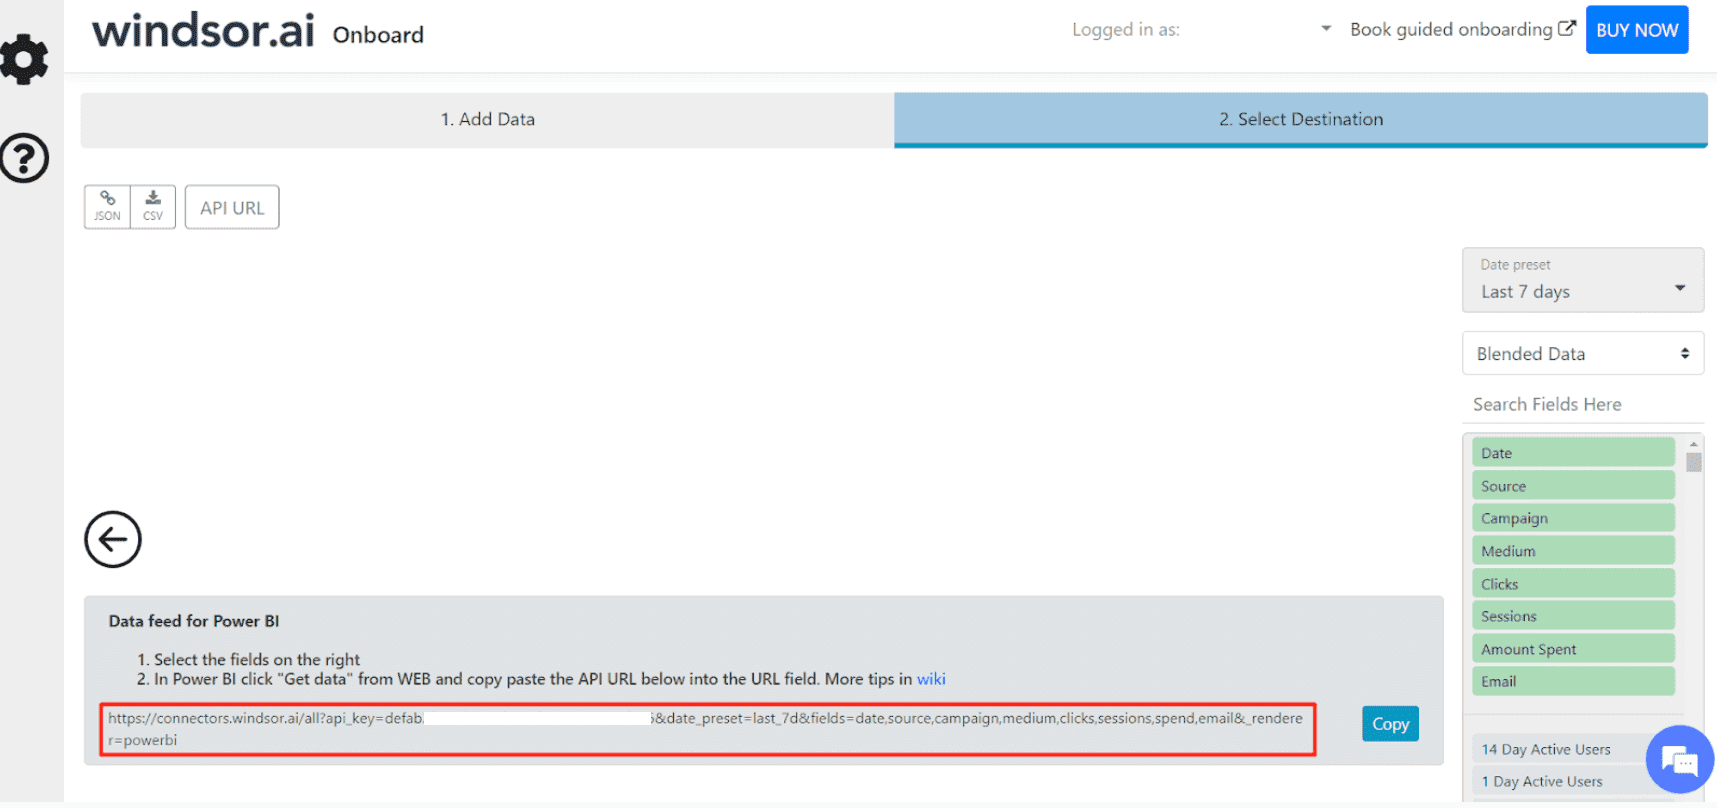
2. Go to “Select Destination” and Choose Power BI Desktop/Web
3. Select the fields on the right, and in Power Bi click on “Get data” from WEB.
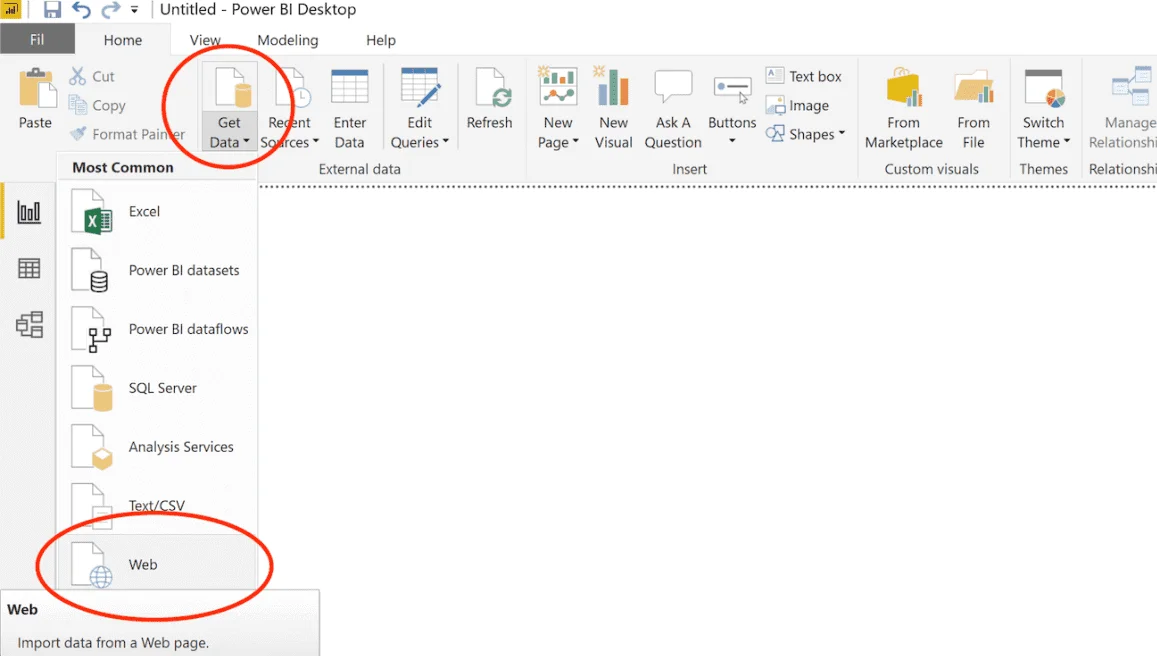
4. And copy the URL in the box below:
Try Windsor.ai today
Access all your data from your favorite sources in one place.
Get started for free with a 30 - day trial.
Option Two
- Install the Power BI Web App
Install Power BI Web App: Facebook Ads Overview Report
- Follow the instructions on the Connect Your Data page

- Connect Facebook Ads on https://onboard.windsor.ai/register
- Click on Connect your data on the top of the page, on the yellow background.

5. Enter your API key which you can get here

6. On the next screen click on Sign In
7. Your data should be loading now. Depending on your data size this may take a minute or two.
Also read:
Free Power BI Templates in 2024
Guide to Power BI for Marketing Analytics
How to connect Facebook Lead Ads to Microsoft Power BI
Best Facebook Ads Dashboard Templates
Supported data sources in Power BI
What data can I investigate with Power BI Facebook Ads report?
If you go back to step 3 you will see the default fields that you can analyse, but that’s just a fraction of what is actually available to you. Namely, you can analyse every metric that is available in Meta Ads Manager (Facebook Ads Manager), so whether that is cost per mile, conversions, or you would like to separate your audience by geo, gender, or age, all of that will be possible with our solution.
Let’s say that you want to see how your campaign performed in different countries or regions. You can customise your Meta Ads Manager (Facebook Ads Manager)data and once you integrate it into Power BI you can visualise and directly see the difference between conversions, cost per mile, CPC and every metric that you want to compare.
Meta Ads Manager (Facebook Ads Manager) offers access to an amazing set of categories and metrics, but it is not a visualisation tool and even if you download the reports and open them in Excel or Google Sheets, it still wouldn’t be very presentable.
Once you connect Facebook Ads to Power BI you will be able to present your data and findings in a much user-friendlier manner even to people who are not familiar with the marketing side of Facebook.
Free Power BI Meta Ads (Facebook Ads) Dashboard Templates
- Microsoft Power BI Multichannel Marketing Attribution Dashboard Template
- Power BI Facebook Ads Report Dashboard Template
- Power BI Facebook Ads vs Google Ads Report Template
- Power BI Facebook Leads Report Dashboard Template
- Power BI Paid Media Overview Dashboard Template
- Power BI Paid Social Overview Dashboard Template
- Power BI Paid Web Media Overview Dashboard Template
Why to choose Windsor.ai
Windsor.ai is an ETL platform that abstracts data from Facebook Ads, revamp it, and logically loads the conclusions to Power BI. Accelerate your decision-making capacity and promptly accumulate optimizations without undermining the time and Scrunching the data.
Promptly abstract marketing data from Facebook Ads in just a few clicks.
Associate data from multiple resources with 70+ connectors to commission your marketing team. Here are a few advantages:
- The average G2 Review score is an impressive 4.8 out of 5.
- ETL (Extract – Transform – Load) capability is provided for all data destinations, including databases, across all plans.
- All connectors are accessible across all plans, without the need for premium subscriptions.
- A wide selection of marketing dashboard templates is available for use.
- The platform is SOC 2 Type 2 certified and supports both single sign-on and multi-factor authentication.
- Support is provided through both email and live chat channels.
Try Windsor.ai today
Access all your data from your favorite sources in one place.
Get started for free with a 30 - day trial.
FAQ: Facebook Ads Power BI Integration
How do I connect my Facebook Ads account to Power BI?
To connect your Facebook Ads account to Power BI, you will need to set up a Facebook Developer account and obtain a Facebook Access Token. Once you have these, you can use the Facebook Marketing API to connect your Facebook Ads account to Power BI.
How to Connect Power BI to Facebook Ads?
To connect Power BI to Facebook ads you would need to go through the same step we outlined before, the only difference will be to grant access to your Facebook Ads account instead of your Facebook Lead Ads account.
Here’s a summary of the process:
1. Create a Facebook Business App
This step involves setting up a Facebook Business App to generate an access token for the Facebook Ads API. This access token will be used to authenticate your application when interacting with the API.
2. Write Code for Integration
You’ll need to write code in Python or another programming language to connect Facebook Ads to Power BI via the API. This code will perform two main tasks:
- Retrieve data from the Facebook Ads API: Determine what specific data you want to retrieve from the API. If you choose to use Python, you can install the necessary libraries (e.g.,
urllib3,facebook, andrequests) to facilitate this process. - Load the retrieved data from Facebook Ads into an SQL database: This step involves storing the data in a structured format that can be easily accessed and manipulated.
3. Execute the Code
To run the code, you’ll need to utilize a cloud tool such as Google Cloud, AWS (Amazon Web Services), or any other suitable platform. This will provide the necessary computing resources to execute the code and perform the integration.
4.Load Data into Power BI
Once the data is stored in the SQL database, you can use one of Power BI’s built-in connectors to pull the data into Power BI for analysis and visualization.