 AI insights
 About us
 Careers
 Security
 Customer reviews
 Contact us
 Affiliate program
 Solution partners
 Looker Studio templates
 Tableau templates
 Facebook Ads templates
 Google Ads templates
 Data fields & Metrics
 AI prompt library & Guides
 Product documentation
 API documentation
 Case studies
 Blog
Blog Data models
 Windsor vs Supermetrics
 Windsor vs Fivetran
 Windsor vs Portermetrics
 Last updated: 21 May 2025
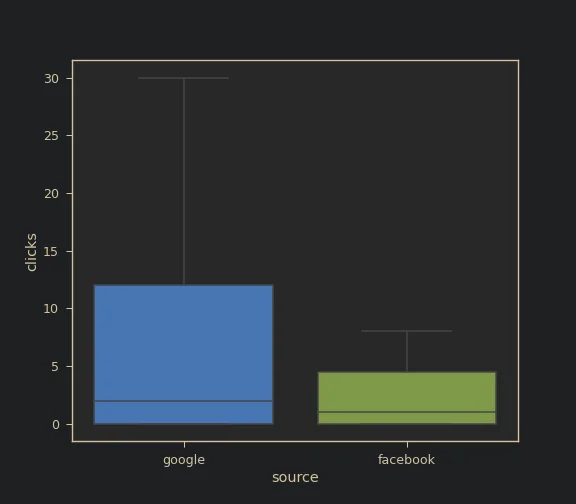

Introduction
Quite often we want to analyze how our ad impressions compare among various service providers. Let’s suppose that we have ad campaigns going on on different platforms such as Google Ads, Facebook Ads, TikTok Ads etc., and we want to observe if one of the platforms is statistically providing better outcomes for our overall marketing strategy. In this article, we will perform t-tests to compare the statistical significance among click means of Facebook and Google Ads.
T-Tests
Before we delve deeper into the topic, let’s understand what a t-test is and what it does. A t-test compares the averages of two samples and determines if they are derived from the same population. In other words, it aims to understand whether the values which come from two different datasets are the same or they differ somehow. In essence, it assumes that the two samples are in fact same; as a result, the problem hypotheses can be defined as follows
H0 : There is no difference between Facebook and Google Ads
H1 : Facebook and Google Ads clicks differ from one another
T-tests are mathematically expressed as

Analysis
We will be doing the t-tests analysis using python because it is very easy and can be completed with a few lines of code. Let’s kick it off.
Start by installing the necessary python libraries
pip install pywindsorai pandas matplotlib seaborn scipyPywindsorai is the package which will help us bring together all the ad data into python whereas pandas, matplotlib, seaborn, and scipy are needed for data wrangling, plotting, and statistical analysis, respectively.
Next, load all the necessary libraries
from pywindsorai.client import Client
import matplotlib.pyplot as plt
import seaborn as sns
import pandas as pd
from scipy.stats import ttest_ind
Import Facebook Ads and Google Ads data into python by using the Windsor.ai token. You can obtain your token by registering for a free account here.
client = Client("your key")
campaign_clicks = client.connectors(
    date_from="2022-10-01",
    date_to="2022-11-01",
    fields=["country", "source", "campaign", "clicks", "spend"]
)
dataset = pd.DataFrame(campaign_clicks["data"])
dataset.head(5)
>>> 	country 	source 	campaign 	           clicks 	spend
0 	AT 	     facebook 	retargeting UK&CO 	      0 	0.54
1 	AU 	     facebook 	retageting  APAC 	      2 	8.93
2 	AU 	     facebook 	retargeting UK&CO 	      0 	0.00
3 	BE 	     facebook 	retargeting UK&CO 	      0 	1.22
4 	CH 	     facebook 	retargeting DACH 	      3 	4.14
Before we conduct our analysis, let’s plot the data to see if the values seem to differ from one another. This can be done by running
fig = sns.boxplot(data=dataset[["source", "clicks"]], x="source", y="clicks", showfliers=False)
plt.savefig("facebook_google_boxplot.png")
As it can be seen from the figure, the means look pretty much the same. However, standard deviation differs quite a bit. Let’s perform our test. Firstly, let’s group by source and get only the click values from the dataset.
source_values = dataset.groupby('source')['clicks'].apply(lambda x: x.values)
source_values
>>>
source
facebook    [0, 2, 0, 0, 3, 0, 0, 6, 0, 8, 3, 5, 1, 7, 0, ...
google      [0, 2, 6, 14, 3, 6, 5, 18, 1, 55, 18, 21, 17, ...
Name: clicks, dtype: object
Lastly, let’s perform the t-test to compare the click means of Facebook and Google Ads
pvalue = ttest_ind(*source_values, nan_policy="omit").pvalue
print(pvalue)
print("There is no significant difference between clicks of Facebook and Google") if pvalue > 0.05 else print("There is statistical difference between Facebook and Google Ads")
>>>
0.2861581873791922
There is no significant difference between clicks of Facebook and Google
Conclusion
With 95% confidence we can argue that the mean clicks between Google and Facebook Ads do not differ. The results show that the p-value is 0.28 which is much larger than 0.05. Thus, we can reject the alternative hypothesis H1 and accept the null hypothesis H0.
For more about Ad impressions, integration, and analysis check our blog https://windsor.ai/blog/.

