 Destinations
 Data sources
 AI insights
 About us
 Careers
 Security
 Customer reviews
 Contact us
 Affiliate program
 Solution partners
 Template gallery
 Looker Studio templates
 Power BI templates
 Excel templates
 Google Sheets templates
 Tableau templates
 Facebook Ads templates
 Google Ads templates
 Data fields & Metrics
 AI prompt library & Guides
 Product documentation
 API documentation
 Case studies
 Blog
 Data models
 Windsor vs Supermetrics
 Windsor vs Funnel.io
 Windsor vs Fivetran
 Windsor vs Rivery
 Windsor vs Portermetrics
 Windsor vs Coupler.io
60+ Free Data Studio Templates & Dashboards
Browse 60+ free Data Studio templates (formerly Looker Studio) for Facebook Ads, Google Ads, GA4, TikTok, Shopify, and 350+ more sources. Pick a template, connect your data, and analyze cross-channel performance; no CSV exports, no building from scratch.
 Sign up with Google
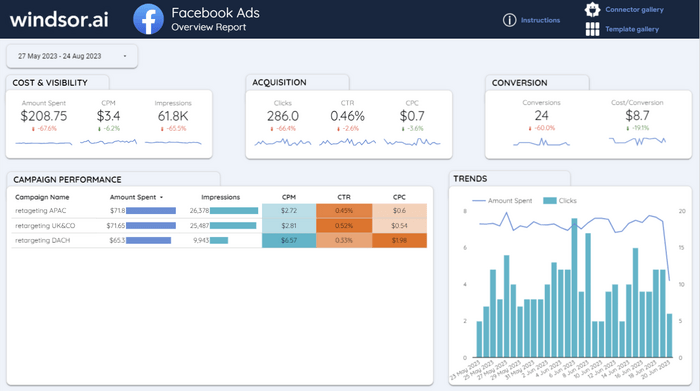
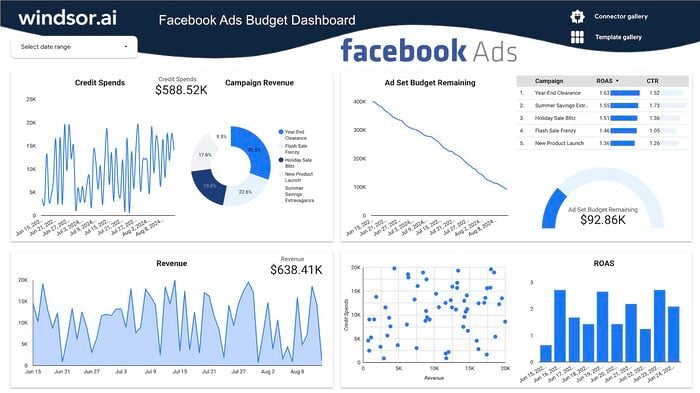
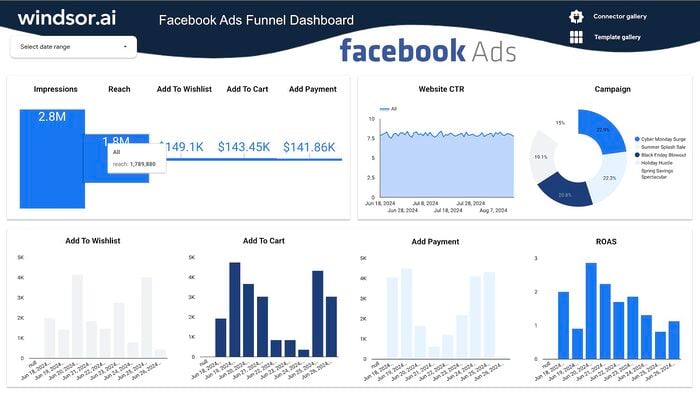
Facebook Ads Overview Report for Looker Studio


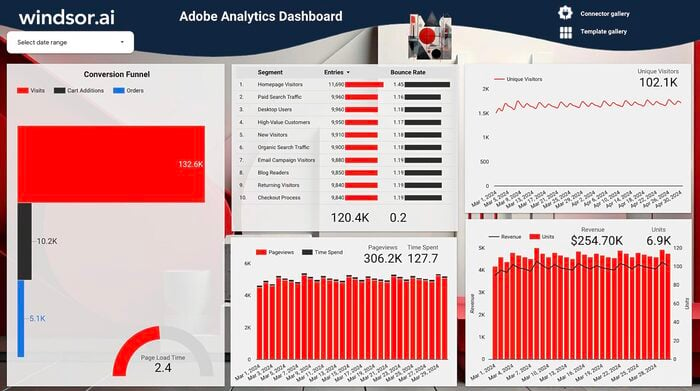
Free Adobe Analytics Dashboard Template on Looker Studio

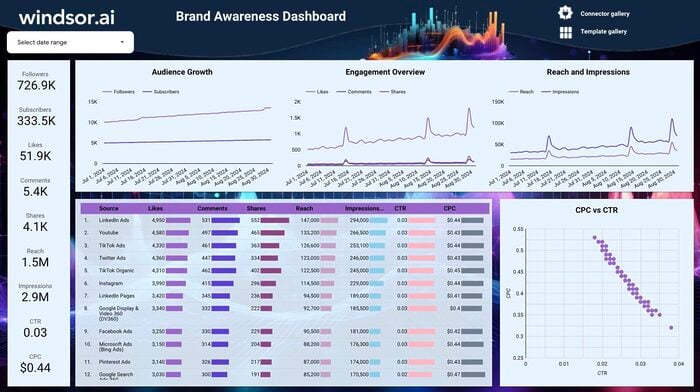








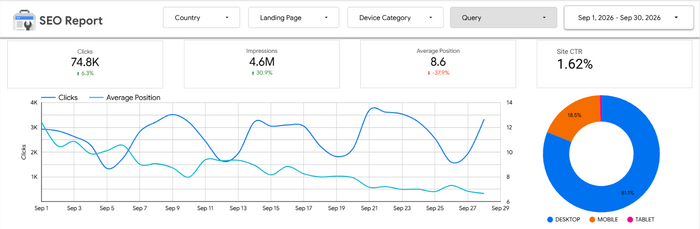




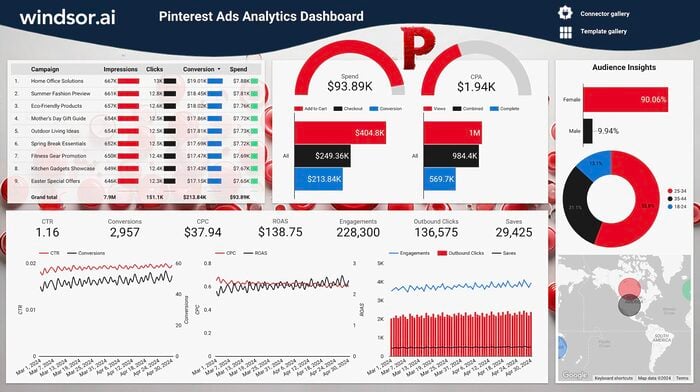
Free Pinterest Ads Dashboard Template on Looker Studio
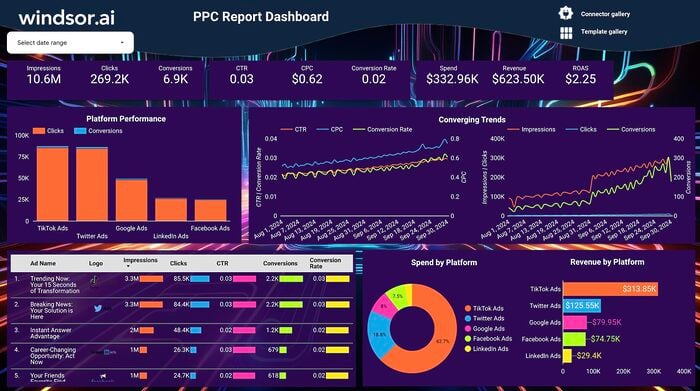
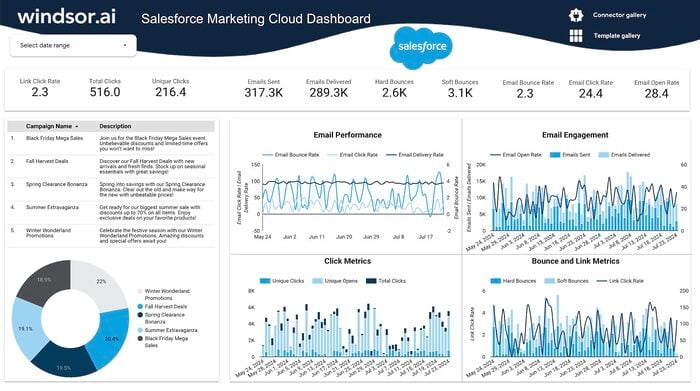

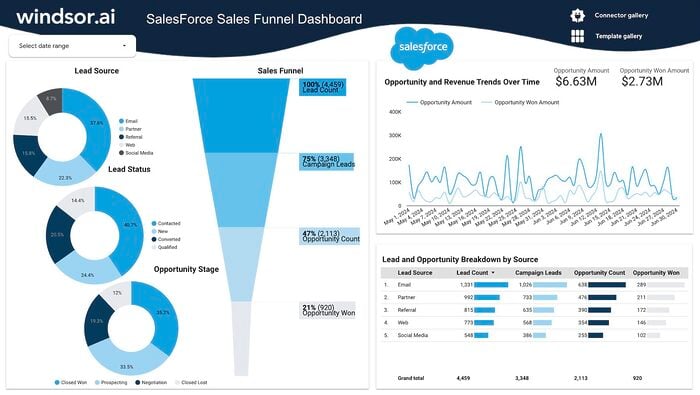

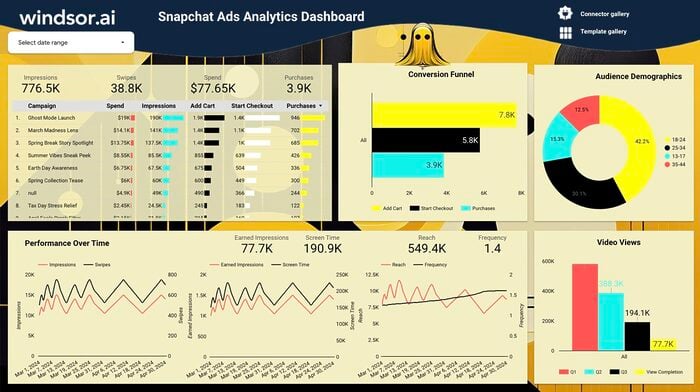
Free Snapchat Ads Dashboard Template on Looker Studio



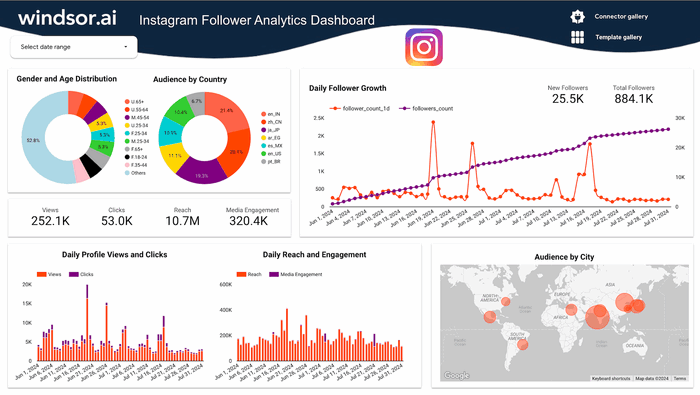
Instagram Follower Tracker: Track Growth Over Time
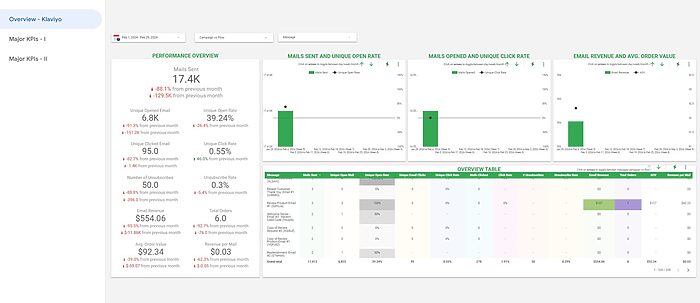
Klaviyo Looker Studio Dashboard

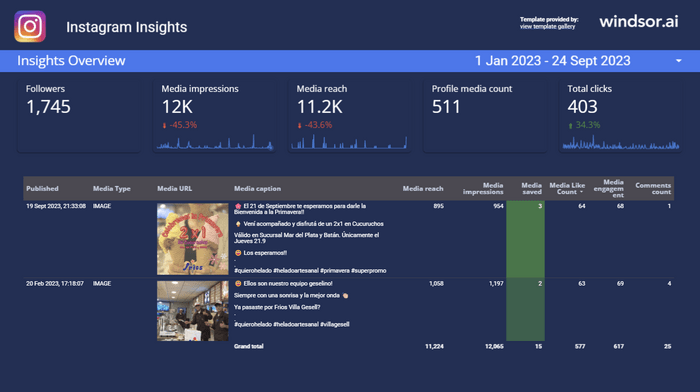
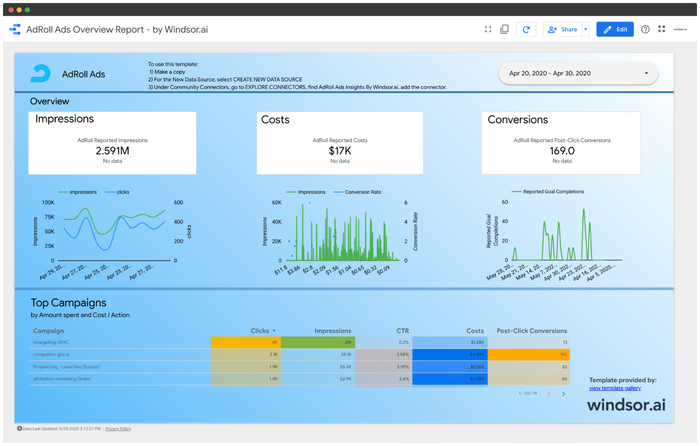
Looker Studio AdRoll Ads Overview Report


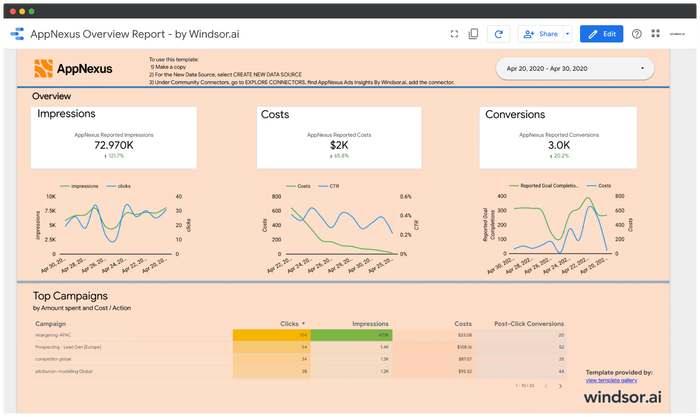
Looker Studio AppNexus Overview Report

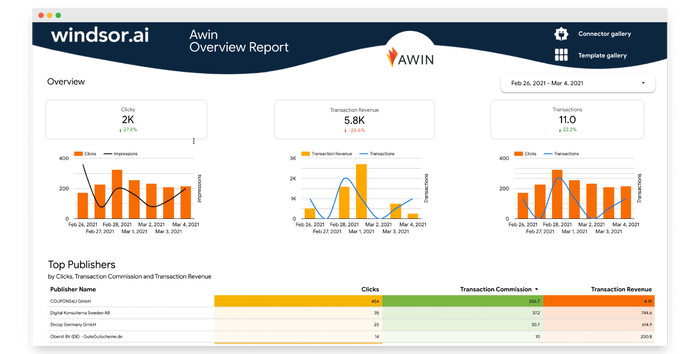
Looker Studio Awin Overview Report
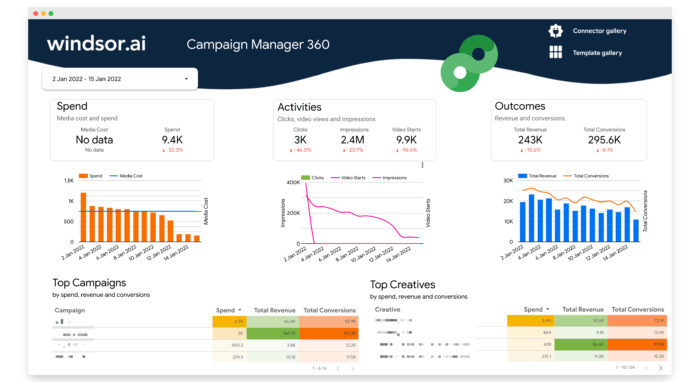
Looker Studio Campaign Manager 360 (DCM) Overview Report

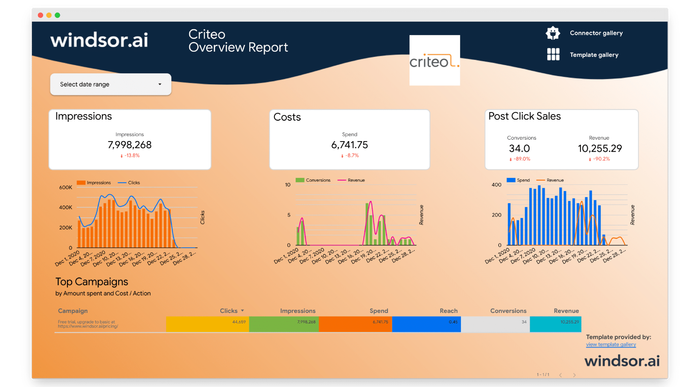
Looker Studio Criteo Overview Report

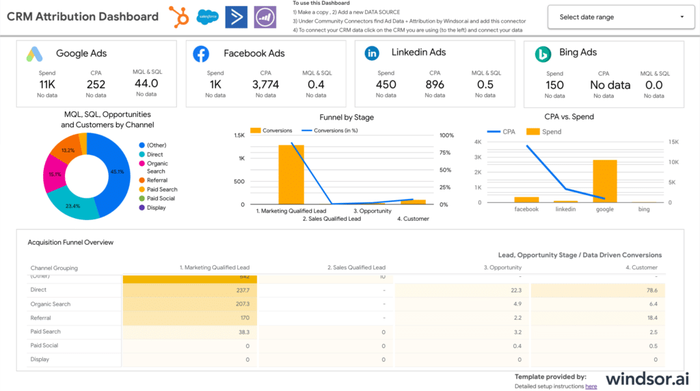
Looker Studio CRM Attribution Dashboard Template
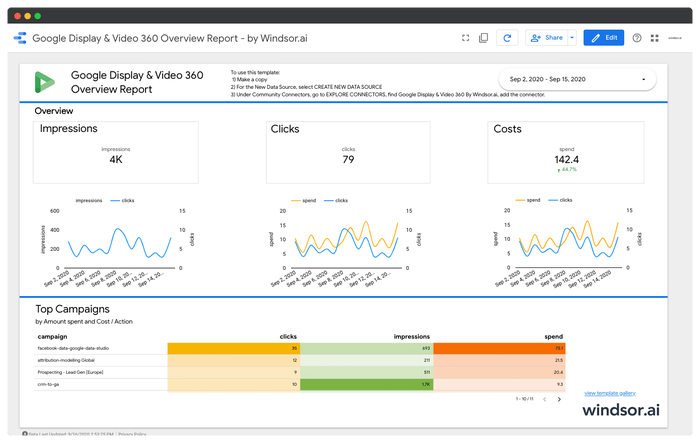
Looker Studio DV 360 Overview Report

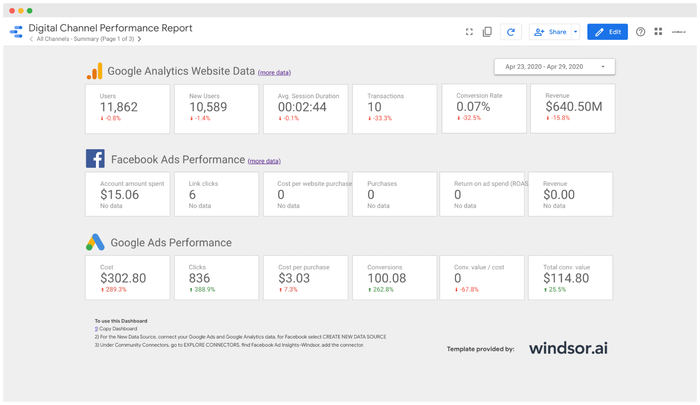
Looker Studio Facebook Ads E-commerce Dashboard Template
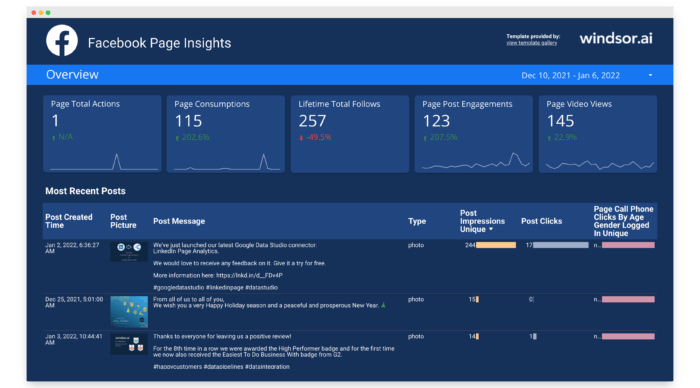
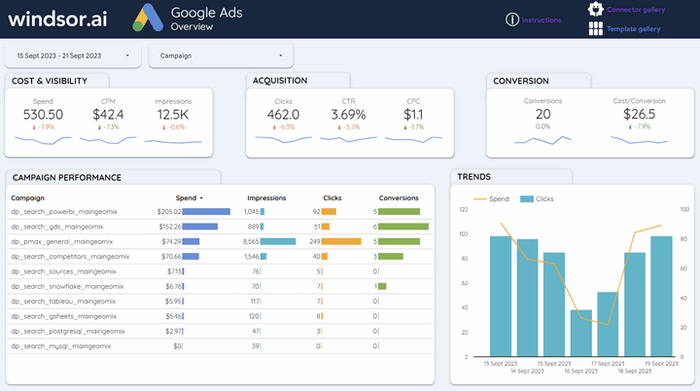
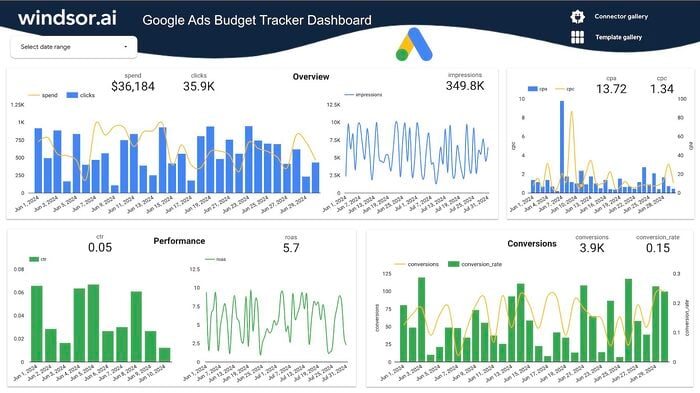
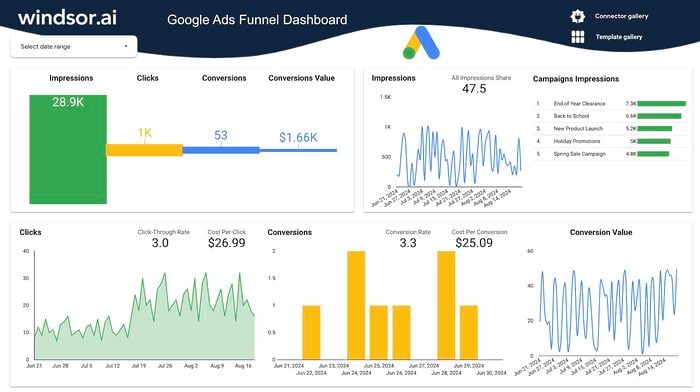
Looker Studio Google Ads Dashboard Template
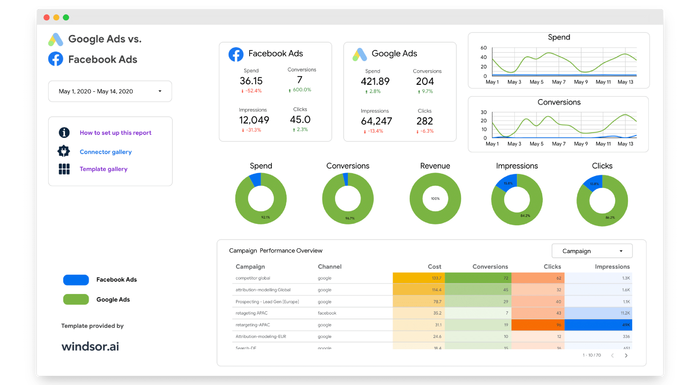

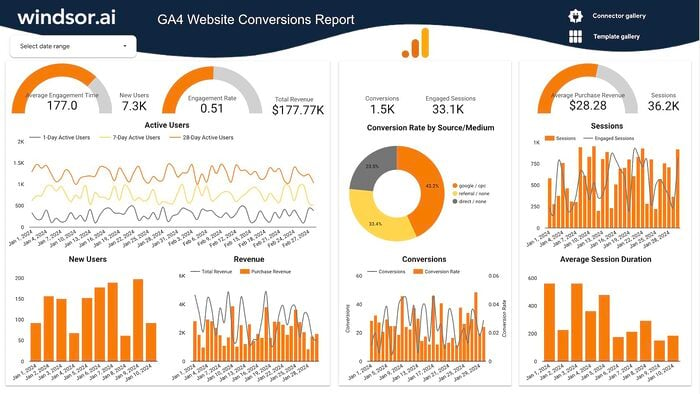
Looker Studio Google Analytics 4 Dashboard Template

Looker Studio Google My Business Dashboard Template

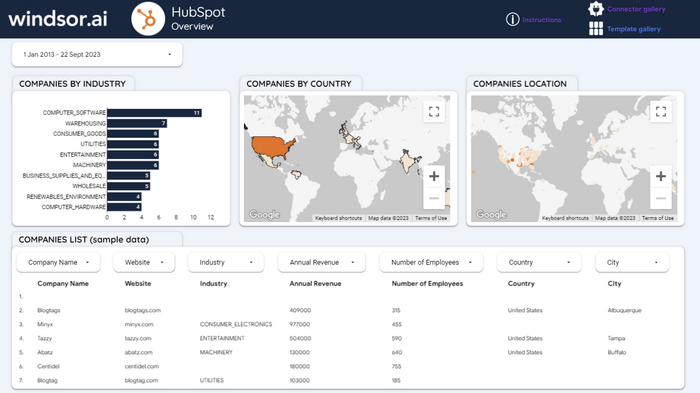
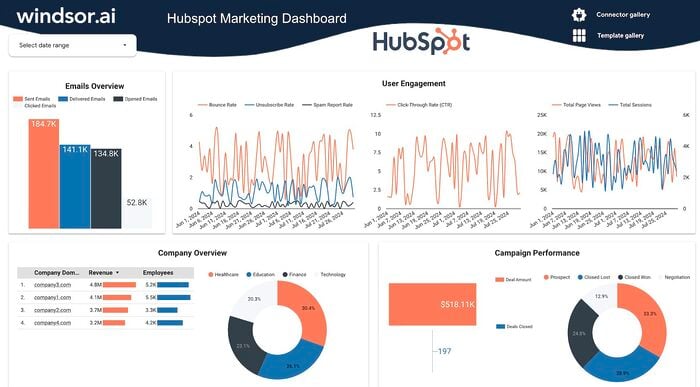
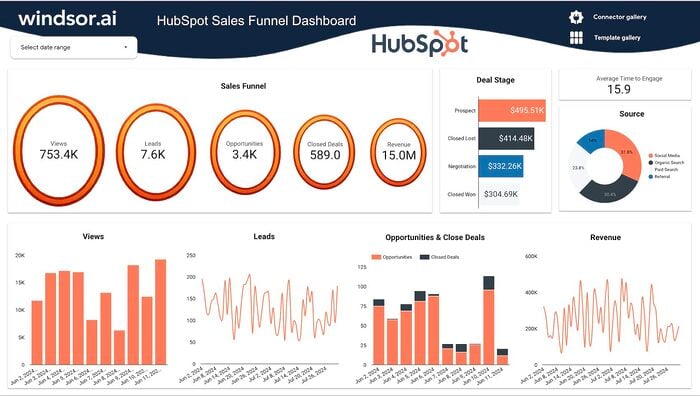
Looker Studio HubSpot Dashboard Template
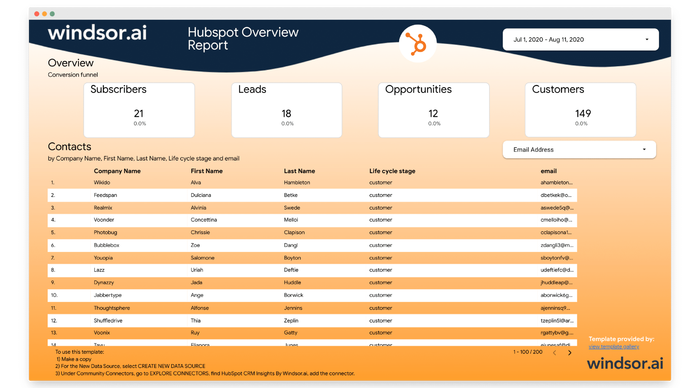
Looker Studio HubSpot Overview Report

Looker Studio LinkedIn Ads Dashboard Template
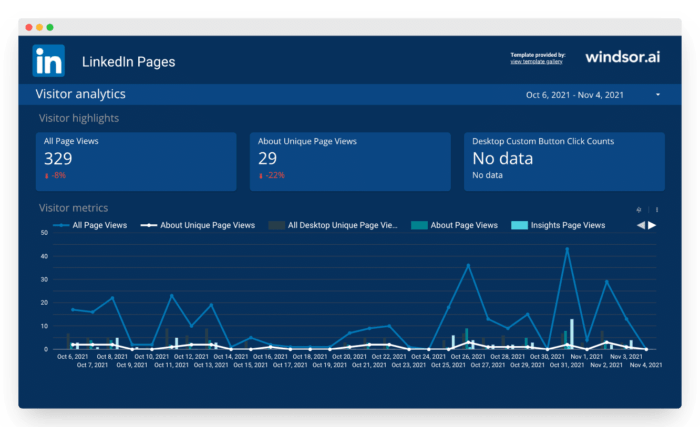
Looker Studio LinkedIn Pages Overview Report
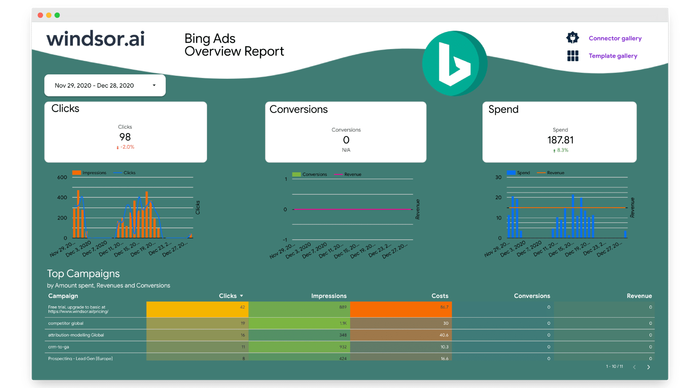
Looker Studio Microsoft Ads Overview Report
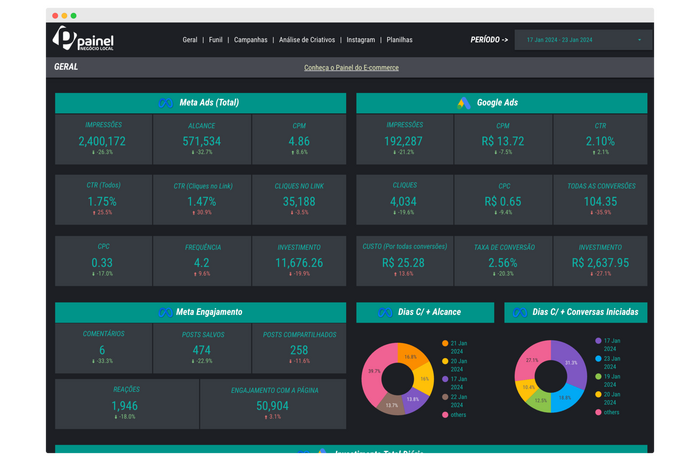
Looker Studio Painel Para Negócios Locais
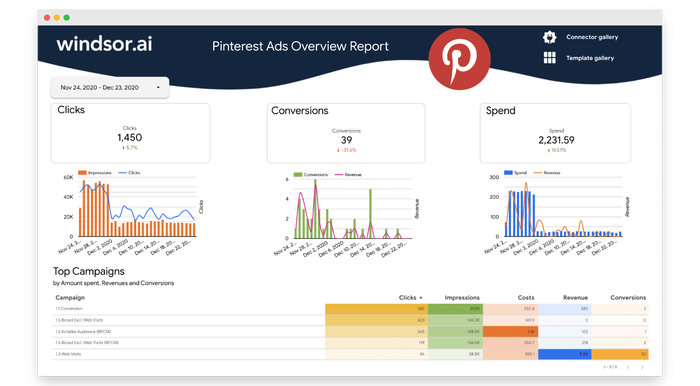
Looker Studio Pinterest Ads Overview Report
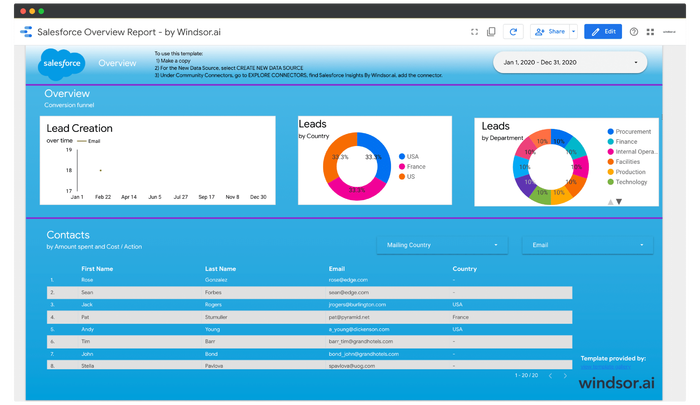
Looker Studio Salesforce Overview Report
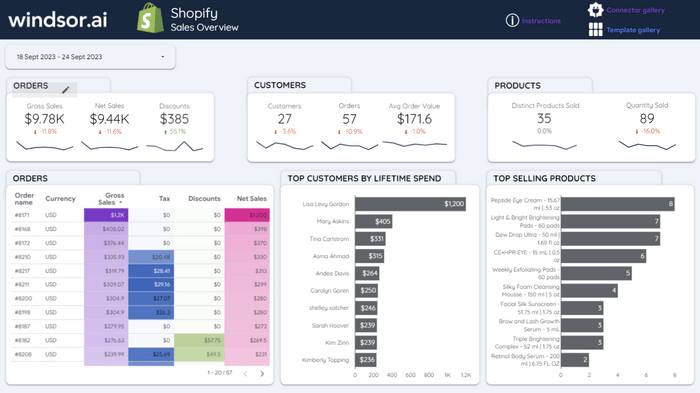
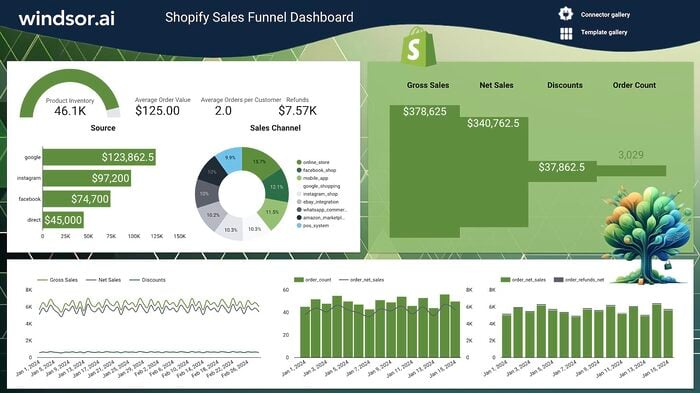
Looker Studio Shopify Dashboard Template
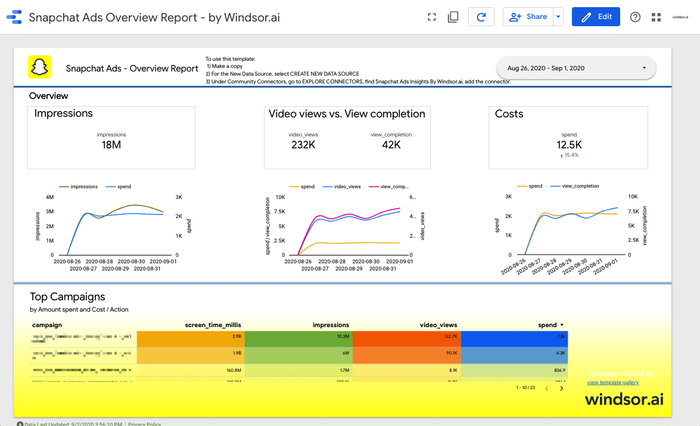
Looker Studio Snapchat Ads Overview Report
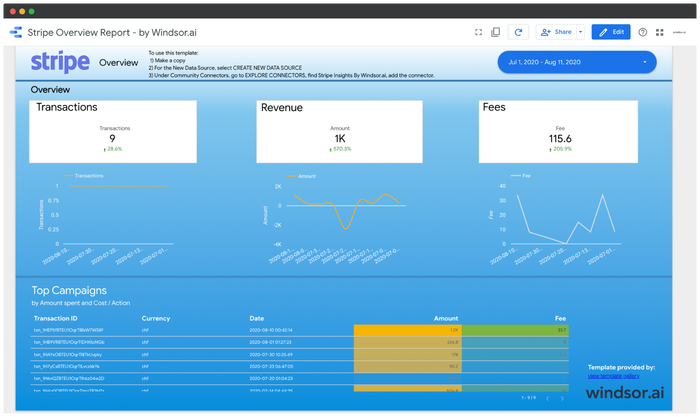
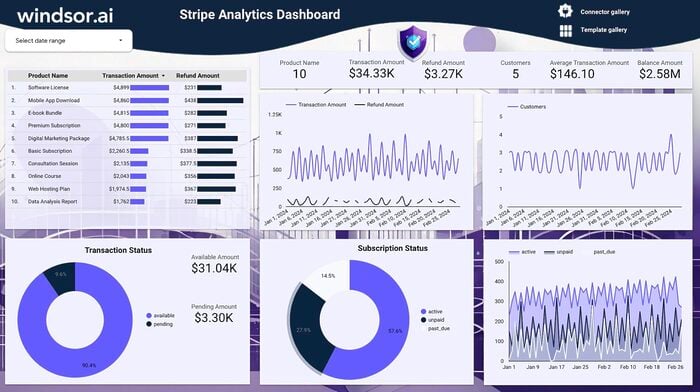
Looker Studio Stripe Overview Report
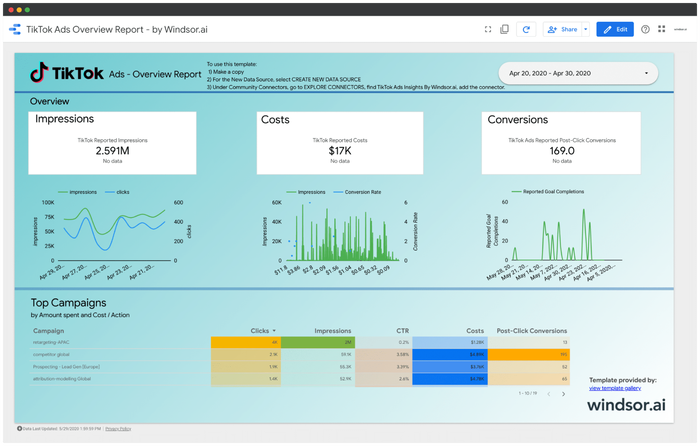
Looker Studio TikTok Ads Overview Report
How to set up Windsor.ai's Data Studio templates
Select a template from the gallery
Filter the gallery by data source or by tool, and open the template that matches the report you need.

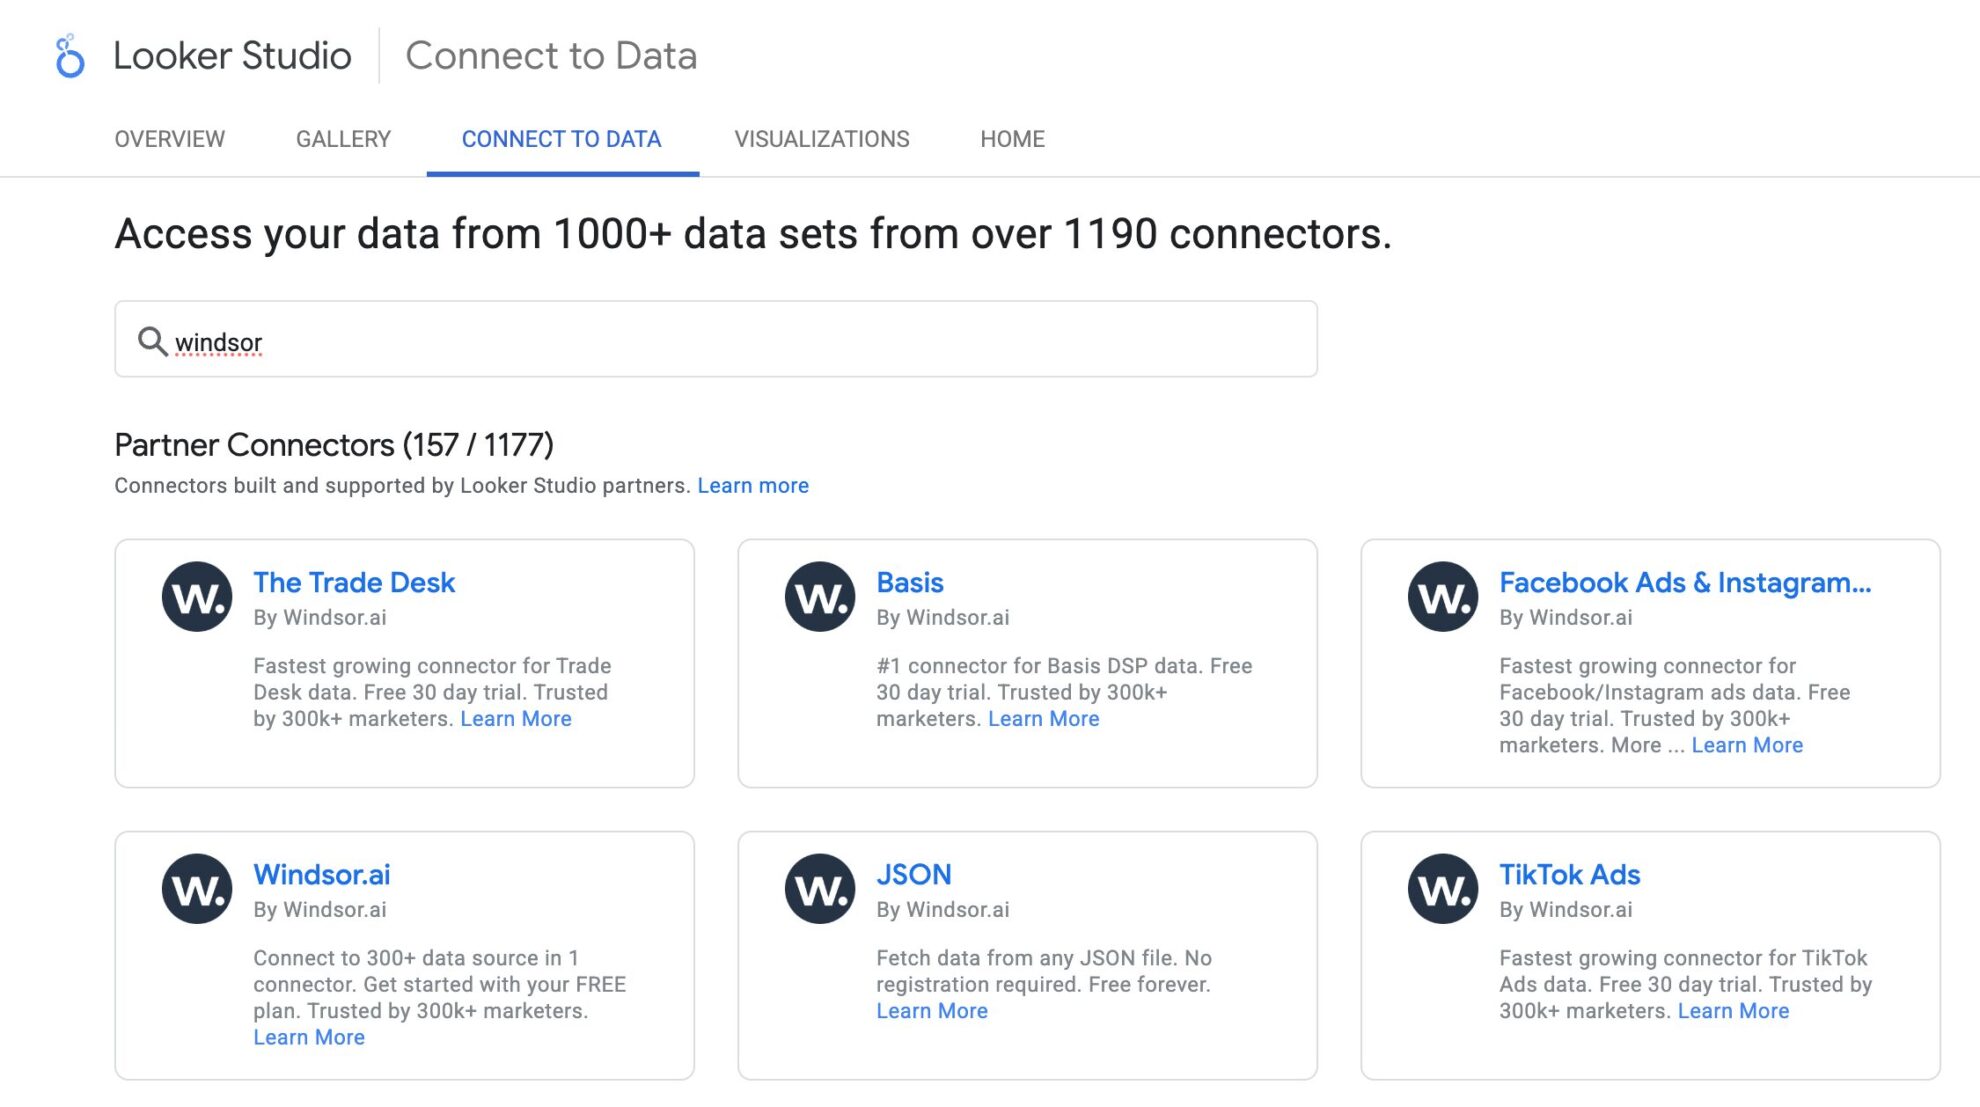
Install the Windsor.ai Data Studio connector
Add the Windsor.ai connector in Data Studio for the data source the template uses, and select your accounts.
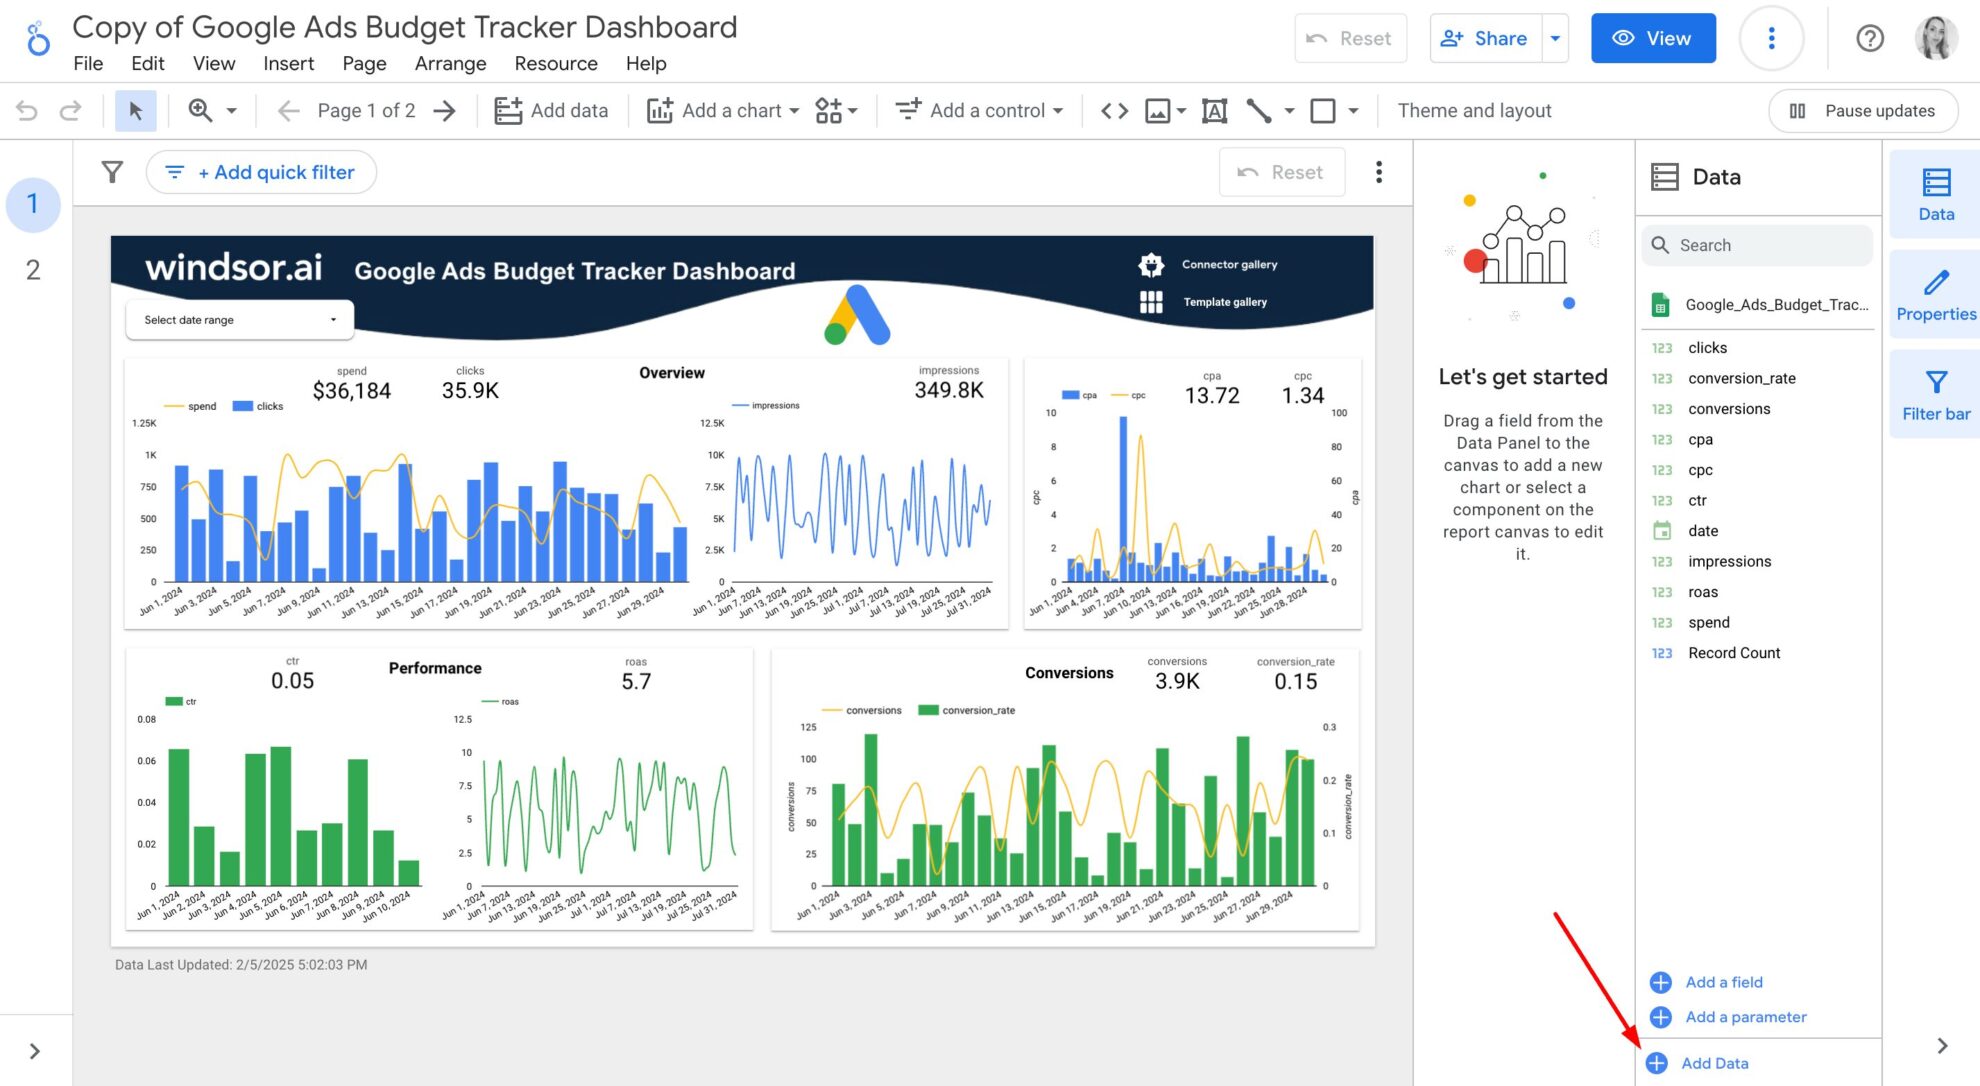
Make a copy of the template
Open the template, choose File, Make a copy, and pick the Windsor.ai data source you just added, so every chart switches to your data.

Customize and share the report
Add the fields, filters and pages you need, then share the report with your team or clients.
Data Studio templates (formerly Looker Studio): what you get
Each template is a finished Data Studio report: charts, metrics and page layout are already set up, and your own accounts fill it once you connect them through Windsor.ai. Most searches still say Looker Studio, the name Google used from October 2022 until it switched back to Data Studio in April 2026, so both names describe the same templates.
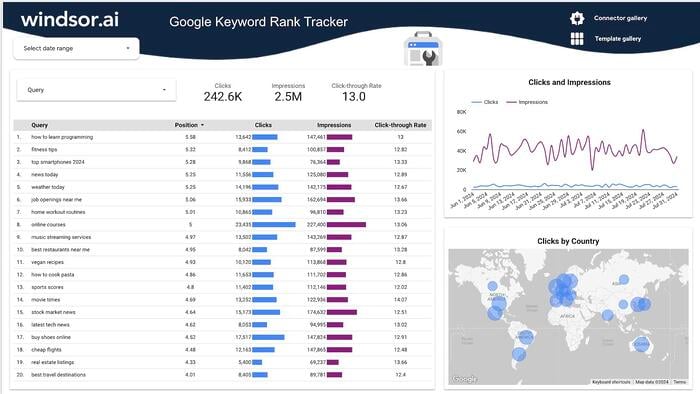
There are single-platform templates (Google Ads, GA4, Search Console, Meta Ads, TikTok Ads, Shopify and more) and cross-channel ones that put several platforms on one page. For SEO reporting, start with the Search Console and GA4 templates; for paid media across platforms, see the cross-channel templates.
What to know before you copy a template
These are the questions teams ask us most when they start with a Windsor.ai template in Data Studio.

The templates are free
Every template in the gallery is free to copy. The data behind it comes through a Windsor.ai connector: the free forever plan covers 1 data source with no credit card, and reports that combine several platforms need a paid plan, from $19/month for 3 sources.

Copy and connect in one pass
Install the Windsor.ai connector for the data source first, then open the template and choose File, Make a copy, and select the Windsor.ai data source in the copy dialog. The charts then switch to your data in one step; if you skip that, each chart has to be switched to the new data source by hand.

Blended or per-platform connector
Cross-channel templates use the blended Windsor.ai connector, where spend, clicks and impressions have the same names on every ad platform. Single-platform templates use that platform’s connector, which carries every field the platform offers.

One template, many clients
Copy the template once per client and select that client’s accounts when you connect, or keep one report and add an account filter. All clients can stay in one Windsor.ai account, with unlimited users on paid plans.

Sharing with clients
Share the copied report from Data Studio with view access, or set up a scheduled email delivery from the report’s Share menu. Clients do not need a Windsor.ai login to view it.

Customize the copy
Add charts, calculated fields and pages to your copy as you would in any Data Studio report. Metrics you want in every report, such as a blended CPA or a fee-adjusted cost, can be created once as Windsor.ai custom fields.
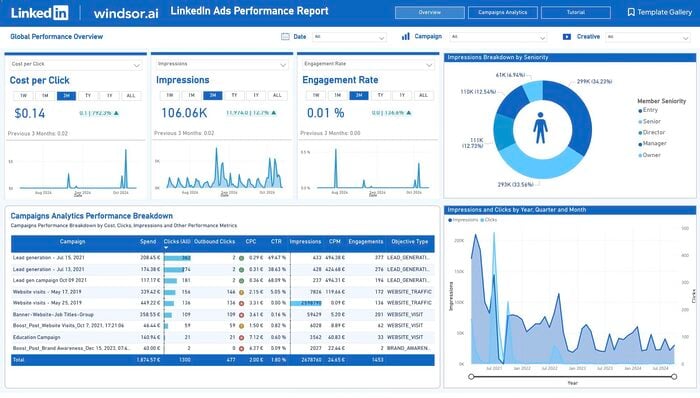
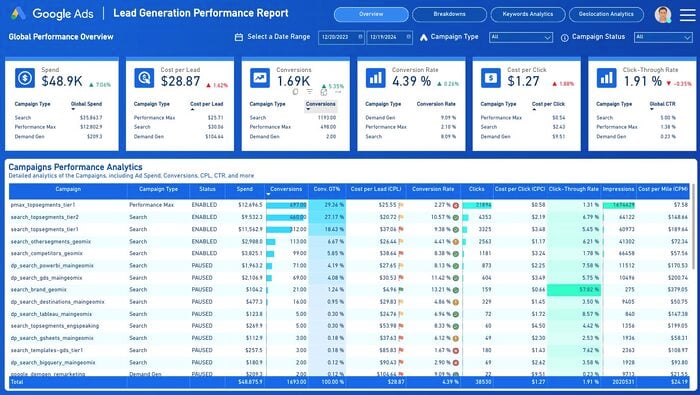
Top 10 Data Studio templates
These are the templates people copy most often from the gallery. Pick by the platform you report on and the question the report has to answer.

FAQs
What are Looker Studio templates?
Looker Studio templates, now called Data Studio templates after Google’s April 2026 rebrand, are pre-built report layouts you copy in one click and connect to your own data. Charts, metrics, and design are already configured; your live data populates automatically.
Can I create Data Studio dashboards from a template programmatically?
Yes, with Google’s Linking API. A link that contains the template’s report ID and the parameters of your data source creates a new copy of the report connected to that data source, so you can generate one report per client from a single template without copying each by hand. Google’s Linking API documentation lists the parameters for each connector type.
Can I move my Supermetrics reports to Windsor.ai without rebuilding them?
Yes, in most cases. Make a copy of the report, and in the copy dialog replace each Supermetrics data source with the matching Windsor.ai connector, so the charts switch over together. Field names can differ between connectors, so check charts that use calculated fields after the switch. See Windsor.ai vs Supermetrics for the full comparison.
Should I use the blended connector or one connector per platform?
Use the blended connector for overview pages that add platforms together, and the platform’s own connector for pages about one platform. Most multi-page reports use both.
Why do the numbers in my report not match the ad platform?
Usually because the report and the platform are set differently. Check that the date range, the time zone and the reporting level (campaign, ad set or ad) match, and that ratio metrics like CTR are calculated from totals, not averaged across rows.
When did Google Data Studio become Looker Studio?
Google renamed Data Studio to Looker Studio in October 2022, and switched the name back to Data Studio in April 2026. The product, the reports and the connectors stayed the same through both changes.
How can I access Data Studio?
Open Data Studio and sign in with a Google account; it is free. To report on non-Google platforms, add a connector such as Windsor.ai’s from the connector gallery.
How to share a Looker Studio dashboard?
Go to the dashboard you want to share and click the ‘Share’ button. You can choose specific groups, roles, or users who can access the dashboard.
Why does Data Studio work slowly?
Reports slow down when a page has many charts, each asking for its own data, or when date ranges are long and broken down by day. Fewer charts per page, shorter default date ranges and filters on the data source speed them up.
Which data sources can I connect to Data Studio with Windsor.ai?
All 350+ Windsor.ai sources, including Instagram, LinkedIn Ads, Facebook Pages, Google Ads, GA4, HubSpot, TikTok Ads, Amazon Ads, Stripe and Criteo.
Tired of manual data exports into Data Studio? Try Windsor.ai today to automate your reporting


