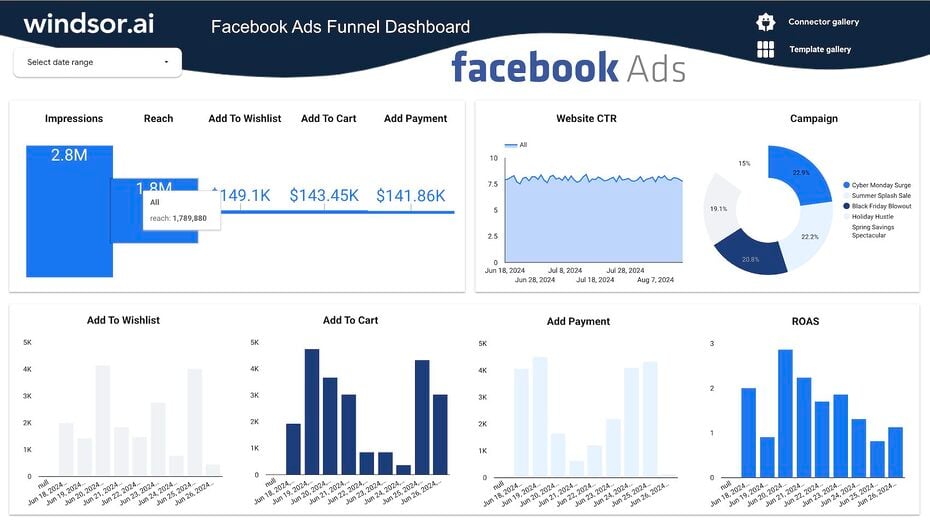
The Facebook Ads Funnel Dashboard Template lets you automate your marketing reports in Looker Studio. Since the dashboard template is free, you don’t incur any costs for your reporting and analytics automation. The dashboard report template is easy to use, so you do not need technical skills. To use the Facebook Ads Funnel Dashboard, go to the Windsor.ai website, select the dashboard, and start using the reporting template.
What is the Facebook Ads Funnel Reporting Dashboard?
Facebook Ads Funnel Dashboard is a reporting tool that automates Facebook advertising data analytics. It is designed to create marketing reports in Looker Studio. To use the tool, you need to connect to your Facebook account.
Why is Facebook Ads Funnel Dashboard Reporting Important?
The reporting dashboard helps you analyze all your Facebook advertising data. Here is why Facebook Ads Funnel Dashboard is essential:
Automate Your Marketing Reports
You can automate your marketing reports when you connect to Facebook Ads Funnel Dashboard. You do so by automating the data connection to your Facebook account. The dataflow features in Looker Studio enable you to automate data synchronization, analytics, and reporting.
Optimize Your Spending on Facebook Ads
The dashboard reporting template provides detailed information about your spending on different Facebook ads and insights into the return on advertising spending (ROAS) across different months. You can use the data to optimize your budget and increase returns.
Monitor the Performance of Your Facebook Ad Campaigns
You can monitor how different campaigns impact your performance indicators. For instance, the marketing reporting dashboard shows your campaigns’ impressions and reach. The report template also displays items added to wish lists, carts, and conversions. Thus, you can tell whether the Facebook campaigns deliver the desired results.
Benefits of Using Facebook Ads Funnel Reporting Dashboard
The Facebook Ads Funnel Dashboard conveys various benefits to the users. Some of the benefits are as follows:
Grow Your Sales
The most critical benefit of the Facebook Ads Funnel reporting dashboard is the growth of sales volumes and revenues. Using the marketing reporting template, you get insights on how to increase your revenues. Such insights include the best-performing campaigns and market segments where your Facebook Ads attract attention.
Saving Costs
Using the dashboard template saves costs in two critical ways. The first is cutting the cost required to prepare marketing reports. Since the reports are automated, producing the report only takes the click of a button. The sound cost-saving outcome is from the optimization of advertisement spending.
Maximize the Return on Advertisement Spending
Lastly, the marketing report dashboard helps maximize the ROAS—the maximization of ROAS results from higher revenues, lower reporting costs, and optimized advertising spending. Advertising dollars are also directed to the most valuable market segments.
How to use it
- Configure the Looker Studio Connector: Windsor.ai
- Once you finish installing the connector open the Facebook Ads Funnel Dashboard and make a copy of it (File -> Make a copy)
- Select the newly created data source.
- Now your dashboard is set up
FAQs
What is Facebook Ads?
Facebook Ads is a solution for marketers, enabling them to create advertisements on the social media network.
What is Facebook Ads Used For?
Facebook ads increase a brand’s marketing reach by promoting it to geographically and demographically segmented markets.
How Much is Facebook Ads Funnel Dashboard?
The Facebook Ads Funnel Dashboard is free on Windsor.ai.
What is Looker Studio?
Google’s Looker Studio is a data analytics service that enables marketers and data analysts to combine data from multiple sources and create unified analytics. Formerly known as Google Data Studio, Looker Studio also automates reporting through inbuilt dashboards and visualization tools.
