 AI insights
 About us
 Careers
 Security
 Customer reviews
 Contact us
 Affiliate program
 Solution partners
 Looker Studio templates
 Tableau templates
 Facebook Ads templates
 Google Ads templates
 Data fields & Metrics
 AI prompt library & Guides
 Product documentation
 API documentation
 Case studies
 Blog
Blog Data models
 Windsor vs Supermetrics
 Windsor vs Fivetran
 Windsor vs Portermetrics
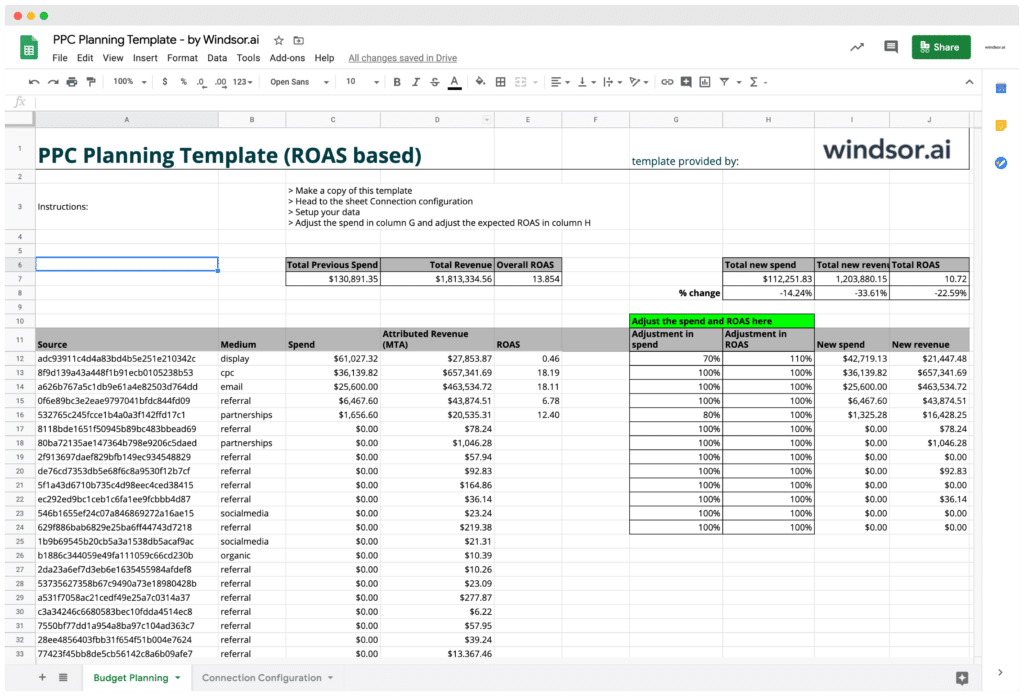
Free Excel Dashboard Marketing Templates
Use our professionally designed Excel marketing templates to automatically visualize data from multiple platforms in a spreadsheet instead of building reports from scratch. Our Excel dashboards are ready to go—fully customizable, white-label friendly, and perfect for client or internal reporting.
Windsor.ai connects data from over 325 sources directly into Excel, eliminating manual exports and allowing you to track performance across channels like Google Ads, Facebook, and more, without writing a single line of code.
Simplify your workflow, save time, and make better decisions with real-time Excel marketing dashboards.
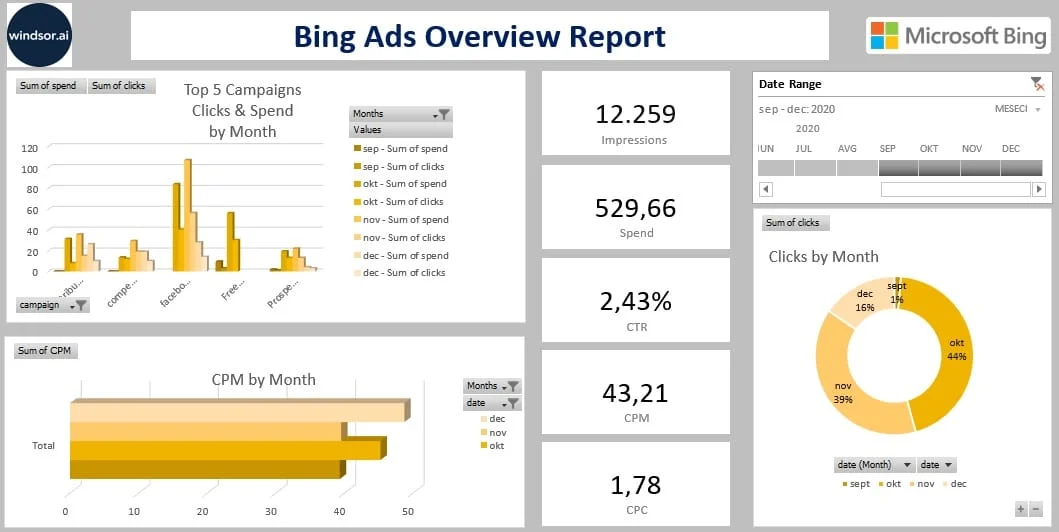
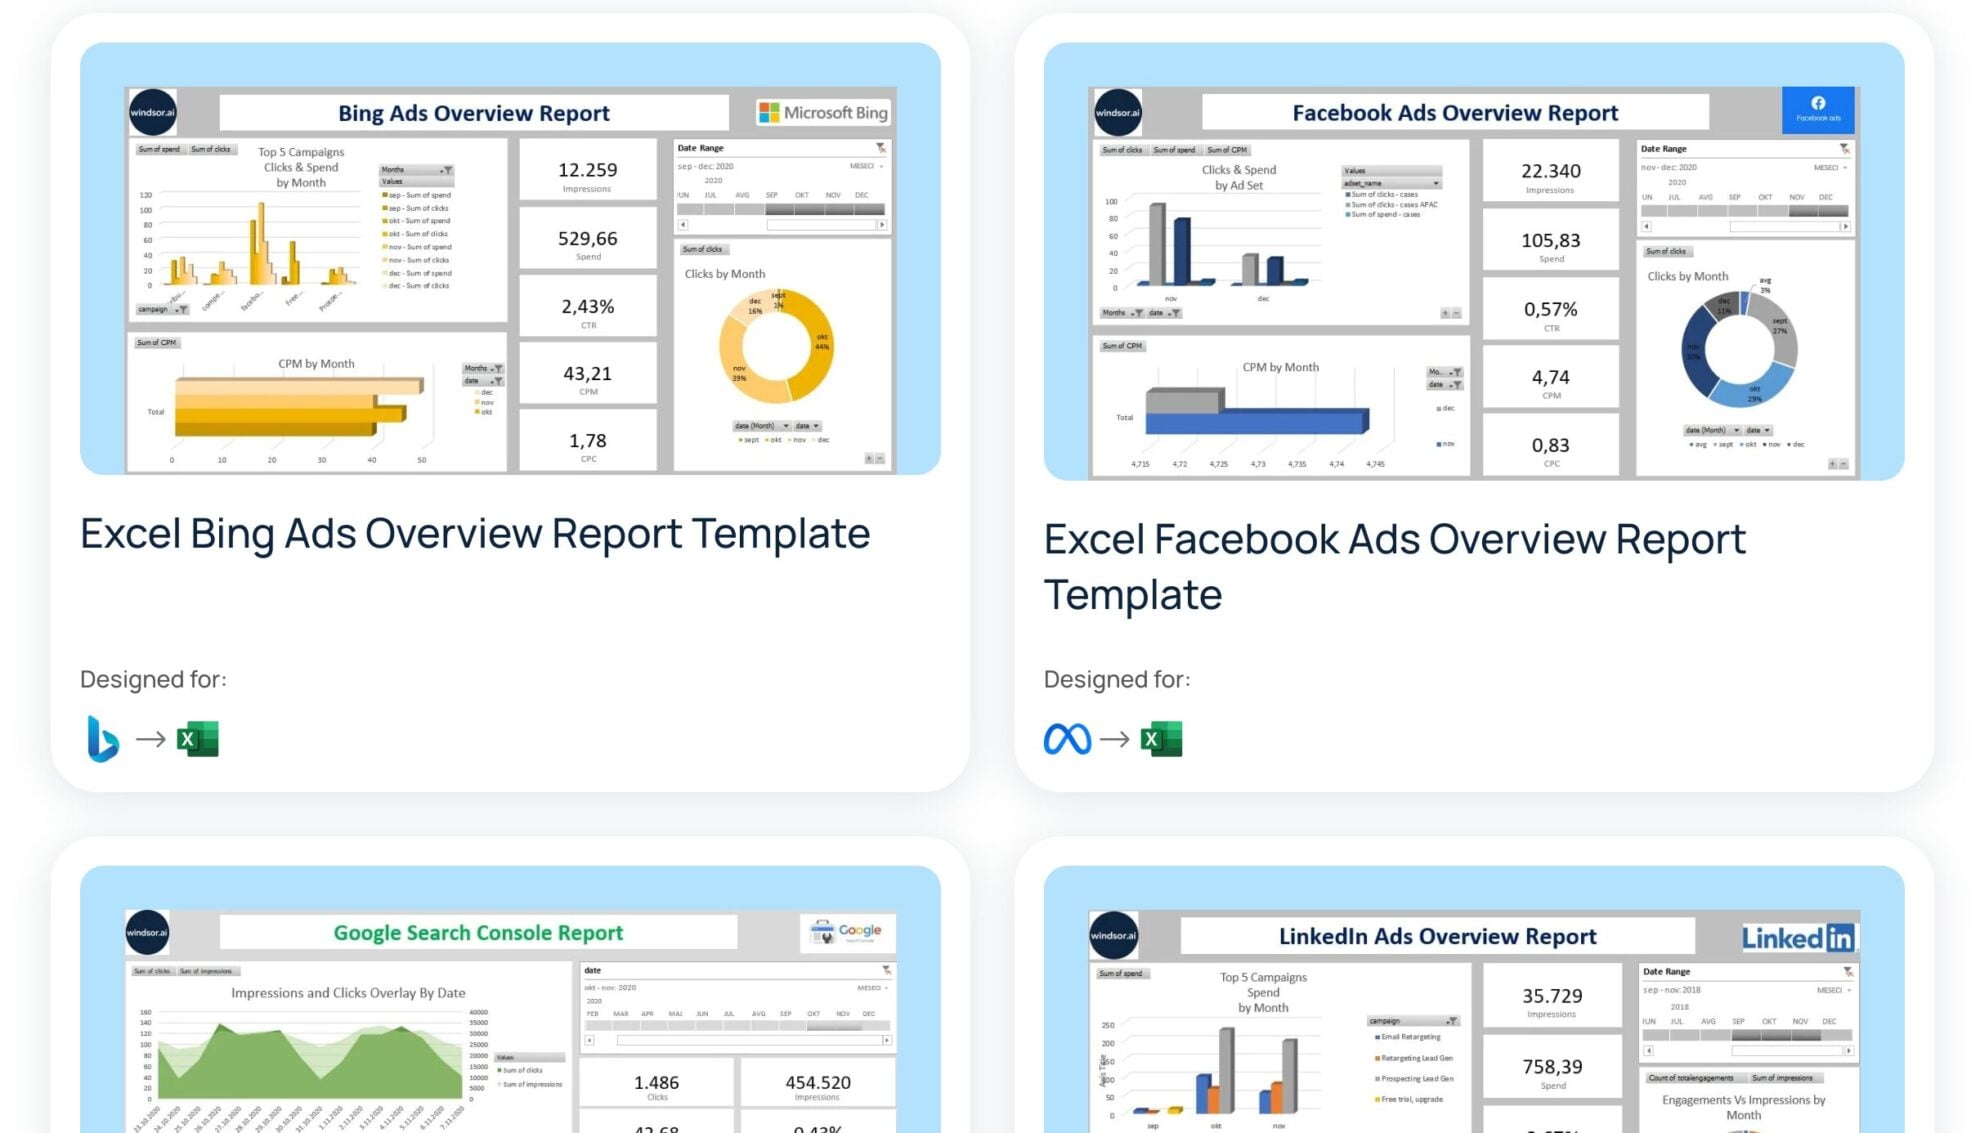
Excel Bing Ads Overview Report Template

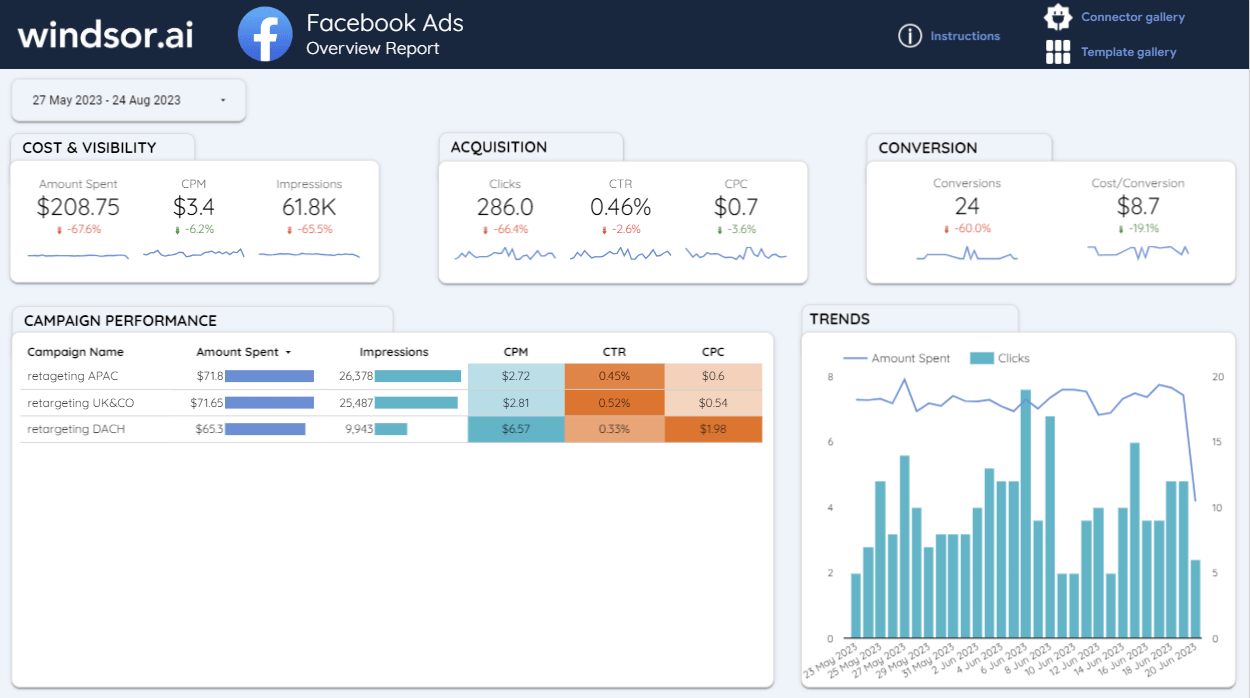
Excel Facebook Ads Overview Report Template

Excel LinkedIn Ads Overview Report Template


How to set up Windsor.ai's Excel templates
Select the template from the Windsor.ai gallery
On this page, select the template that best suits your data needs.
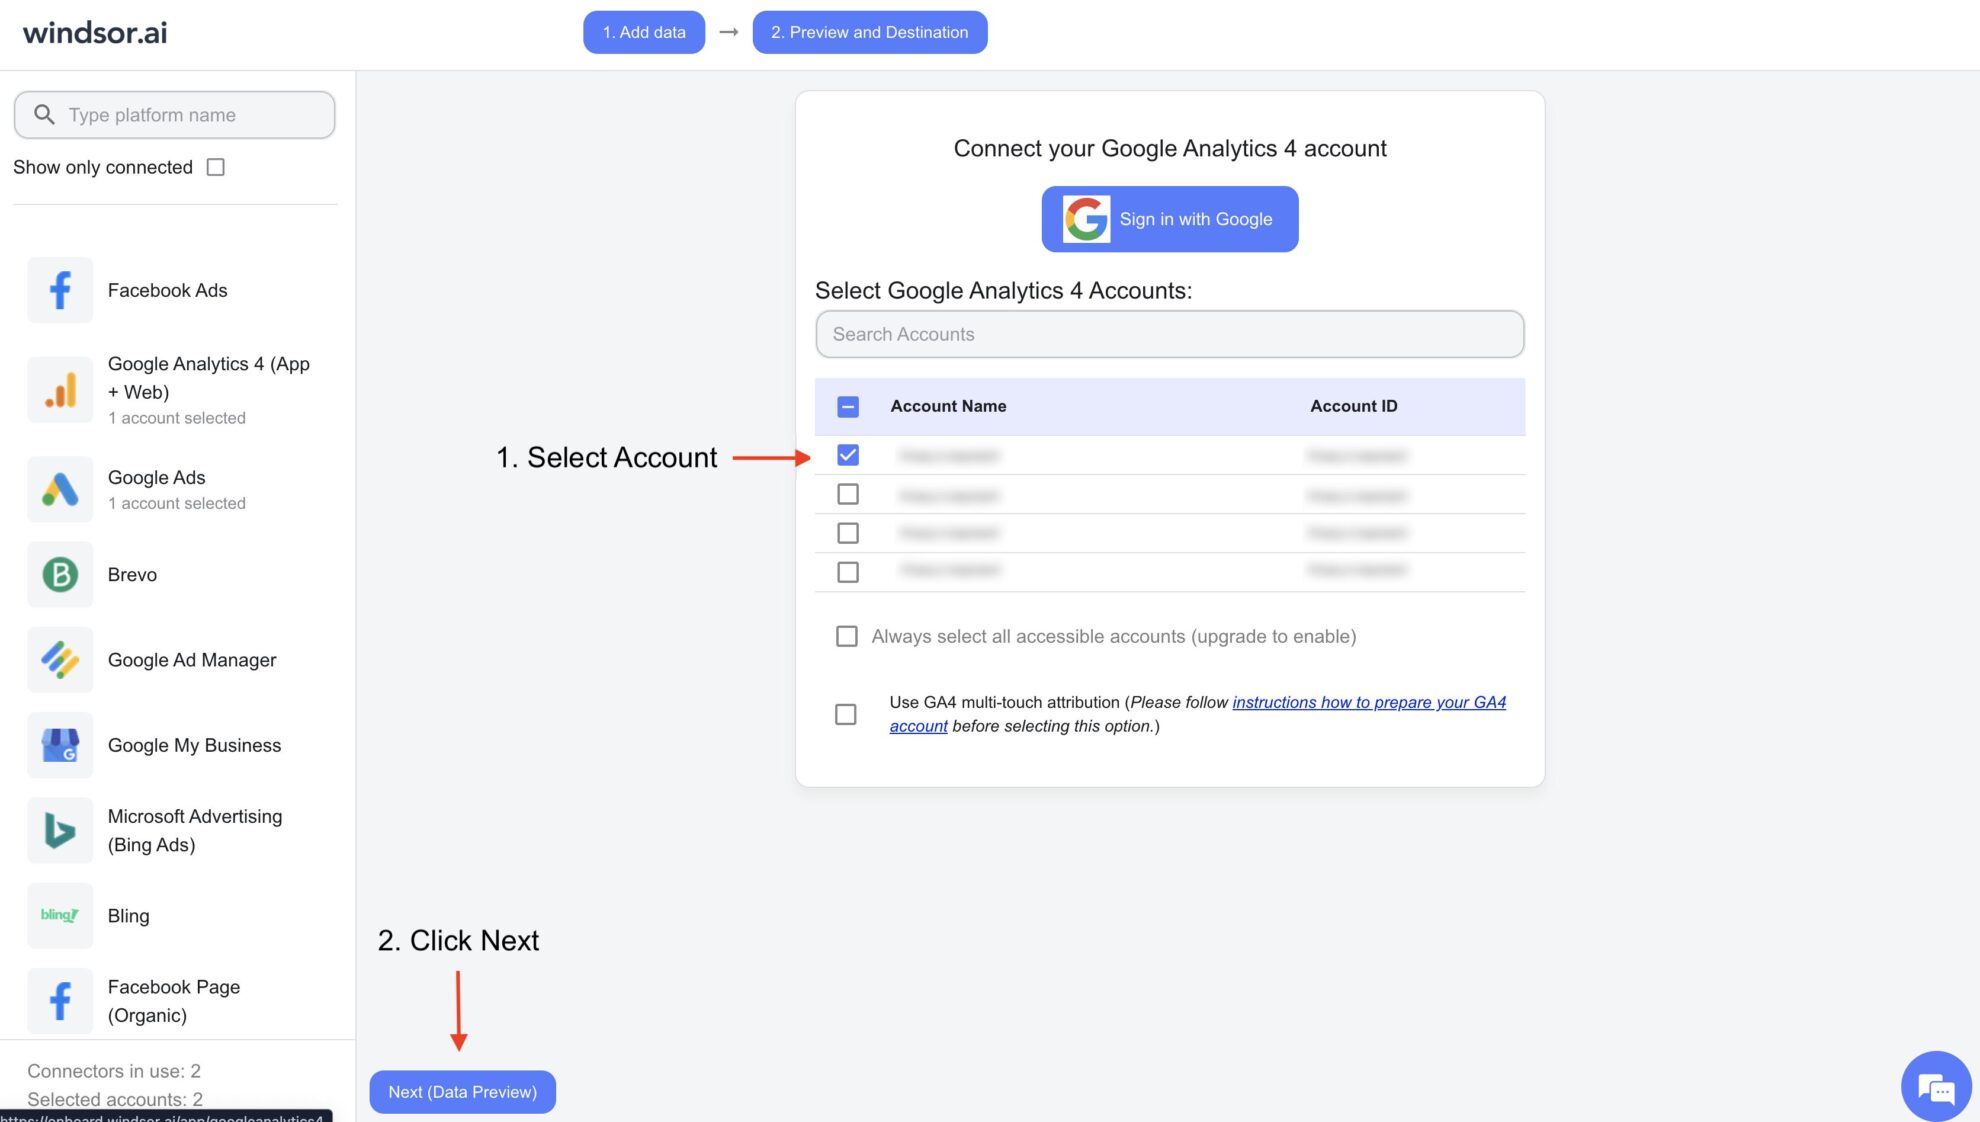
Connect a data source
In your Windsor.ai dashboard, connect the required data source and select the necessary accounts you want to pull data from.
Connect the Excel destination
Click on “Preview and Destination,” choose Excel, and copy your API key from the instructions below.

Integrate data into the spreadsheet
Go to the spreadsheet in your Excel, click the “Data” tab, and then select the “Web” option. Paste your previously copied API key URL in the pop-up and click “Ok.”

Excel templates:
A powerful tool for marketers and data analysts
Our free Excel dashboards are designed to help you build marketing reports using minimal effort. They’re the vital tools that can help visualize your marketing, sales, finance, and SEO data in an actionable and dynamic way. By providing insights into various metrics, Windsor.ai’s templates enable businesses to make more informed decisions that contribute to growth while saving time and effort.
Take your reporting to the next level with Excel templates from Windsor.ai
Marketing agencies deal with multiple clients and must prepare marketing reports for each. Using Windsor.ai’s Excel reporting templates can significantly improve the report-building process, both for companies and individual marketers, bringing the following benefits to the table:

Automated marketing reporting
Automated marketing reporting
Using Microsoft Excel reporting templates can significantly accelerate the creation of reports by marketing agencies. After selecting the appropriate templates, you can produce custom reports by connecting the template to the data using Windsor.ai connectors, and just match the necessary data source with the client’s account name.

Customizable dashboards
Customizable dashboards
Our Excel reporting templates are customizable. The marketing agencies can adjust the Excel reports using simple steps to meet clients’ needs. This customization ensures that each report is unique while maintaining consistency in the underlying reports.

Fast and efficient reporting
Fast and efficient reporting
Our free Excel templates help with fast and efficient reporting. With pre-built templates, marketing reporting takes only a fraction of the time it would take to build a report from scratch. Cutting the time spent on generating reports is essential because you can focus on interpreting data insights, advising clients, and winning more business and new clients.
Top 10 marketing dashboard templates from Windsor.ai
Discover the best dashboard templates for Excel and other platforms designed for the major marketing channels, including Google Analytics, Google Ads, Meta/Facebook Ads, LinkedIn Ads, Bing Ads, X/Twitter Ads, TikTok Ads, Snapchat Ads, Adroll, Criteo, and more.


FAQs
What is Excel used for?
Excel is the main program used to capture and record data in many organizations. The Excel spreadsheet format allows data to be recorded in rows and columns. Cells in the spreadsheet are easily identified based on letters for columns and numbers for the rows. Users can also manipulate data using various formulas. Lastly, using charting features and Pivot tables, users can create comprehensive visual reports from data.
What are Excel templates?
Forget building spreadsheets from scratch—Windsor.ai offers professionally designed Excel templates to simplify your marketing reporting. These plug-and-play tools help you save time, reduce errors, and focus on what really matters—data insights.
Are Windsor.ai's Excel templates free to use?
Yes, you can use any template from our gallery free of charge. The only fees might apply to data syncing using the Windsor.ai connector for automated data integration from a data source into Excel. Here are our pricing plans.
How to connect a template to Excel?
1. Visit Windsor.ai’s Excel templates page and select the template you want to work with.
2. Make sure you’ve previously connected a necessary data source with Windsor.ai.
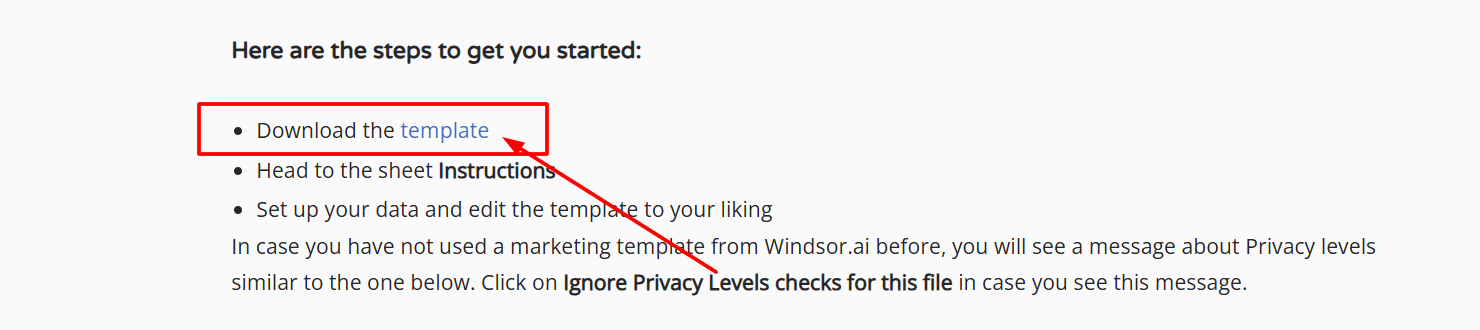
3. Open the template page, scroll down, and “Download the template” by the provided link.
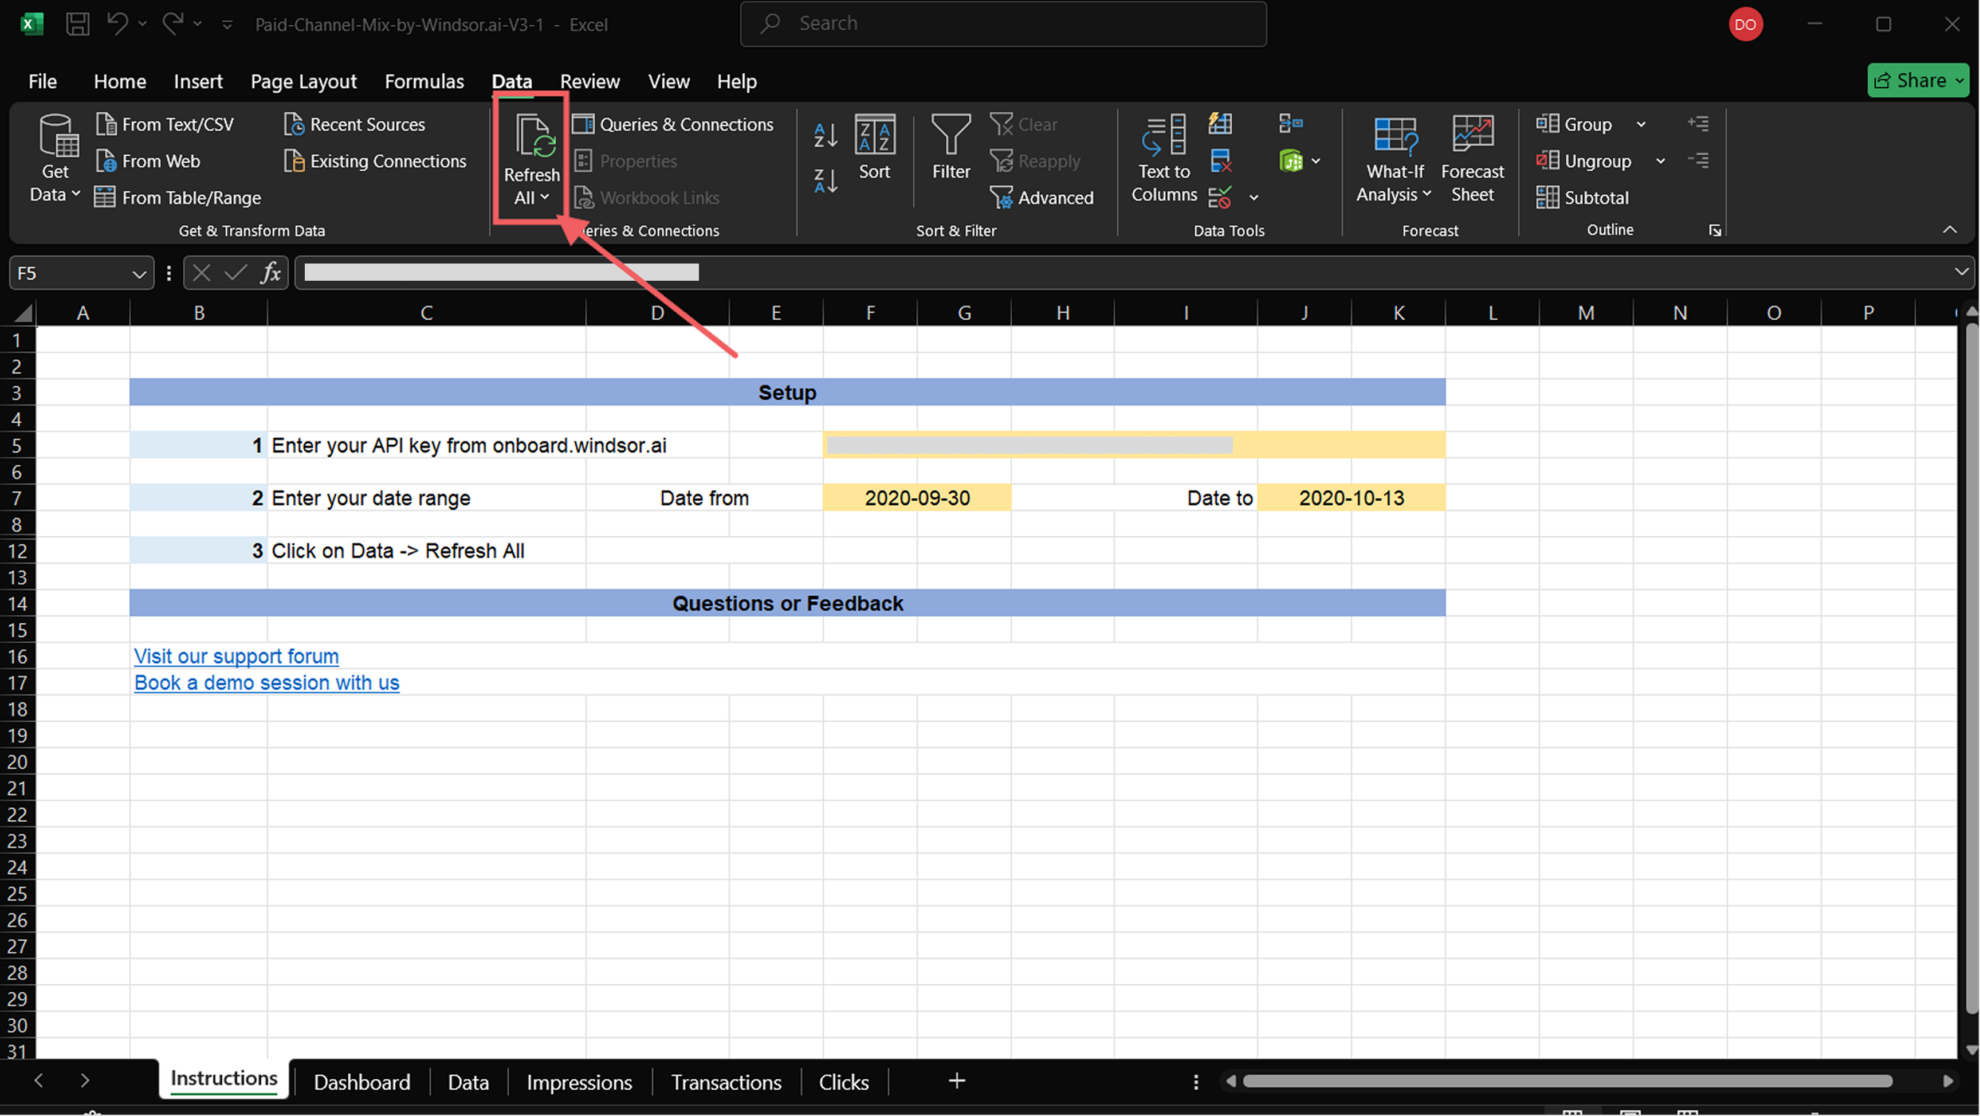
4. In Excel, add your API key by clicking on the yellow part corresponding to the API and pasting the previously copied API key URL.
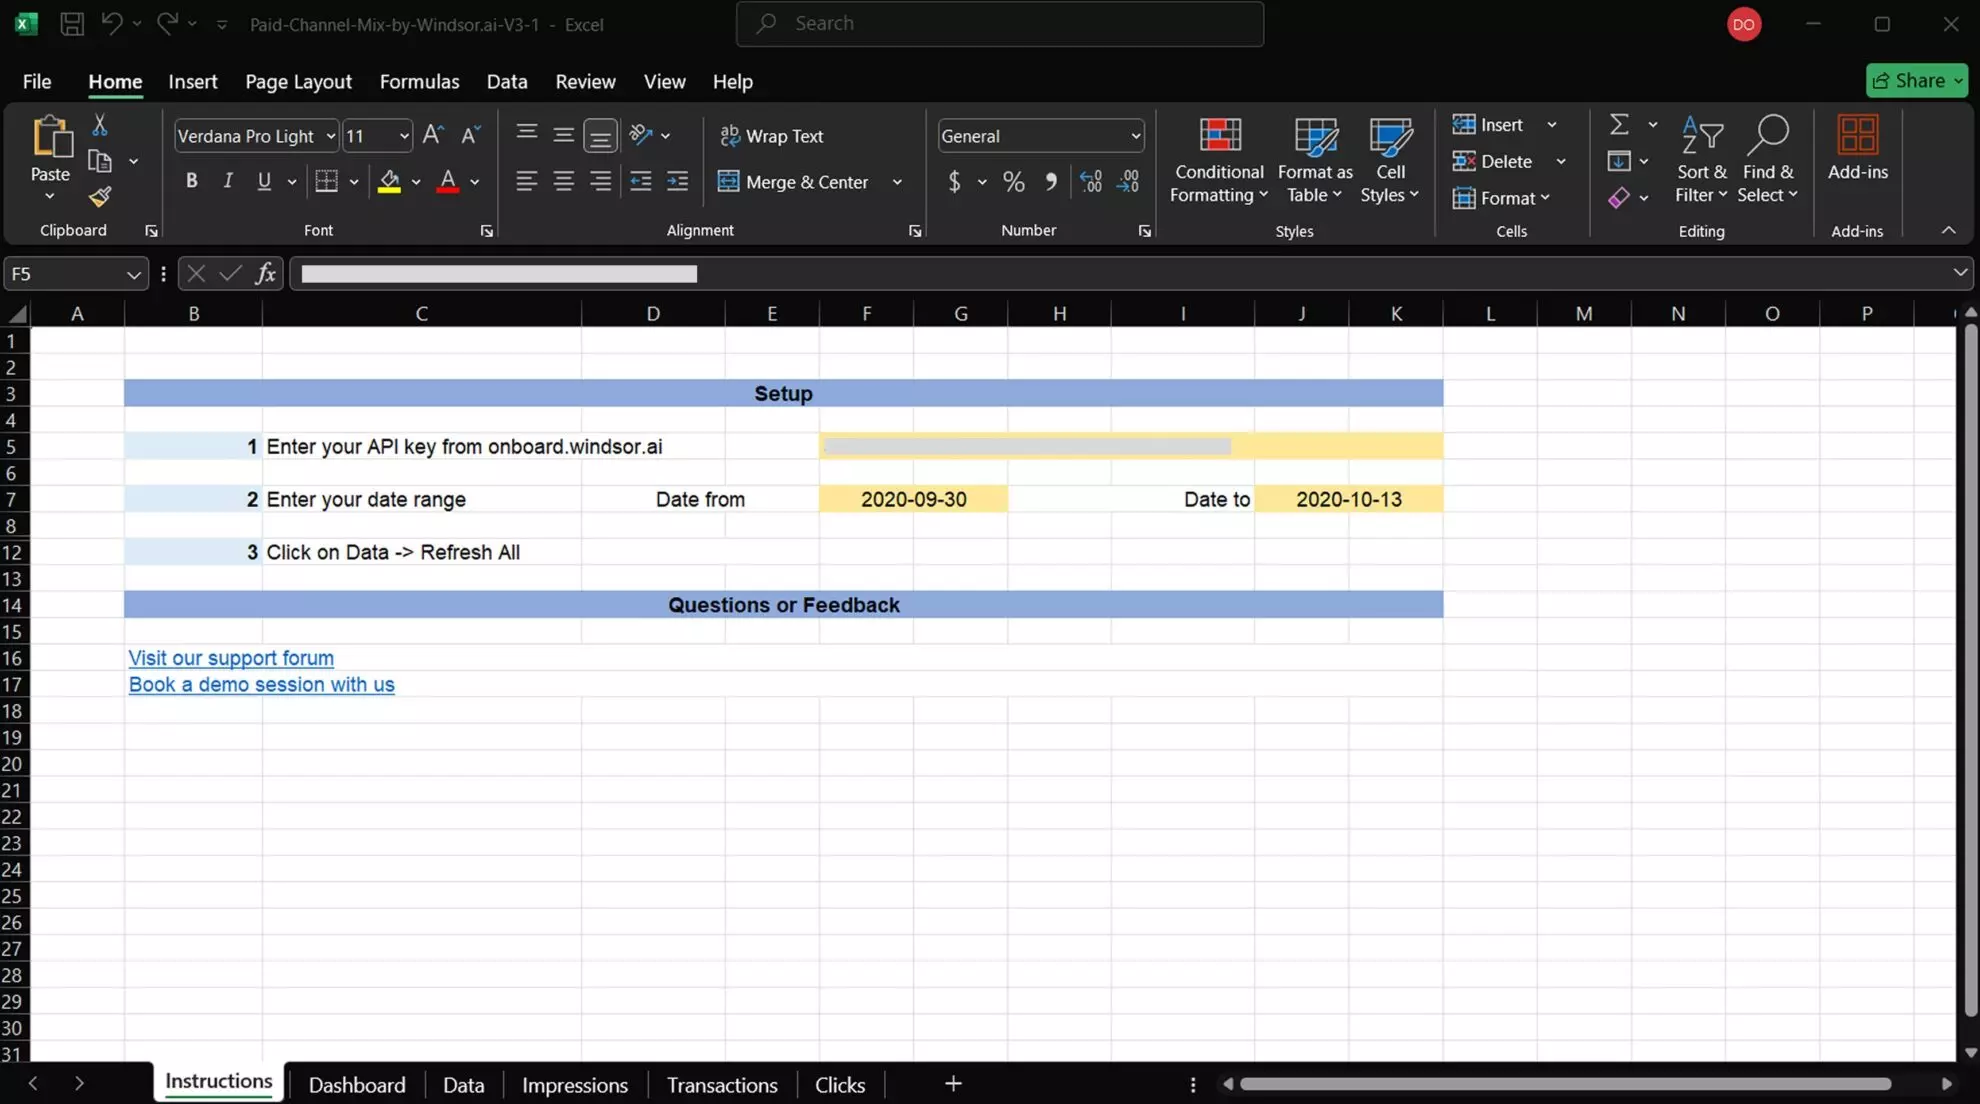
5. Enter your desired date range.
6. Click on “Data” and then “Refresh All.”
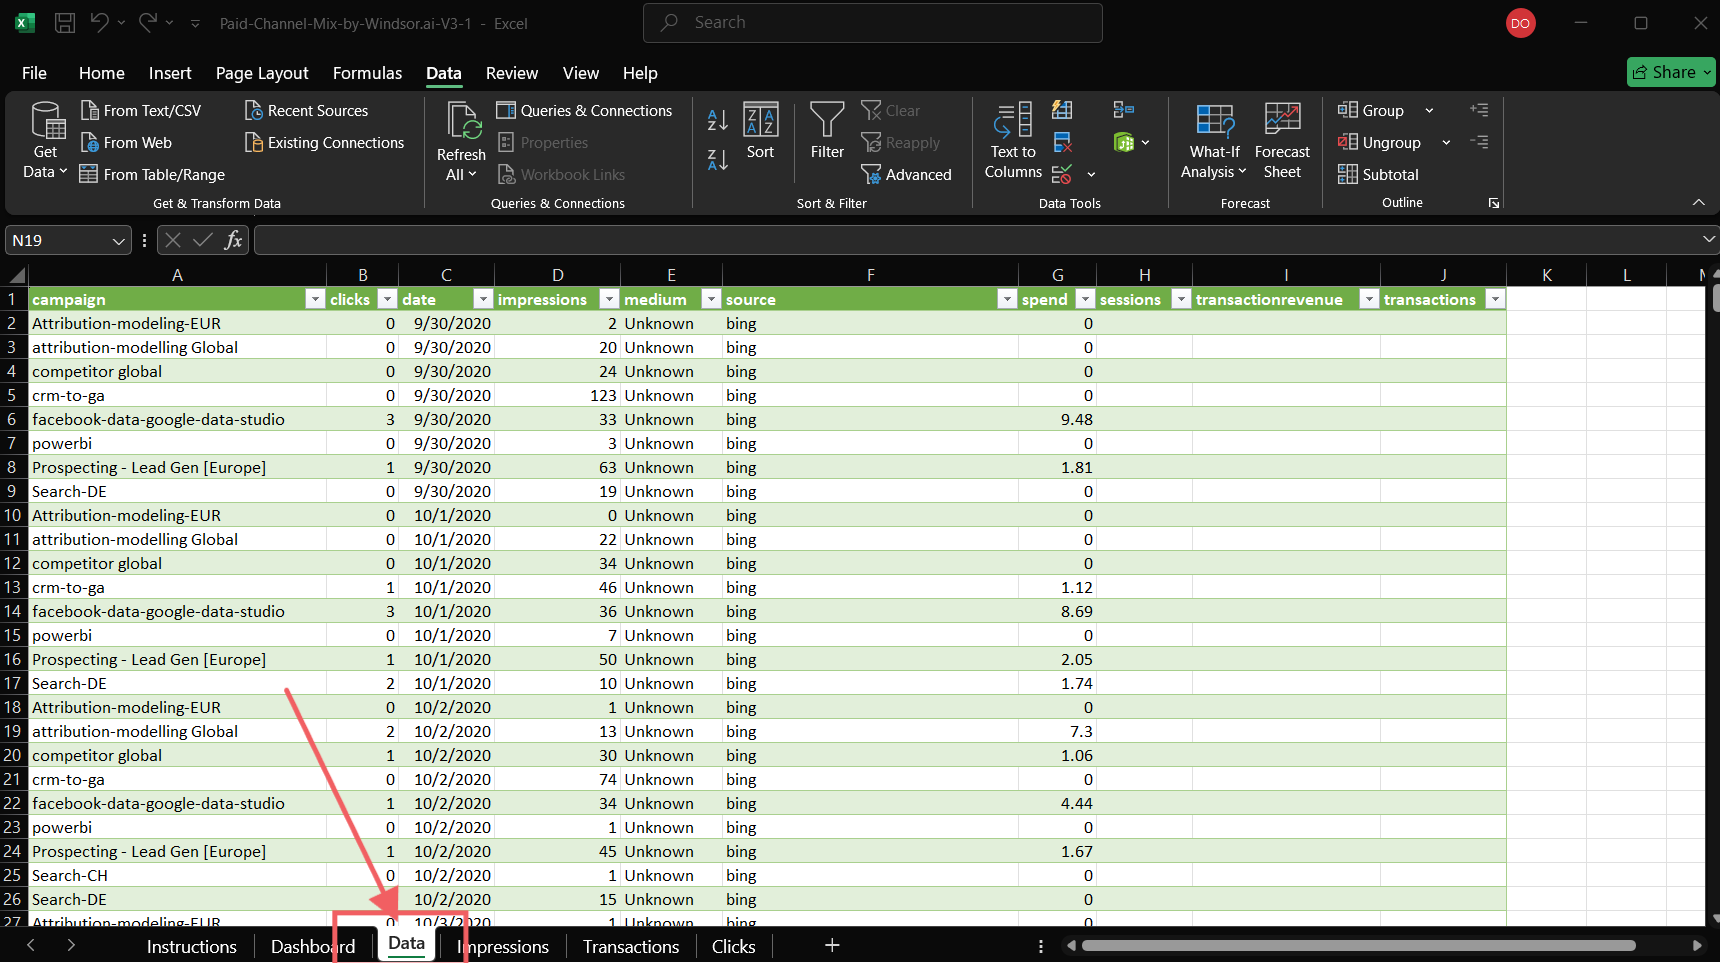
7. To view the refreshed data, click “Data” at the bottom of the sheet.
Tired of manual data exports into Excel? Try Windsor.ai today to automate your reporting

