This Facebook Ads (Meta) Overview Report template helps you to visualise your Facebook Ads into Excel in a few clicks. Dimensions and metrics visualised in this report are:
- Source
- Campaign
- Adset Name
- Clicks
- Impressions
- Spend
- Cost per conversion
as well as added calculated fields like CPC, CMP, and CTR.
There is a list of close to 300 metrics and dimensions available once you start customising the report. To find the full list head to Available metrics and dimensions. Even more details about the Facebook Ads metric you can find here.
It queries the data through our connector and makes it available in real time. Follow the steps outlined below to get your data connected.
Here are the steps to get you started:
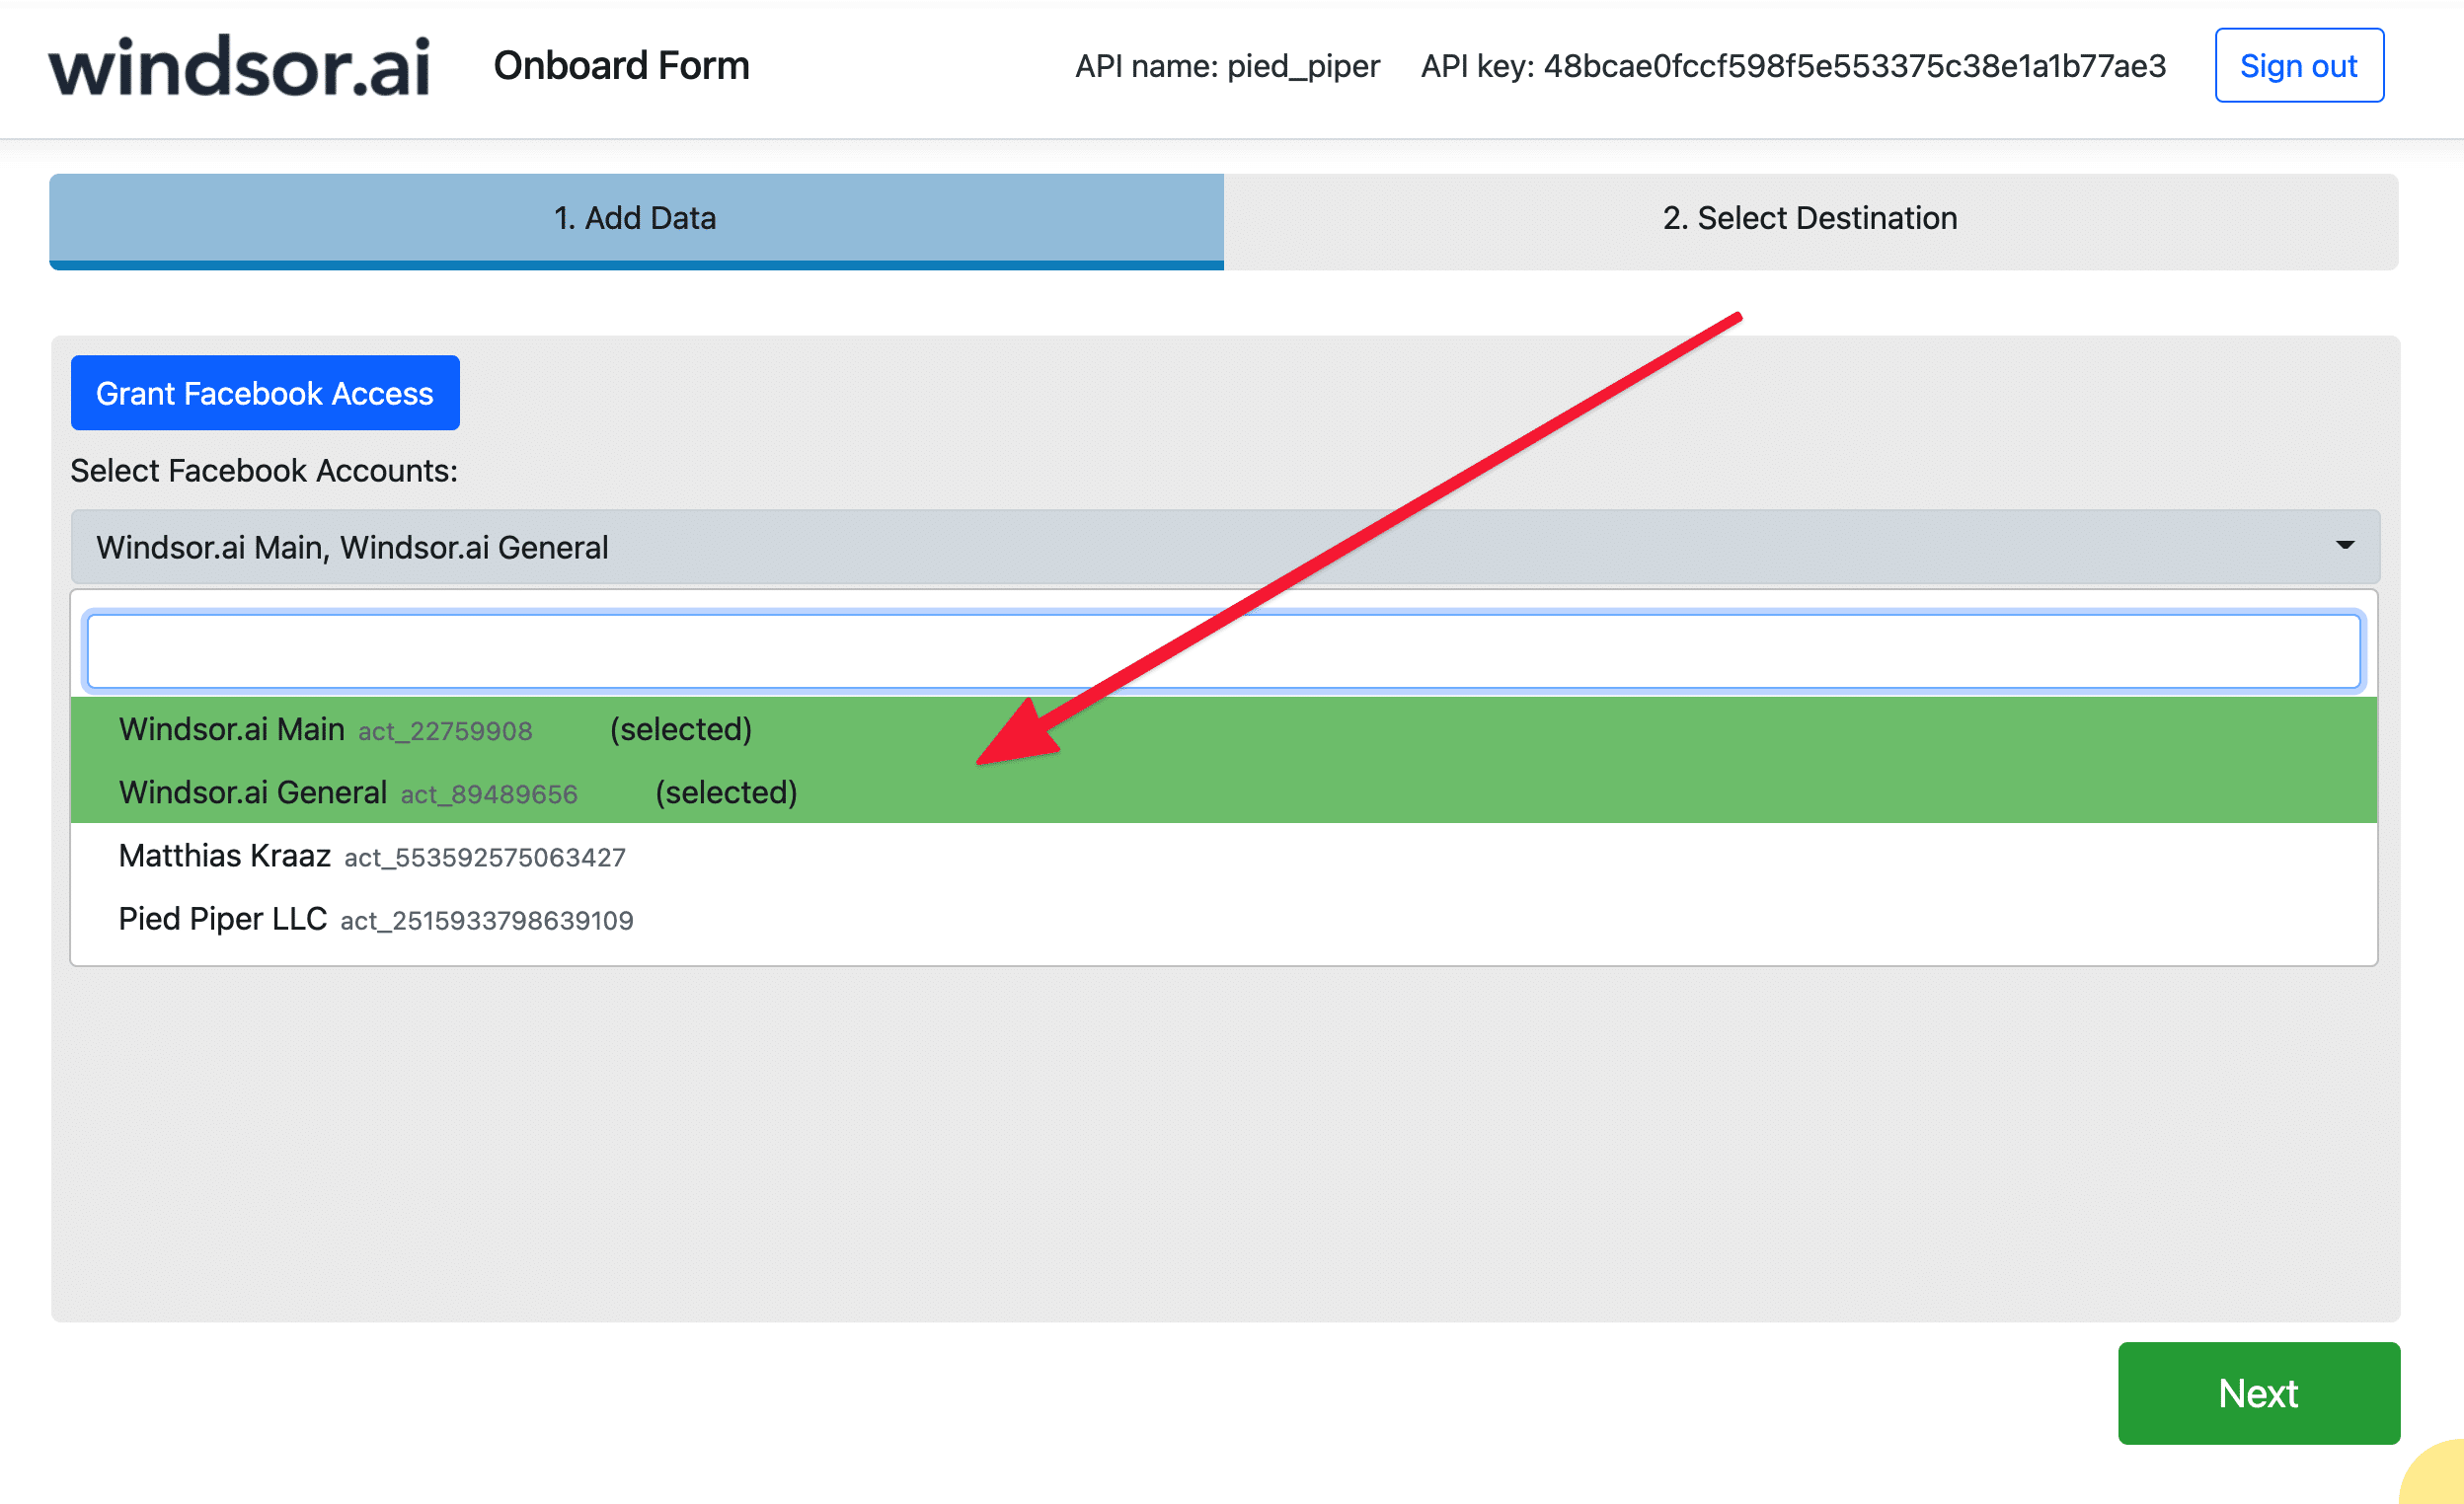
- Connect your Facebook Ads Data to Windsor.ai here.
- Select at least one Facebook Ads account from the dropdown

- Download the template
- Head to the sheet Instructions
- Set up your data and edit the template to your liking
In case you have not used a template from Windsor.ai before, you will see a message about Privacy levels similar to the one below. Click on Ignore Privacy Levels checks for this file in case you see this message.


Try Windsor.ai today
Access all your data from your favorite sources in one place.
Get started for free with a 30 - day trial.
Read also:
Connect Facebook Ads to PostgreSQL
Connect Facebook Ads to Azure SQL
Facebook Ads to Google Sheets Integration
Connecting Facebook Ads to Tableau
The Best Facebook Ads Report Templates to Try
Free Excel Marketing Dashboard Templates
Connect Facebook Ads to Snowflake
How to connect Facebook Ads to Power BI?
