 Destinations
 Data sources
 AI insights
 About us
 Careers
 Security
 Customer reviews
 Contact us
 Affiliate program
 Solution partners
 Template gallery
 Looker Studio templates
 Power BI templates
 Excel templates
 Google Sheets templates
 Tableau templates
 Facebook Ads templates
 Google Ads templates
 Data fields & Metrics
 AI prompt library & Guides
 Product documentation
 API documentation
 Case studies
 Blog
 Data models
 Windsor vs Supermetrics
 Windsor vs Funnel.io
 Windsor vs Fivetran
 Windsor vs Rivery
 Windsor vs Portermetrics
 Windsor vs Coupler.io
28 Free Google Ads Report Templates and Dashboards (Data Studio, Power BI, Tableau, Google Sheets, Excel)
Choose a free Google Ads report template for Data Studio (formerly Looker Studio), Power BI, Tableau, Google Sheets, or Excel.
Track spend, impressions, clicks, CTR, CPC, and conversions by campaign. You’ll also find templates for budget pacing, search terms, and reports that combine Google Ads with Meta Ads, GA4, and Search Console.
Each template includes setup instructions to connect your Google Ads accounts through Windsor.ai.
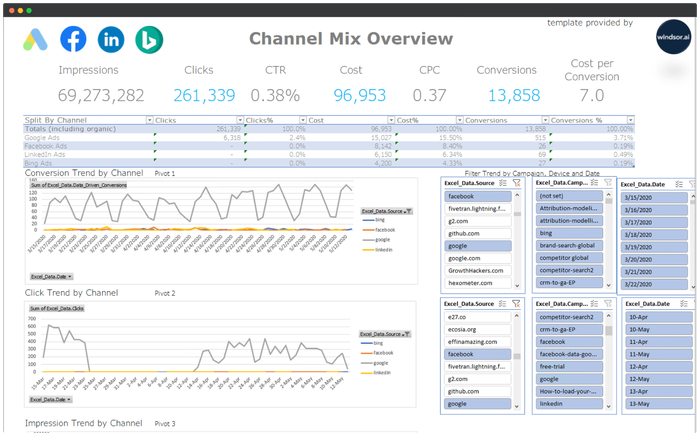
















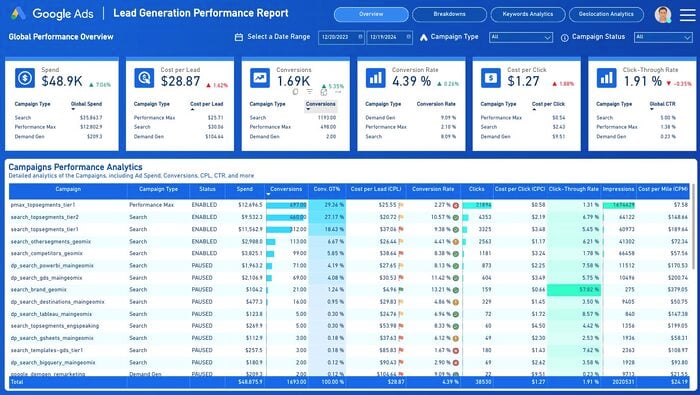
Free Google Ads Power BI Dashboard Template


Google Sheets Google Ads Report Dashboard Template
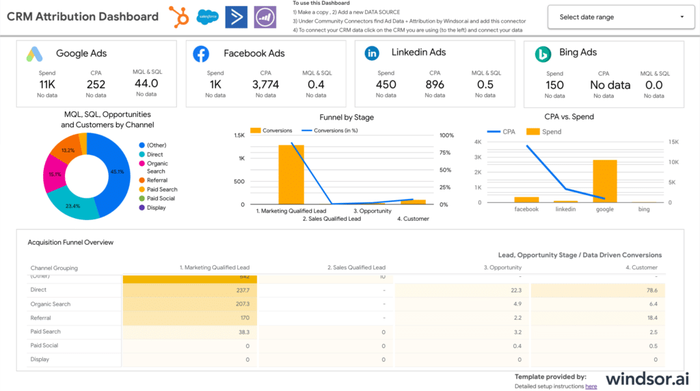
Looker Studio CRM Attribution Dashboard Template

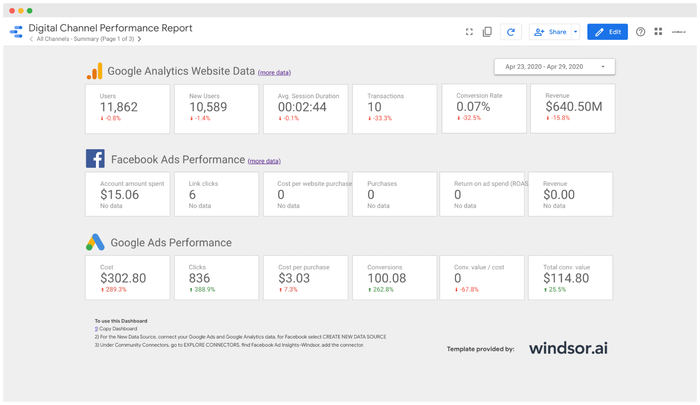
Looker Studio Facebook Ads E-commerce Dashboard Template
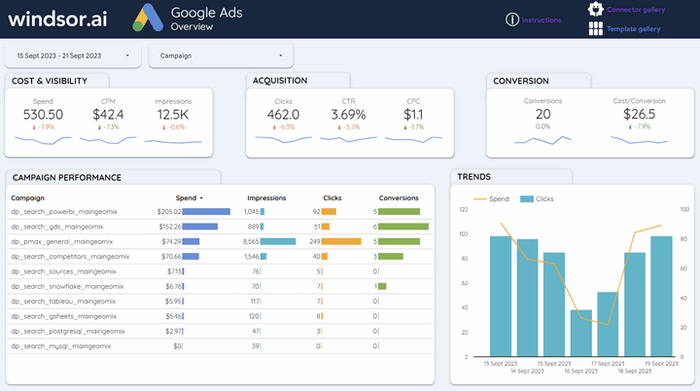
Looker Studio Google Ads Dashboard Template
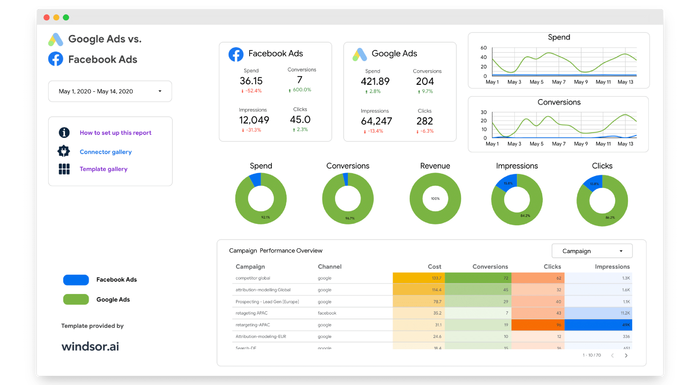
Looker Studio Painel Para Negócios Locais
Power BI Facebook Ads vs Google Ads Report Template
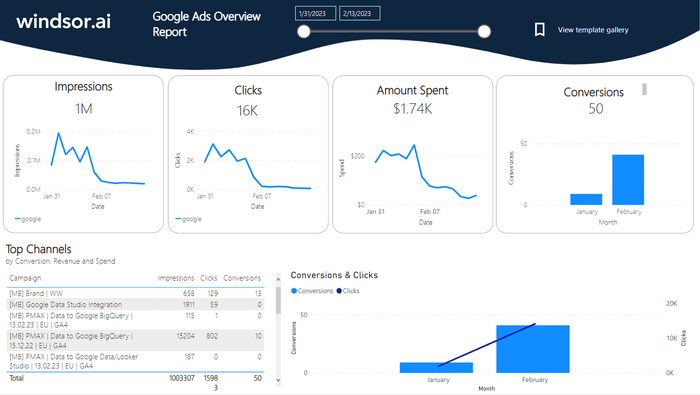
Power BI Google Ads Dashboard Template
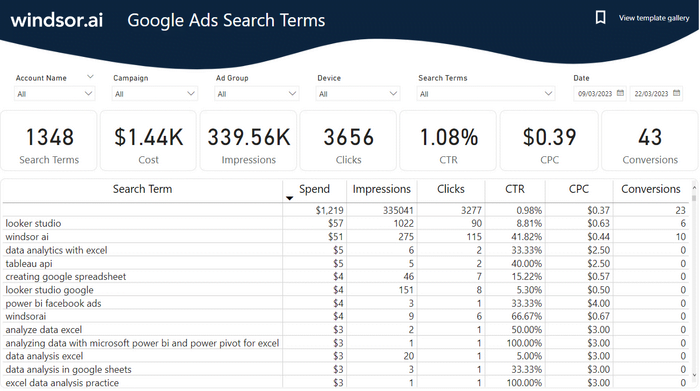
Power BI Google Ads Search Term Dashboard Template
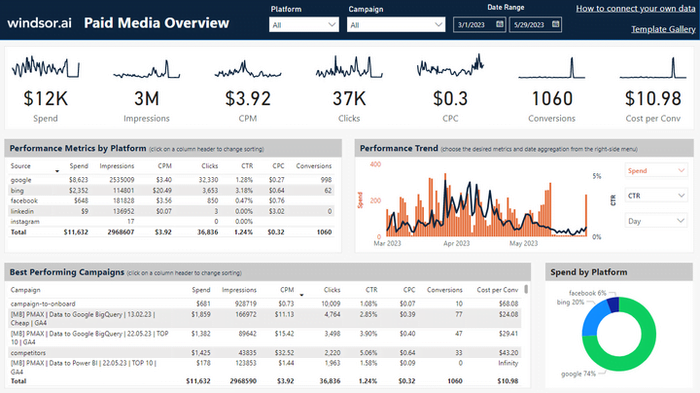
Power BI Paid Media Overview Dashboard Template
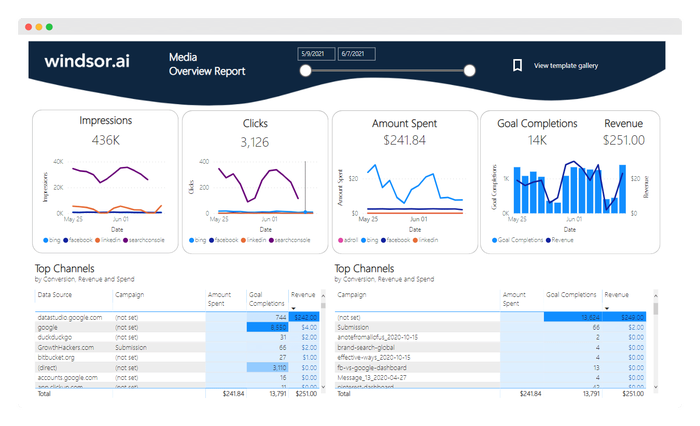
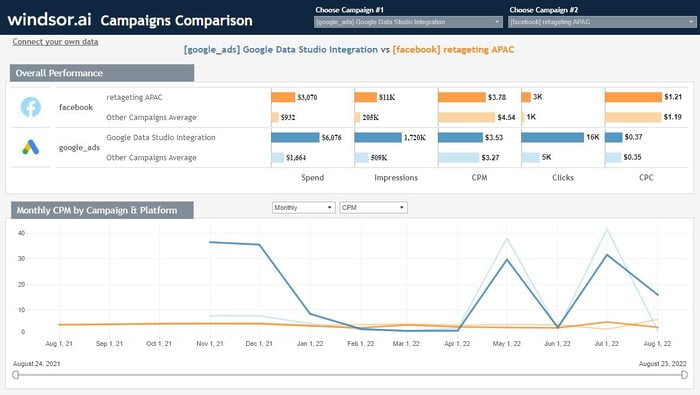
Tableau Compare Campaigns Performance Dashboard Template

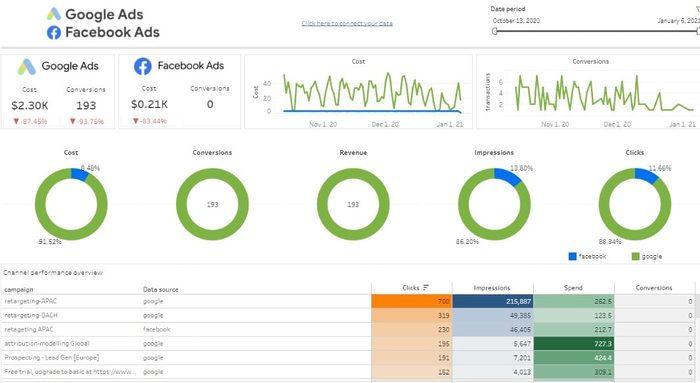
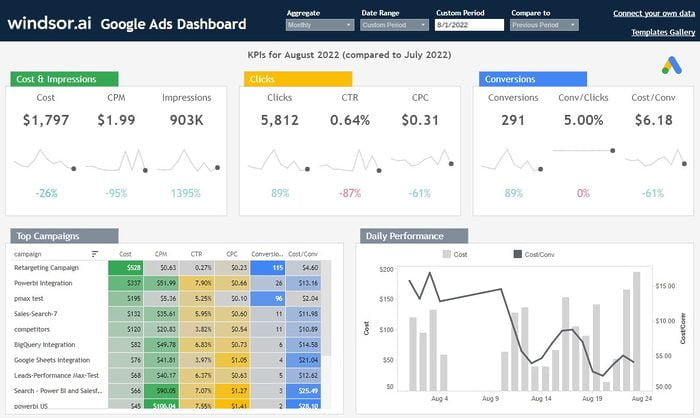
Tableau Google Ads Dashboard Template
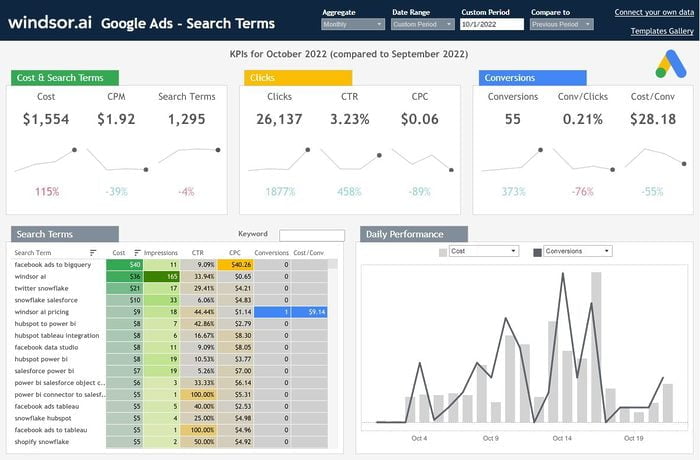
Tableau Google Ads Search Queries Dashboard Template
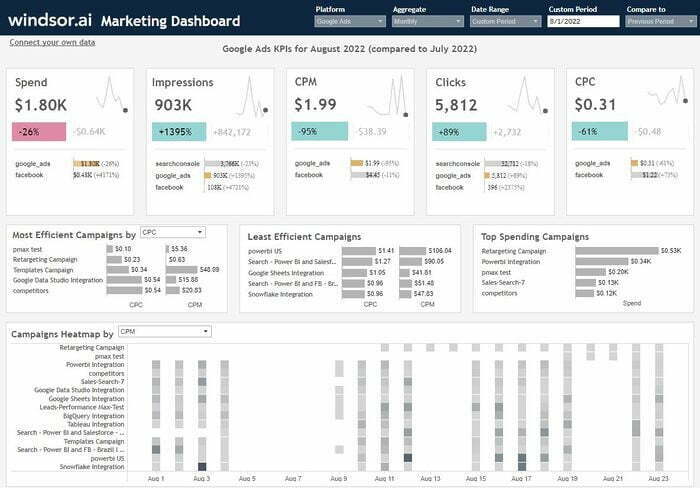
Tableau Multichannel Attribution Dashboard Template
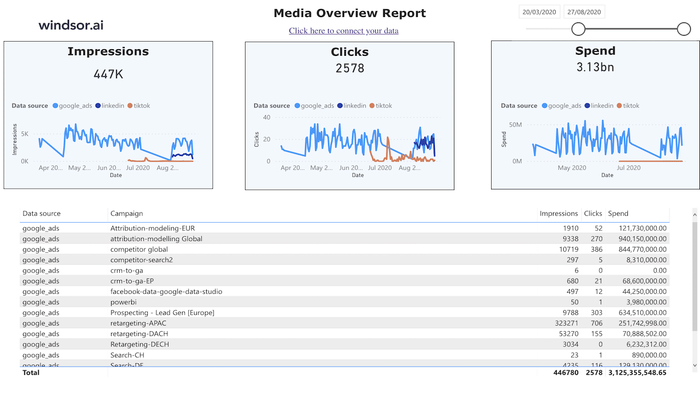
Tableau Web Media Overview Dashboard Template


What is a Google Ads report template?
A Google Ads report template brings your campaign metrics into one ready-made dashboard. Track impressions, clicks, and conversions, and break down results by campaign, ad group, keyword, device, or country to see what drives performance and where you’re wasting spend.
With Windsor.ai, you can send Google Ads data directly to Data Studio, Power BI, Tableau, Google Sheets, or Excel. Connect Search Console to add organic search data to the same report. Compare both channels during monthly PPC reviews or use the report to update clients, without manual CSV exports.
Which Google Ads report template to pick
Use the table below to compare all 28 free templates in this gallery. Choose from 9 Google Ads-only reports or 19 templates that combine Google Ads with Meta Ads, GA4, or other platforms. Some template titles still use the name Looker Studio instead of Data Studio.
| Template | Tool | Platforms | Best for | Key metrics |
|---|---|---|---|---|
| Data Studio Google Ads Dashboard | Data Studio | Google Ads | Campaign, country and keyword results on four pages | spend, CTR, CPM, conversion rate, keyword performance, results by country |
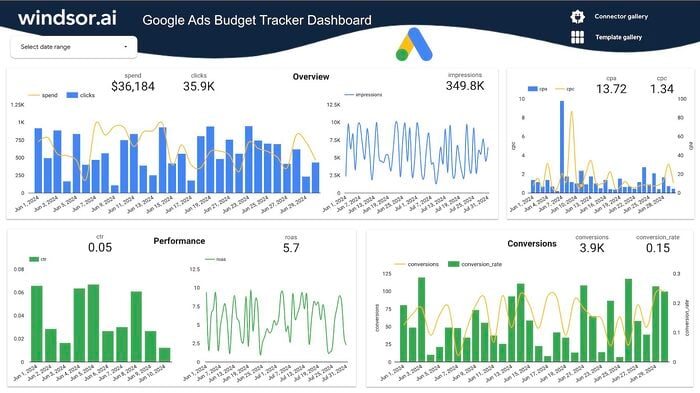
| Data Studio Google Ads Budget Tracker | Data Studio | Google Ads | Spend against budget | spend, spend vs. budget |
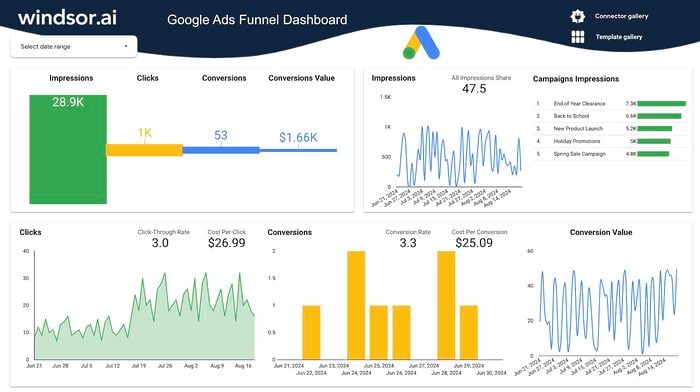
| Data Studio Google Ads Funnel | Data Studio | Google Ads | Impressions to clicks to conversions, by campaign | impressions, clicks, conversions, conversion value, CPC, spend, conversion rate |
| Power BI Google Ads Lead Generation | Power BI | Google Ads | Leads by campaign type, keyword, match type and country | spend, conversions, CPA, cost per lead, conversion rate, CPC, CTR, CPM |
| Power BI Google Ads | Power BI | Google Ads | A quick overview by date and campaign | spend, impressions, clicks, conversions |
| Power BI Google Ads Search Terms | Power BI | Google Ads | Search terms by campaign, ad group and device | search terms, spend, impressions, clicks, CTR, CPC, conversions |
| Tableau Google Ads | Tableau | Google Ads | Campaign drill-down and period comparison | cost, CPM, impressions, clicks, CTR, CPC, conversions, conversion rate, cost per conversion |
| Tableau Google Ads Search Queries | Tableau | Google Ads | Search query performance | cost, CPM, search terms, clicks, CTR, CPC, conversions, conversion rate, cost per conversion |
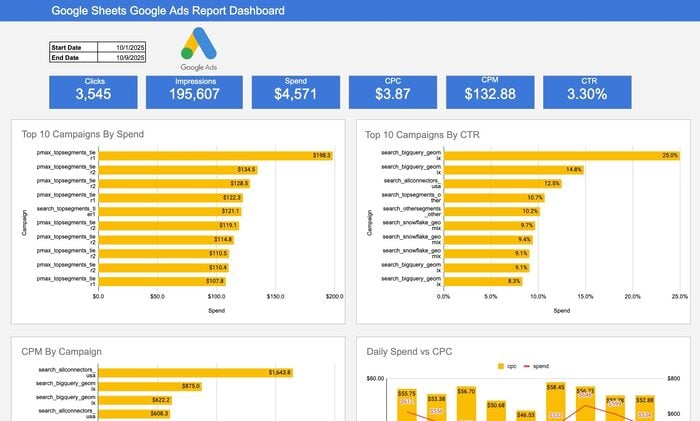
| Google Sheets Google Ads Report | Google Sheets | Google Ads | A shareable spreadsheet view, with top campaigns by CTR | impressions, clicks, spend, CPC, CTR, CPM |
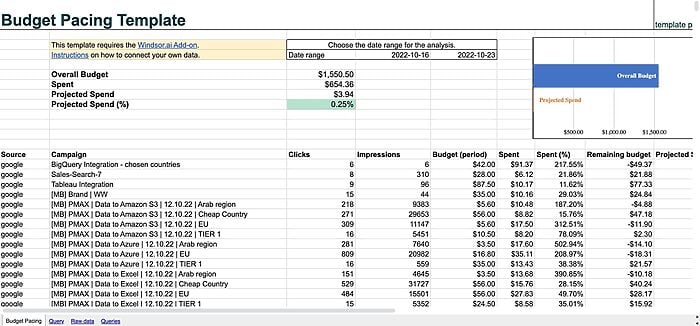
| Google Sheets Budget Pacing | Google Sheets | Google Ads, Meta Ads, LinkedIn Ads | Spend pacing against budget across platforms | budget, spend, projected spend, projected spend %, source, medium, campaign |
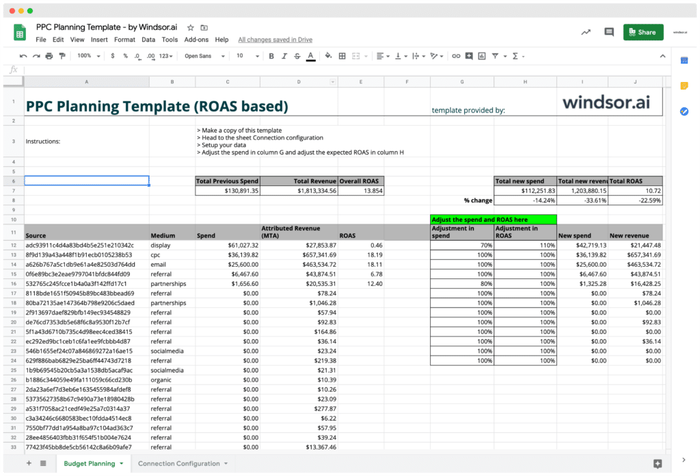
| Google Sheets PPC Planning | Google Sheets | Google Ads, Meta Ads, Microsoft Ads, LinkedIn Ads, YouTube Ads, X Ads, TikTok Ads, Snapchat Ads, Pinterest Ads | Testing budget changes before you make them | spend, ROAS by source, campaign and day of week |
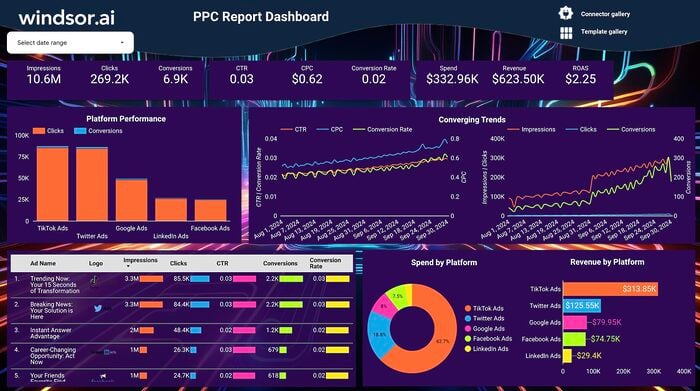
| Data Studio PPC Report | Data Studio | Google Ads, Meta Ads, LinkedIn Ads, TikTok Ads, X Ads | Paid search and social in one report | impressions, clicks, CTR, conversions, cost |
| Data Studio Google Ads vs. Facebook Ads | Data Studio | Google Ads, Meta Ads, GA4 | Google Ads and Meta Ads side by side | spend, clicks, impressions, GA4 conversions, by channel and campaign |
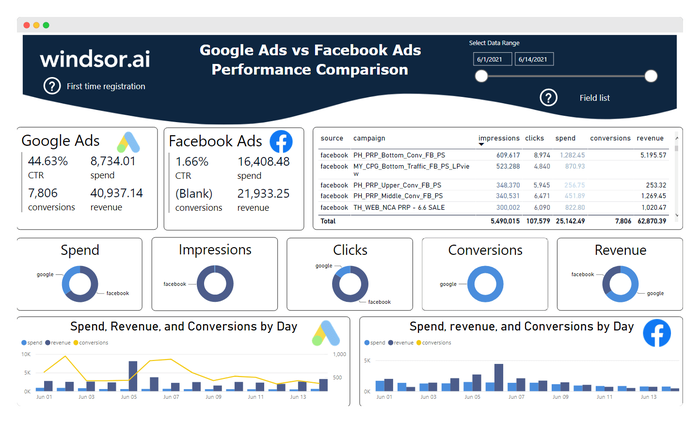
| Power BI Facebook Ads vs. Google Ads | Power BI | Google Ads, Meta Ads | Client reporting on both platforms | clicks, impressions, spend, sessions, conversions, revenue, by campaign |
| Tableau Facebook Ads vs. Google Ads | Tableau | Google Ads, Meta Ads, GA4 | Client reporting on both platforms | clicks, impressions, spend, sessions, conversions, revenue by campaign |
| Data Studio Facebook Ads E-commerce | Data Studio | Meta Ads, Google Ads, GA4 | Meta Ads and GA4 store results in one report | spend, clicks, impressions, GA4 conversions, revenue by channel and campaign, cost per purchase, total conversion value |
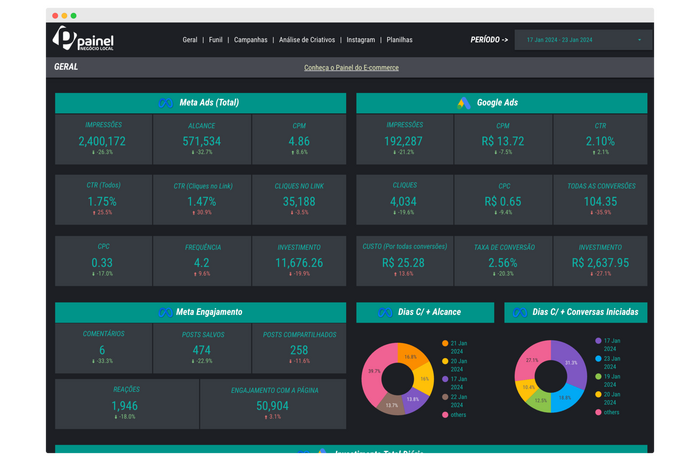
| Painel Para Negócios Locais | Data Studio | Meta Ads, Google Ads | Local businesses, in Portuguese | impressions, reach, CTR, CPC, cost per lead, engagements |
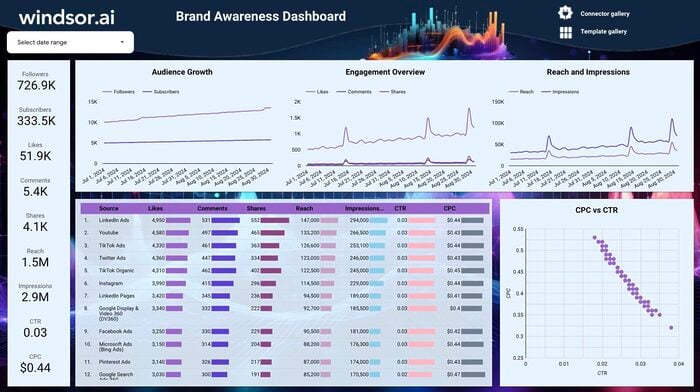
| Data Studio Brand Awareness | Data Studio | LinkedIn Ads, YouTube, TikTok Ads, X Ads, Instagram, Meta Ads, Microsoft Ads, Pinterest Ads, Search Console | Followers, engagement and reach across branding channels | followers, likes, comments, shares, reach, impressions, CTR, CPC |
| Data Studio Marketing Agency Report | Data Studio | The ad and social platforms you connect | Cross-channel results for a client | impressions, clicks, conversions, cost, ROAS, reach, CTR, engagement, cost per acquisition |
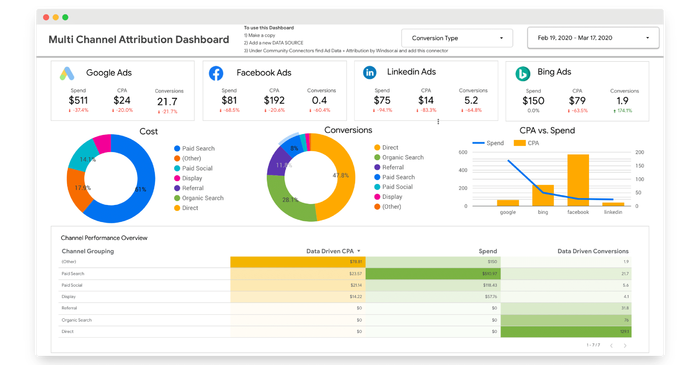
| Data Studio Multichannel Attribution Dashboard | Data Studio | Google Ads, Meta Ads, LinkedIn Ads, Microsoft Ads | Spend and conversions across four ad platforms | spend, conversions, conversions vs. spend by channel |
| Data Studio CRM Attribution | Data Studio | Google Ads, Meta Ads, LinkedIn Ads, Microsoft Ads, plus Salesforce, HubSpot, Pipedrive, Zoho CRM, ActiveCampaign, Marketo, Microsoft Dynamics or Freshsales | Ad spend next to leads, opportunities and customers | spend, conversions, revenue, MQLs, SQLs, opportunities, customers by channel |
| Power BI Paid Media Overview | Power BI | The ad platforms you connect | Paid media by platform and campaign | spend, impressions, CPM, clicks, CPC, CTR, conversions, cost per conversion |
| Power BI Web Media & SEO Overview | Power BI | GA4, Search Console, plus ad platforms such as Google Ads, Meta Ads, LinkedIn Ads and Microsoft Ads | Paid media and SEO results in one report | clicks, impressions and spend by channel and campaign; Search Console clicks, impressions, CTR, average position |
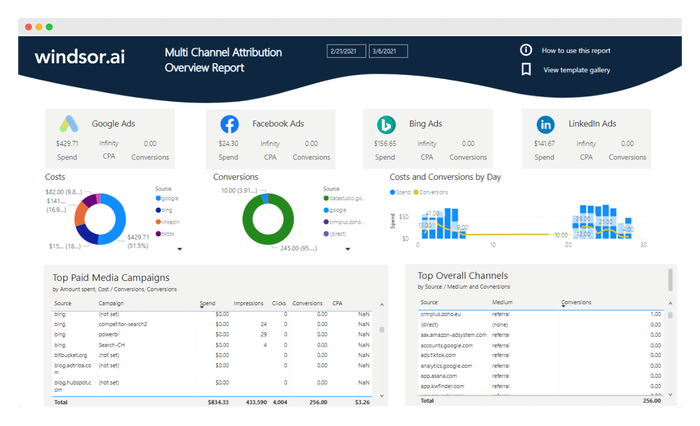
| Microsoft Power BI Multichannel Marketing Attribution | Power BI | Microsoft Ads, Meta Ads, Google Ads, Salesforce, TikTok Ads, X Ads, YouTube Ads | Multichannel overview | clicks, conversions |
| Tableau Compare Campaigns | Tableau | GA4, Google Ads, Meta Ads, TikTok Ads, YouTube Ads, LinkedIn Ads | Campaigns from several platforms side by side | spend, clicks, impressions, GA4 conversions |
| Tableau Web Media Overview | Tableau | GA4, plus ad platforms such as Google Ads, Meta Ads, LinkedIn Ads and Microsoft Ads | Clicks, impressions and spend next to sessions | source, medium, campaign, clicks, impressions, spend, sessions |
| Tableau Multichannel Attribution | Tableau | Google Ads, Meta Ads, Microsoft Ads, GA4, LinkedIn Ads, TikTok Ads, HubSpot, Salesforce, Stripe and others | Overview of the most-used marketing channels | source, medium, campaign, clicks, impressions, spend, sessions, GA4 conversions |
| Excel Marketing Reporting | Excel | AdRoll, Microsoft Ads, Criteo, Meta Ads, Google Ads, GA4, LinkedIn Ads, Pinterest Ads, Salesforce, Snapchat Ads, TikTok Ads, X Ads, YouTube Ads | Multi-platform reporting in a free downloadable workbook | impressions, clicks, CTR, CPC, conversions, and cost per conversion |
Google Ads report example: campaign types and brand clicks with Search Console
This example combines Windsor.ai’s Google Ads and Search Console data from Q3 2026 (1 July to 30 September). It shows which campaign types get impressions and clicks, then compares brand-ad clicks with organic search clicks for the company name to help assess how paid and organic results work together.
Step 1: Connect Google Ads and Search Console. Sign in at onboard.windsor.ai, choose the Google Ads connector, and authorize your account. Then add the Search Console connector and select your site.

Step 2: Pull the campaign fields. In the data preview, select your date range and include these fields: campaign name, campaign type, impressions, clicks, and spend.
Step 3: Group the campaigns. Group campaigns into three categories: brand search (Search campaigns targeting the company name), Performance Max (campaigns of this type), and non-brand search (all other Search campaigns). The table below shows which field IDs to select in Windsor.ai.
| Source | Windsor.ai fields | Used for |
|---|---|---|
| Google Ads | campaign, campaign_type, impressions, clicks, spend | Campaign groups, shares of impressions, clicks and spend, and CTR |
| Search Console | query, clicks, impressions, date | Organic clicks and CTR on brand queries |
Step 4: Compare the shares. Divide each group’s impressions, clicks, and spend by the account total. CTR is clicks divided by impressions.
| Campaign group | Share of impressions | Share of clicks | Share of spend | CTR |
|---|---|---|---|---|
| Non-brand search | 40.9% | 51.9% | 89.6% | 3.8% |
| Performance Max | 58.2% | 29.7% | 8.6% | 1.5% |
| Brand search | 0.9% | 18.4% | 1.8% | 58.1% |
Performance Max drove most impressions (58.2%) and nearly a third of clicks (29.7%), using 8.6% of spend. Its 1.5% CTR was lower than the 3.8% recorded by non-brand search. The difference makes sense given its channel mix: Performance Max serves ads on YouTube, Display, and Gmail as well as other placements, where click behavior differs from search.
Brand search contributed 18.4% of clicks from just 0.9% of impressions, with a CTR of 58.1%. This high rate reflects the intent behind branded searches: people looking for a company often click its ad. However, Windsor.ai ran brand ads mostly in early July and stopped them after 4 September. A quarter with brand ads running throughout would likely show a larger share for this campaign group.
The 2.96% account-wide CTR doesn’t show the whole story. Each campaign type behaves differently, so compare CTR by type before comparing weeks, months, or accounts. The Google Sheets Google Ads Report template in the table helps you identify your highest-CTR campaigns.

Step 5: Filter Search Console to brand queries. Keep the queries that contain your brand name, in every spelling people use, and drop the ones that mean something else. For Windsor.ai, that means queries with “windsor” plus “ai” or “ia”: “windsor ai”, “windsor.ai”, and “windsorai” stay, and searches for the town of Windsor drop out.
Step 6: Compare paid and organic brand clicks. For each period, calculate paid brand clicks as a share of total brand clicks: divide Google Ads brand clicks by the sum of paid brand clicks and organic clicks on brand queries. The example splits the data into three periods: full brand budget through 15 July, reduced budget from 16 July to 4 September, and no brand ads after 4 September.
| Period | Paid share of brand clicks | Organic CTR on brand queries | Brand clicks per day (1 to 15 July = 100) |
|---|---|---|---|
| 1 to 15 July (full brand ads) | 34.9% | 44.2% | 100 |
| 16 July to 4 September (small brand budget) | 3.0% | 59.5% | 91 |
| 5 to 30 September (no brand ads) | 0% | 61.6% | 110 |
Brand ads accounted for 34.9% of brand-search clicks at full budget, but just 3.0% after the cut. Organic CTR rose from 44.2% to 59.5%, while daily impressions stayed level. Total daily clicks fell by only 9%, meaning organic search recovered about 70% of the clicks lost by brand ads.
A 21% increase in brand-query impressions makes September harder to compare with earlier months. More people were searching for Windsor.ai, which may explain the higher click index. Google Ads alone can’t show whether those searches led to paid or organic clicks. The Power BI Web Media & SEO Overview template in the table puts Search Console and ad platforms side by side.


What KPIs does a Google Ads dashboard track?
Choose the KPIs that match your campaign goals. Windsor.ai pulls the fields for each one from Google Ads, plus Search Console for the last one.
- CTR: clicks divided by impressions. Compare CTR within the same campaign type, as Search and Performance Max typically have very different rates.
- CPC: spend divided by clicks.
- Conversion rate: conversions divided by clicks.
- Cost per conversion: spend divided by conversions. Lead generation accounts often call it cost per lead.
- ROAS: conversion value divided by spend.
- Budget pacing: spend to date divided by the budget allocated for the same period.
- Wasted search spend: spend on search terms with no conversions, divided by all search term spend.
- Paid share of brand clicks: Brand campaign clicks divided by the combined total of paid brand clicks and organic clicks on brand queries. If the paid share drops while organic CTR rises, some of the clicks lost by ads may have shifted to organic search.
What to include in a monthly Google Ads report
A monthly Google Ads report shows how you spent your budget, what results it generated, and how performance compares with the previous period or your targets.
Split the data by the following fields:
- campaign type (Search, Performance Max, Display, Video, Shopping)
- campaign and ad group
- network (Google Search, search partners, Display, YouTube)
- device
- search term
- country or region
- date (by day, week, or month)
A useful monthly Google Ads report should help you see what worked and what needs attention. Start with spend vs. budget, conversions, and cost per conversion, compared with the previous month. Then break down CTR, CPC, and conversion rate by campaign type. End with the ten most expensive search terms, highlighting those with no conversions for a negative keyword review. For brand campaigns, compare paid results with Search Console clicks on brand queries.
Browse the full template gallery for dashboards by platform and destination, or see the paid media templates for reporting across ad platforms. How to use Windsor.ai for paid media shows how to ask an AI assistant which campaigns waste budget, then act on the answer.
FAQs
Can I see several Google Ads accounts in one dashboard?
Yes. Windsor.ai lets you combine data from multiple Google Ads accounts in one report, including accounts managed through an MCC. Select the accounts you need, then use the account name field to compare performance across clients or accounts.
Will the numbers match the Google Ads interface?
Google Ads spend, clicks, and impressions come directly from the Google Ads API, so they match Google Ads for the same accounts and dates. GA4 data can show different numbers: sessions measure website visits instead of ad clicks, and GA4 may attribute conversions differently from Google Ads.
Do the templates include Performance Max campaigns?
Yes. Connect Google Ads once to report on both Performance Max and Search campaigns. The campaign type field identifies each campaign, so you can group and compare them in the same dashboard.
Is Google Ad Manager the same as Google Ads?
No. Choose Google Ads if you want to report on your advertising campaigns across Google Search, YouTube, and partner sites. Choose Google Ad Manager if you want to report on ad inventory and sales for your own websites or apps. Windsor.ai has a connector for each: Google Ads and Google Ad Manager. The templates in this gallery are for Google Ads.
Can I change my campaigns from the dashboard?
No. The templates show your data but don’t change your campaigns. To act on those insights, connect Windsor.ai to Claude or ChatGPT. From the chat, you can pause Google Ads campaigns, update budgets and bids, and add negative keywords. You’ll be asked to confirm each change before it’s made. Explore all available actions in the write actions documentation.
Is there a Google Ads report template for Excel?
Yes. The Excel Marketing Reporting template is a free workbook that combines Google Ads data with Meta Ads, GA4, and other platforms. If you need a shareable spreadsheet, copy the Google Sheets Google Ads Report template and export it as an Excel file whenever you need it.
Can I use these templates for monthly client reports?
Yes. Connect each client’s Google Ads account once, then simply update the report’s date range each month to review the previous month’s results. Keep in mind that each client account counts toward your plan’s account limit. The Data Studio Marketing Agency Report template brings cross-channel performance into one report.
Can I see Google Ads and Search Console in one report?
Yes. Connect both to Windsor.ai and use the Power BI Web Media & SEO Overview template. It shows Search Console clicks, impressions, CTR, and average position next to clicks, impressions, and spend from your ad platforms. The example above uses the same two sources to compare paid and organic brand clicks.
Tired of juggling fragmented data? Get started with Windsor.ai today to create a single source of truth


