 Destinations
 Data sources
 AI insights
 About us
 Careers
 Security
 Customer reviews
 Contact us
 Affiliate program
 Solution partners
 Template gallery
 Looker Studio templates
 Power BI templates
 Excel templates
 Google Sheets templates
 Tableau templates
 Facebook Ads templates
 Google Ads templates
 Data fields & Metrics
 AI prompt library & Guides
 Product documentation
 API documentation
 Case studies
 Blog
Blog Data models
 Windsor vs Supermetrics
 Windsor vs Funnel.io
 Windsor vs Fivetran
 Windsor vs Rivery
 Windsor vs Portermetrics
 Windsor vs Coupler.io
Free SaaS Dashboard Templates
At Windsor.ai, we strive to make SaaS marketing reporting as effortless as possible for our users.
These SaaS report templates will help you optimize your marketing spending and investments.
Free SaaS Dashboard Templates with easy-to-follow instructions for connecting your own data.
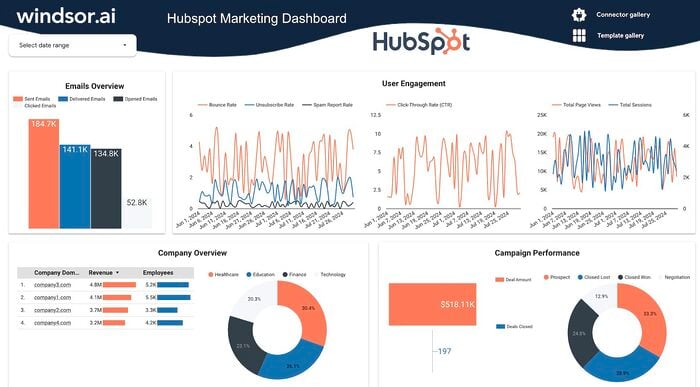


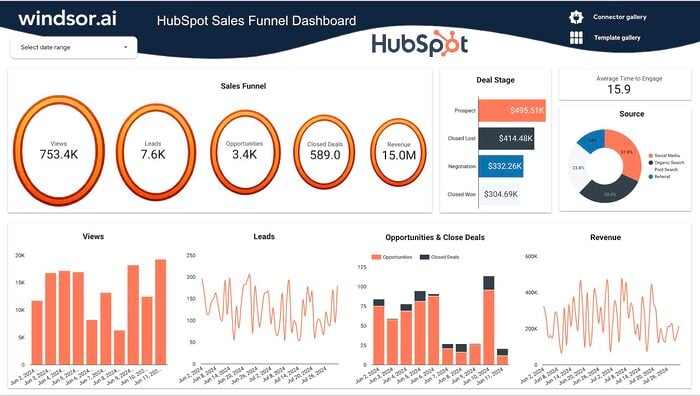
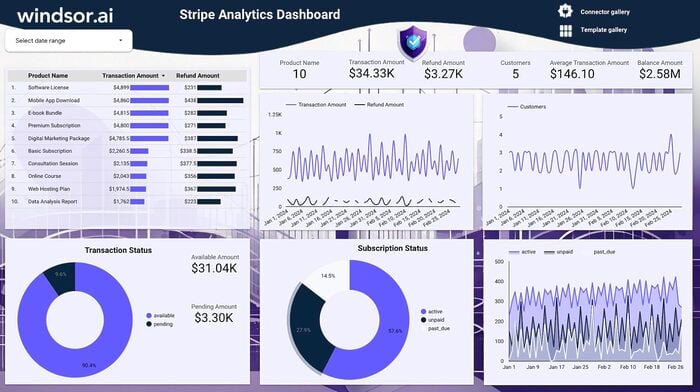

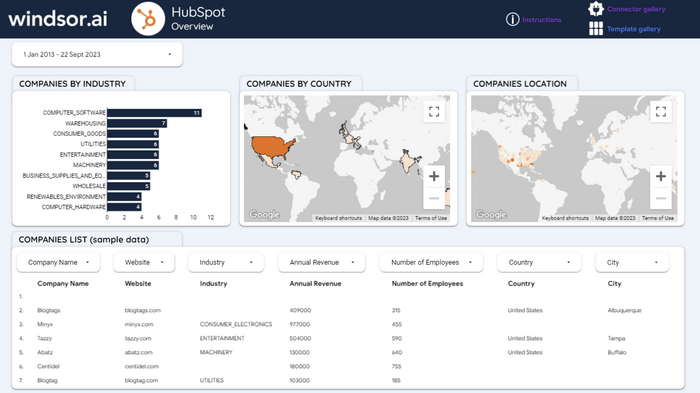
Looker Studio HubSpot Dashboard Template
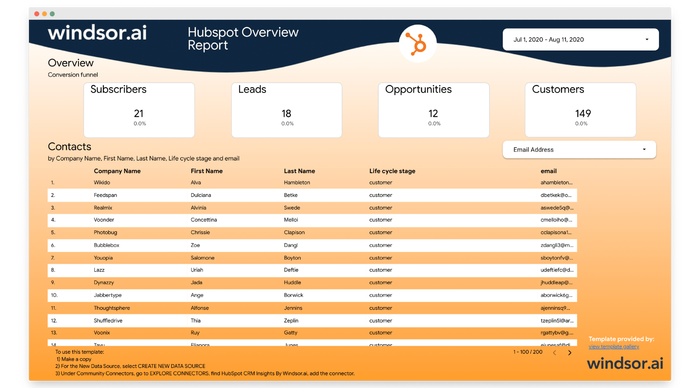
Looker Studio HubSpot Overview Report
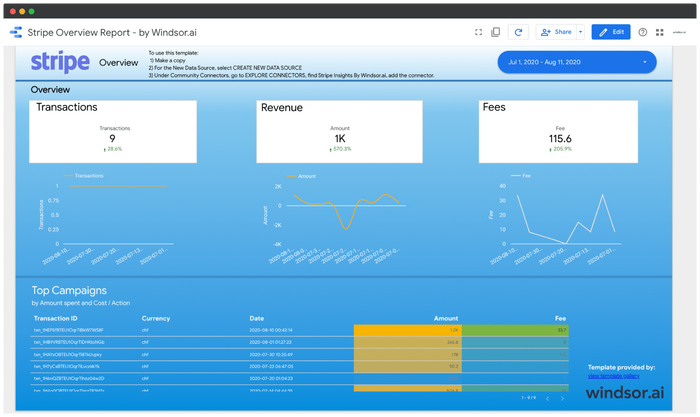
Looker Studio Stripe Overview Report
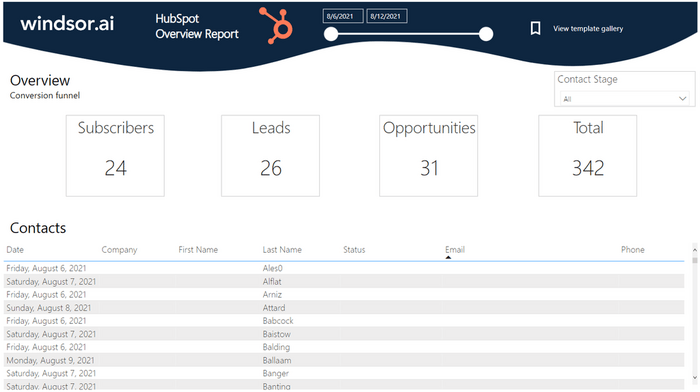
Power BI HubSpot Overview Dashboard Template

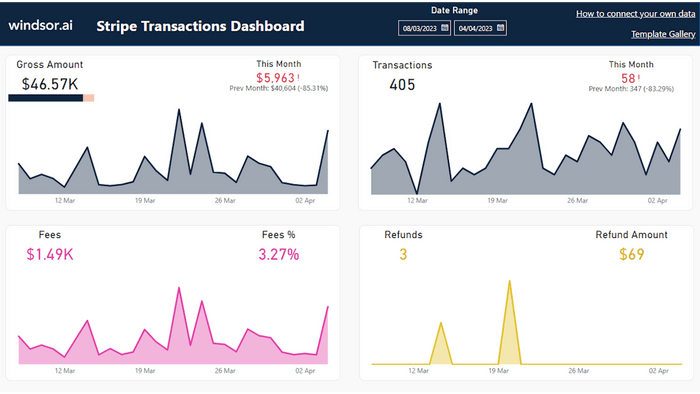
Power BI Stripe Transactions Dashboard Template
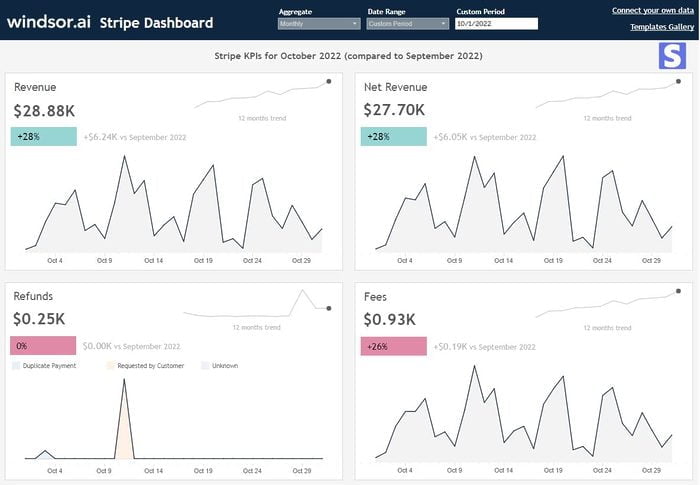
Tableau Stripe Dashboard Template

What is a SaaS Dashboard?
A SaaS dashboard serves as a business instrument offering real-time insights into SaaS applications. It enables enterprises to monitor and analyze critical data metrics and KPIs, supplying the necessary information for data-centric decision-making and optimizing applications.
Metrics like recurring revenue, lifetime customer value, cost to acquire customers, and net retention are paramount for SaaS founders and executives.
A SaaS dashboard consolidates vital SaaS metrics from sales, marketing, finance, support, and development teams, providing executives with a comprehensive overview of the business.
Benefits of Using an Integrated SaaS Dashboard
An integrated SaaS dashboard offers a multitude of benefits:
- Real-time Data Tracking: Enables prompt and effective decision-making, allowing swift responses to changes in the business environment.
- Informed Decision-making: In the current business landscape, being data-driven is not just a goal but essential for survival. Data significantly enhances decision quality, increasing the likelihood of achieving business objectives.
- Improved Productivity: By consolidating all data sources in one place, a SaaS dashboard eliminates the time and effort spent on manual data gathering and consolidation.
- Holistic View of Performance: Provides a comprehensive view of key metrics in one place, offering insight into overall business performance.
- Predictive Analysis: Advanced SaaS Dashboards can analyze trends and patterns to predict future outcomes, enabling proactive decision-making.
- Improved Customer Experience: They enable businesses to monitor customer activities and identify patterns, leading to the development of customer-centric strategies and enhanced user experiences.
Key Components of a Robust SaaS Dashboard
A robust SaaS dashboard includes key components such as:
- Key Performance Indicators (KPIs): Clear indicators of performance against strategic objectives, tailored to goals such as customer retention or sales performance.
- User-friendly Interface: Easy navigation and interpretation for users to extract actionable insights and make informed decisions quickly.
- Real-time Data Updates: Data on the dashboard should refresh in real-time or near real-time, ensuring the most up-to-date information is always available.
- Customization Capabilities: Designed to meet unique business needs and user preferences, facilitating seamless integration with key business systems and offering diverse graph styles through advanced charting capabilities.
Most popular SaaS dashboard examples
- SaaS marketing dashboard template
- SaaS analytics dashboard template
- SaaS sales dashboard template
- SaaS finance dashboard template
- SaaS product dashboard template
- SaaS executive dashboard template
- SaaS MRR dashboard template
- SaaS customer dashboard template
- SaaS product usage dashboard template
- SaaS growth dashboard template
Essential SaaS Metrics for Your Dashboard
SaaS metrics are vital for tracking the performance and growth of a SaaS business. Here is a compilation of some of the most crucial SaaS metrics:
- Monthly Recurring Revenue (MRR): The revenue generated from subscriptions each month.
- Annual Recurring Revenue (ARR): The revenue generated from subscriptions each year.
- Churn Rate: The percentage of customers who cancel their subscriptions during a specific time period.
- Customer Acquisition Cost (CAC): The average cost of acquiring a new customer, including marketing and sales expenses.
- Lifetime Value (LTV): The estimated net profit that a customer will generate over the entire duration of their relationship with the company.
- Average Revenue per User (ARPU): The average revenue generated per user or customer calculated by dividing total revenue by the number of customers.
- Customer Retention Rate: The percentage of customers retained.
Choosing the Right SaaS Dashboard Software
Selecting the Right SaaS Dashboard Choosing a SaaS Dashboard should align with the business’s specific needs and goals. It should be user-friendly, scalable, and offer robust security features. Furthermore, it should allow for seamless integration with other platforms and systems, ensuring a smooth flow of data and facilitating efficient operations.
Several software options are available for building SaaS dashboards, each with its own pros and cons. It is crucial to choose a tool that aligns with your specific business needs. Windsor.ai stands out as a powerful option, capable of integrating all business systems into sheets, automating data updates, and providing a comprehensive view of performance.
Check out some of the features of Windsor.ai:
- > 350+ data sources to 14 data destinations
- ETL (Extract – Transform – Load) functionality for all data destinations (incl. databases) available on all plans
- All connectors available on all plans: No premium connectors
- Database destination pricing independent of row count
- Forever Free Plan
- SOC 2 Type 2 certified, supports single sign on and multi factor authentication
- Email and live chat support
Steps to Build a SaaS Dashboard
Building a SaaS dashboard involves several crucial steps:

1. Define Your Goals
Identify the specific objectives you aim to achieve with the dashboard, such as tracking sales performance or monitoring customer satisfaction.

2. Identify Your KPIs
Choose metrics aligned with your goals, such as revenue, churn rate, customer acquisition cost, and customer lifetime value.

3. Choose Your Dashboard Software
Select a dashboard tool based on your needs, budget, and data complexity, ensuring accessibility for both non-technical and data team users.

4. Design Your Dashboard Layout
Create a visually engaging and logically arranged layout that allows for easy interpretation of data and immediate recognition of key KPIs.

5. Implement and Test Your Dashboard
After setting up the dashboard, conduct testing to ensure functionality, data accuracy, and ease of navigation before regular use.
Turn your data into a strategic asset. Get instant insights across all your platforms with Windsor.ai


