 Destinations
 Data sources
 AI insights
 About us
 Careers
 Security
 Customer reviews
 Contact us
 Affiliate program
 Solution partners
 Template gallery
 Looker Studio templates
 Power BI templates
 Excel templates
 Google Sheets templates
 Tableau templates
 Facebook Ads templates
 Google Ads templates
 Data fields & Metrics
 AI prompt library & Guides
 Product documentation
 API documentation
 Case studies
 Blog
Blog Data models
 Windsor vs Supermetrics
 Windsor vs Funnel.io
 Windsor vs Fivetran
 Windsor vs Rivery
 Windsor vs Portermetrics
 Windsor vs Coupler.io
Free Cross-Channel Marketing Dashboard Templates
Free cross-channel marketing dashboard templates that put several ad and analytics platforms on one page.
Compare spend, clicks, conversions and CPA across Google Ads, Meta Ads, LinkedIn Ads, Microsoft Ads and more, with a breakdown by platform underneath.
Each template comes with instructions for connecting your own accounts through Windsor.ai.
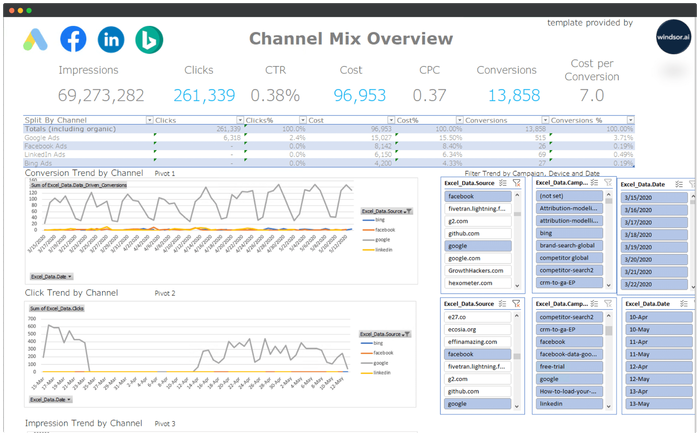





















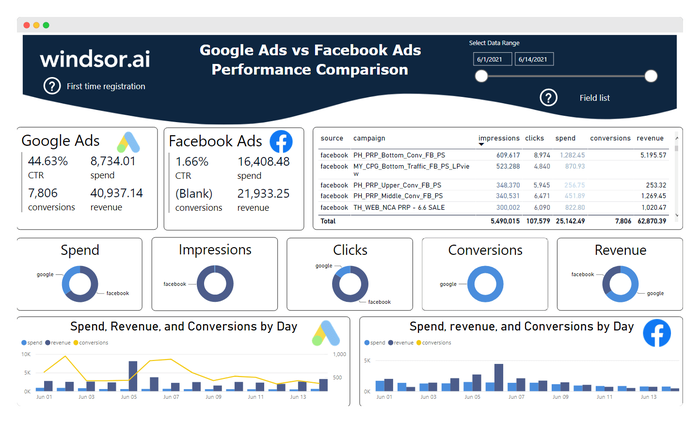
Power BI Facebook Ads vs Google Ads Report Template
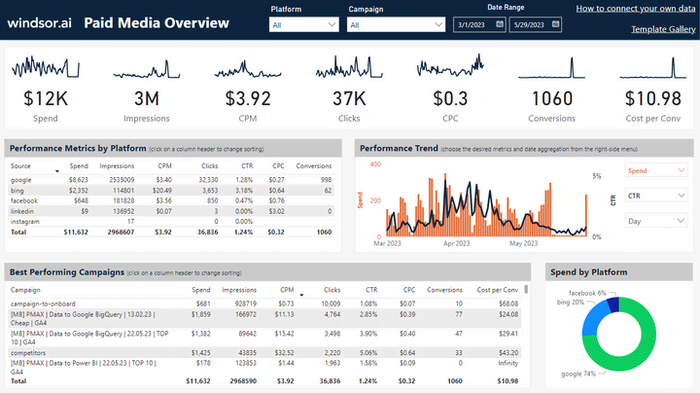
Power BI Paid Media Overview Dashboard Template
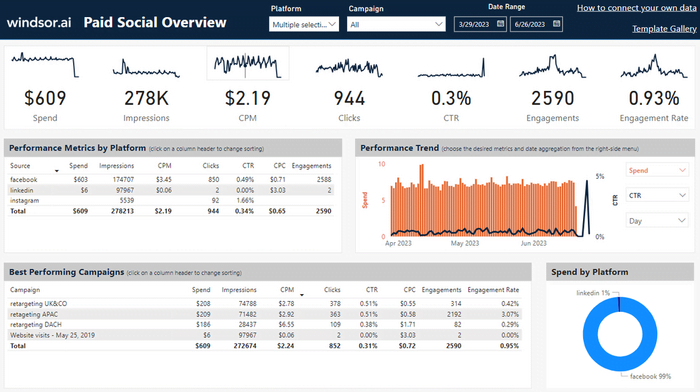
Power BI Paid Social Media Overview Dashboard Template
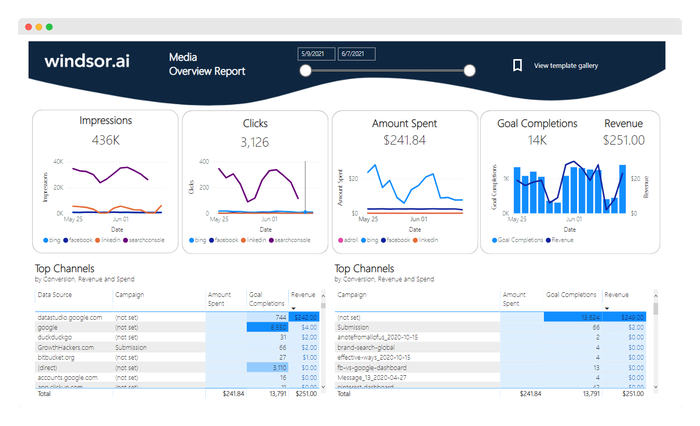
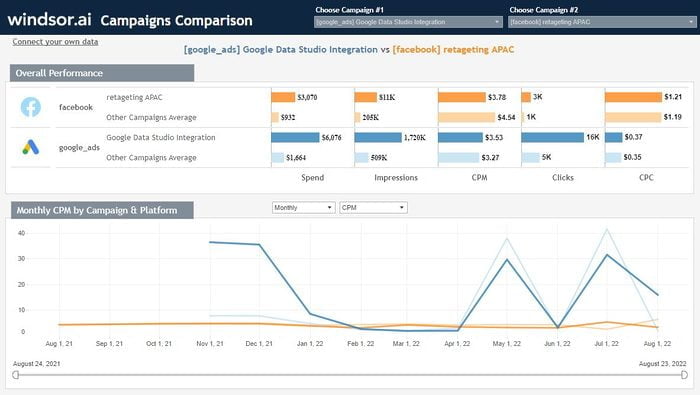
Tableau Compare Campaigns Performance Dashboard Template

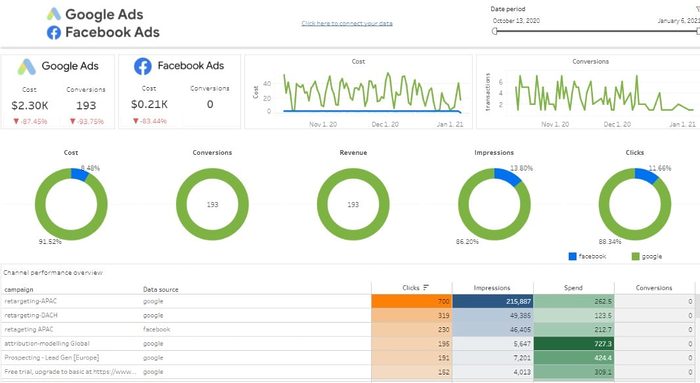
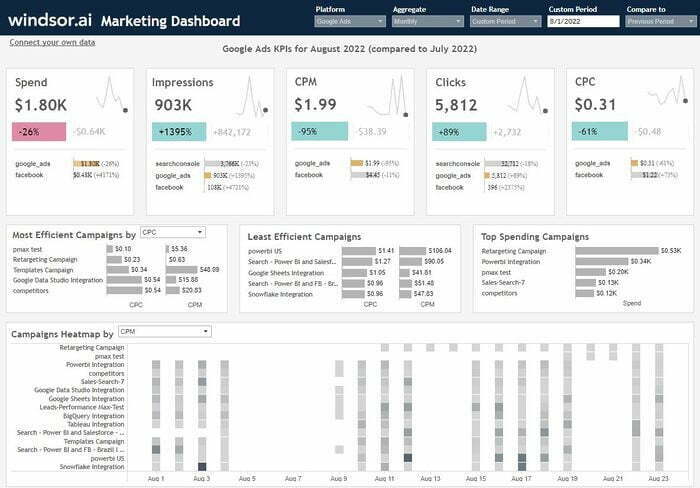
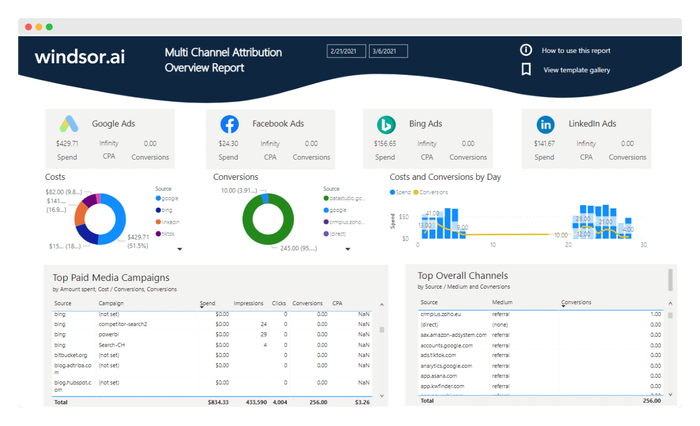
Tableau Multichannel Attribution Dashboard Template
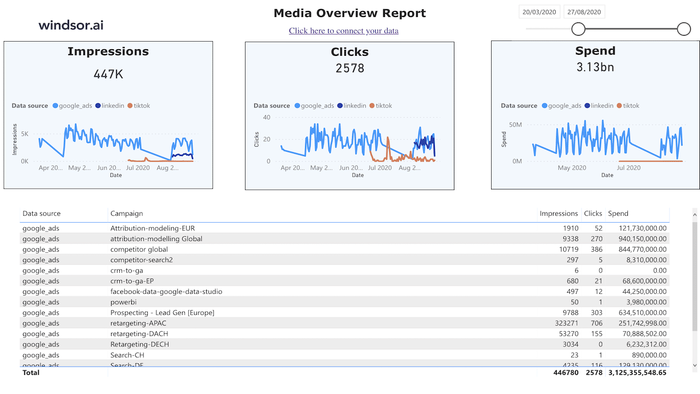
Tableau Web Media Overview Dashboard Template


What is cross-channel marketing analytics?
Cross-channel marketing analytics compares the results of every channel you run, such as paid search, paid social, social media, email and SEO, in one view, with the same date range and the same metric names. It answers questions no single platform can, such as which channel brings conversions at the lowest cost, or how total spend changed month over month.
Which cross-channel template to pick
All 16 templates in this gallery combine at least two platforms. Pick by the tool you report in and the platforms you run.
| Template | Tool | Platforms it combines |
|---|---|---|
| Power BI Paid Media Overview | Power BI | AdRoll, Microsoft Ads, Display & Video 360, Meta Ads, Google Ads, LinkedIn Ads, Pinterest Ads, Snapchat Ads, TikTok Ads, X Ads, YouTube Ads |
| Power BI Paid Social Media Overview | Power BI | Meta Ads, LinkedIn Ads, Pinterest Ads, Snapchat Ads, TikTok Ads, X Ads, YouTube Ads |
| Power BI Web Media & SEO Overview | Power BI | Microsoft Ads, Display & Video 360, Meta Ads, Google Ads, LinkedIn Ads, TikTok Ads, X Ads, YouTube Ads, plus GA4 and Search Console |
| Power BI Multichannel Marketing Dashboard | Power BI | Microsoft Ads, Meta Ads, Google Ads, TikTok Ads, X Ads, YouTube Ads, Salesforce, plus GA4 |
| Power BI Facebook Ads vs Google Ads | Power BI | Meta Ads, Google Ads |
| Marketing Agency Report | Data Studio | Meta Ads, Google Ads, GA4, Google Search Console, Instagram, LinkedIn Ads, X Ads, YouTube Ads |
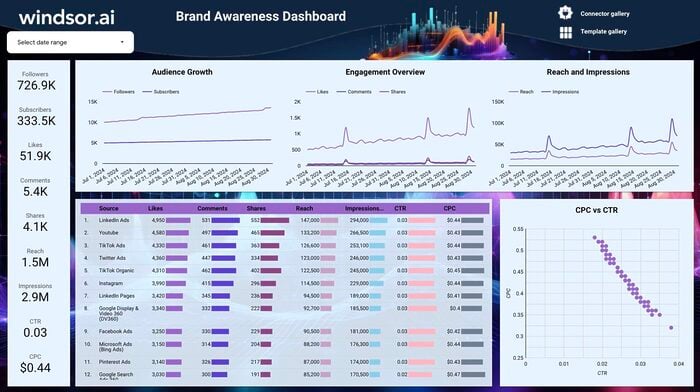
| Brand Awareness Dashboard | Data Studio | Microsoft Ads, Meta Ads, Google Ads, Google Search Console, Instagram, LinkedIn Ads, Pinterest Ads, TikTok Ads, X Ads |
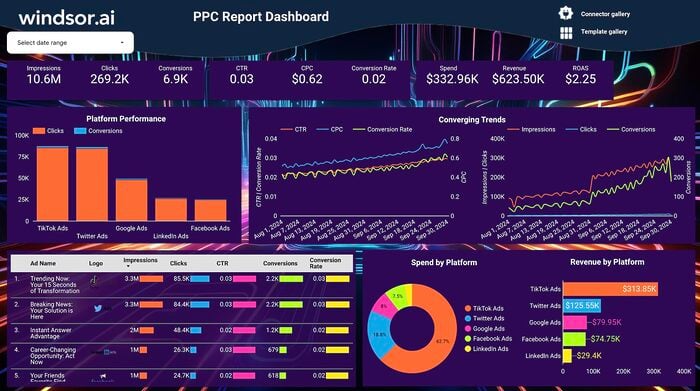
| PPC Report Dashboard | Data Studio | Microsoft Ads, Meta Ads, Google Ads, LinkedIn Ads, X Ads |
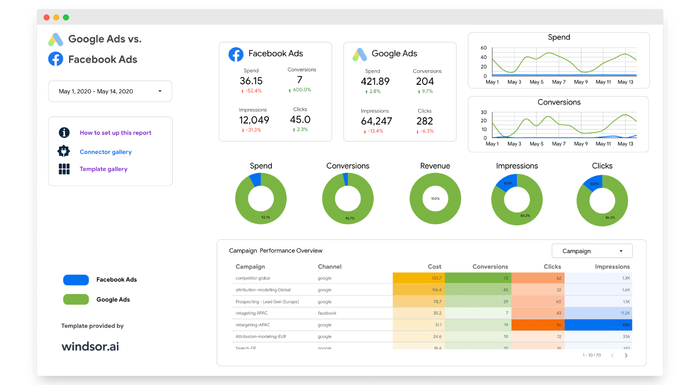
| Google Ads vs. Facebook Ads Dashboard | Data Studio | Meta Ads, Google Ads |
| Tableau Compare Campaigns Performance | Tableau | Microsoft Ads, Display & Video 360, Meta Ads, Google Ads, LinkedIn Ads, TikTok Ads, X Ads, YouTube Ads |
| Tableau Web Media Overview | Tableau | AdRoll, AppNexus, Microsoft Ads, Campaign Manager 360, Criteo, Display & Video 360, Meta Ads, Google Ads, GA4, LinkedIn Ads, TikTok Ads, X Ads |
| Tableau Multichannel Dashboard | Tableau | Microsoft Ads, Display & Video 360, Meta Ads, Google Ads, Google Search Console, LinkedIn Ads, TikTok Ads, X Ads, YouTube Ads |
| Tableau Facebook Ads vs Google Ads | Tableau | Meta Ads, Google Ads |
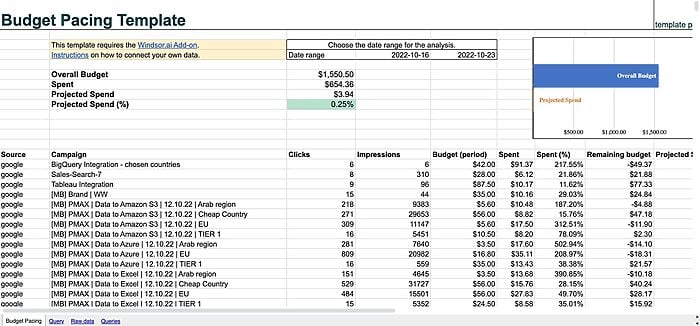
| Google Sheets Budget Pacing | Google Sheets | Display & Video 360, Meta Ads, Google Ads, LinkedIn Ads |
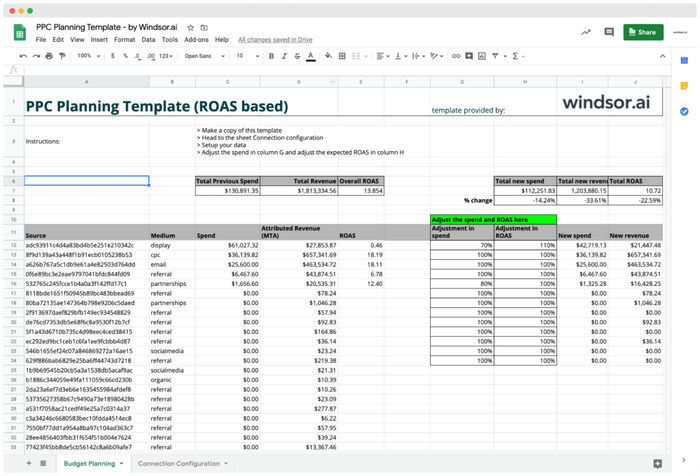
| Google Sheets PPC Planning | Google Sheets | Microsoft Ads, Meta Ads, Google Ads, LinkedIn Ads, Pinterest Ads, Snapchat Ads, TikTok Ads, X Ads, YouTube Ads |
| Excel Marketing Reporting | Excel | AdRoll, Microsoft Ads, Criteo, Meta Ads, Google Ads, GA4, LinkedIn Ads, Pinterest Ads, Salesforce, Snapchat Ads, TikTok Ads, X Ads, YouTube Ads |
What a cross-channel view shows: an example from our own accounts
This is windsor.ai’s own paid media for the 30 days from 8 September to 7 October 2026, pulled from Windsor.ai’s blended data with four fields: datasource, spend, clicks and impressions. Spend and clicks have the same names on all three platforms, so one query returns them side by side and the shares below are calculated from those totals.
| Platform (datasource) | Share of spend | Share of clicks | CTR |
|---|---|---|---|
| Google Ads (google_ads) | 94.7% | 88.7% | 2.00% |
| OpenAI Ads (openai_ads) | 5.1% | 10.3% | 0.63% |
| Meta Ads (facebook) | 0.1% | 1.1% | 1.13% |
No single platform shows this comparison: Google Ads takes almost all of the budget, while OpenAI Ads brings twice its share of spend in clicks, at a lower CTR, because its clicks cost about half as much. A cross-channel dashboard puts that comparison on one page every week, without three separate exports.
What is a cross-channel marketing dashboard?
A cross-channel marketing dashboard puts the key metrics from all channels on one page, for your own team or for your clients.
- For marketers, it replaces opening each platform’s interface: spend, clicks and conversions from paid ads, CRMs and analytics appear in one table, broken down by platform.
- For clients, it shows total results across all channels in one report.
With every channel on one page, trends that cross platforms become visible, such as a rise in branded search after a paid social campaign.
How to build a cross-channel marketing dashboard?
Building a cross-channel dashboard takes four steps.

1. Determine your objectives
Write down what the dashboard has to answer, for example whether total CPA across platforms is falling, and choose the reporting period.

2. Identify relevant metrics
Choose the KPIs that answer it, such as conversions, CPA, ROAS, CTR and conversion rate. Prefer metrics every platform reports, so the totals add up.

3. Data integration
Connect each platform to a data integration tool such as Windsor.ai. It pulls the data through each platform’s API, gives shared metrics like spend, clicks and impressions one name, and adds a data source field to tell the platforms apart.

4. Visualize and customize
Start from a template, put the cross-platform totals at the top and a breakdown by platform below, and add filters for account, campaign or date so one dashboard serves several clients.
FAQs
Which Windsor.ai connector do these templates use?
The blended connector, which carries every connected source in one data set. Fields with the same meaning, such as spend, clicks and impressions, share one name, and a data source field tells the platforms apart.
Can I compare clients against each other?
Yes. Connect every client’s accounts to one Windsor.ai account and break the dashboard down by account name, so each client’s spend and results appear in one table.
Why do conversions not add up across platforms?
Each platform counts its own conversions, and two platforms can count the same sale. For one total, use conversions from GA4 or your CRM and compare them with spend from the ad platforms.
Tired of juggling fragmented data? Get started with Windsor.ai today to create a single source of truth


