 AI insights
 About us
 Careers
 Security
 Customer reviews
 Contact us
 Affiliate program
 Solution partners
 Looker Studio templates
 Tableau templates
 Facebook Ads templates
 Google Ads templates
 Data fields & Metrics
 AI prompt library & Guides
 Product documentation
 API documentation
 Case studies
 Blog
Blog Data models
 Windsor vs Supermetrics
 Windsor vs Fivetran
 Windsor vs Portermetrics
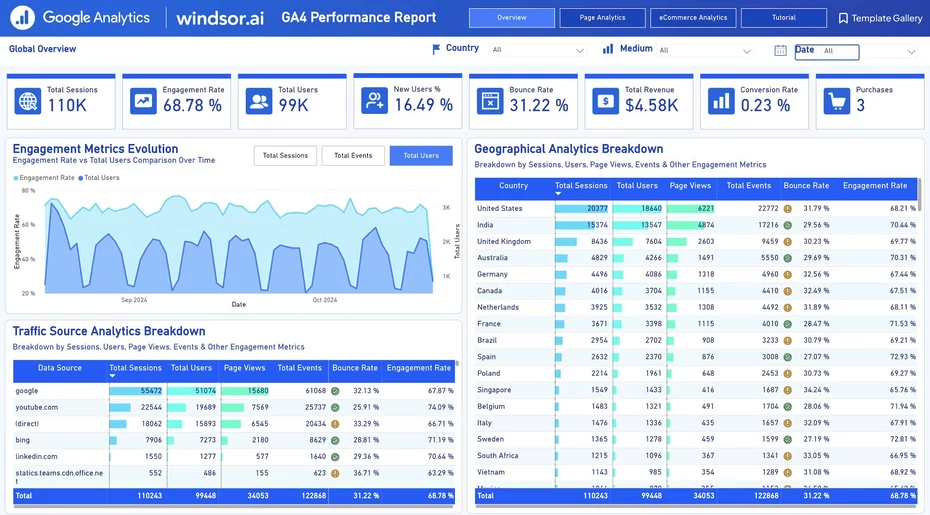
Windsor.ai gives you free access to the GA4 dashboard template, so you can automate your reporting in Power BI.
This white-label Google Analytics 4 template captures all the critical metrics and dimensions from your website data. You only need to integrate your GA4 account with the free GA4 reporting dashboard template. Then, the Windsor.ai connector automatically syncs data from GA4 to Power BI without coding.
The template is available both as
❗Important: This dashboard supports a single GA4 account. To avoid data issues, please select only one GA4 account in Windsor.ai before configuring the template.
What is Google Analytics 4 on Power BI Reporting Dashboard?
Google Analytics 4 dashboard template is a tool to help you prepare your marketing reporting based on GA4 data. The reporting dashboard is developed on Power BI and shows all the essential marketing metrics using powerful visualizations. Some of the metrics captured on the Google Analytics 4 reporting dashboard template on Power BI include the total sessions, engagement rates, and total users. The Google Analytics 4 dashboard template also shows the total revenue and conversion rate. Further, you can drill down the report to view traffic source analytics, geographical analytics, page analytics, and economic funnel breakdown.
Why is Google Analytics 4 Reporting Important?
Google Analytics 4 reporting is essential as a tool for capturing all the key events on your websites and apps. GA4 captures event-based data that helps you understand your customers and how they interact with your mobile and web apps. Using the insights from the GA4 reporting dashboard template on Power BI, you get ideas about how to improve user engagement rates and conversion rates by studying the key events.
Benefits of Using Google Analytics 4 Reporting Dashboard
Using the Google Analytics 4 reporting dashboard in Power BI has various benefits, including the following:
Automate your marketing reports efficiently
The Google Analytics 4 dashboard reporting template is free. That means you automate your report without incurring any reporting costs. The dashboard template populates your report in minutes, and when you use our data integration tool, you automate reporting without any coding. The implication is that you save time and money. Using the GA4 dashboard template on Power BI gives you the dual benefits of cost and time efficiency during the preparation of your marketing reports.
Customize the report to suit your specific needs
Our free dashboard template for GA4 is fully customizable. At the very least, you incorporate your brand name and logo on the report. You could even go further to customize how the visualizations look. Most importantly, you can drill down the data to meet specific needs, like showing the insights for a particular app, page, country, or geographical region. Such customization levels are essential in presenting results for business units and divisions.
Simplify how you communicate and collaborate on data
The data volumes captured by GA4 can be intimidating. However, when you use the Google Analytics 4 dashboard report template on Power BI, that data is simplified into informative charts that are easily understood by all your teams. Subsequently, you can collaborate more effectively and make informed decisions. Simplification of data insights through the automated GA4 dashboard reporting template also enhances productivity
Instructions
Google Analytics 4 Power BI Desktop Template
To get started, you will need to:
a) Have access to your Google Analytics 4 (GA4) account
b) Set up a Windsor.ai account.
c) Connect your GA4 property to Windsor.ai.
1. Register
Register to Windsor.ai or login https://onboard.windsor.ai/ if you already have an account on.
2. Connect the GA4 data source
You need to select Google Analytics 4 (GA4) as a Data Source and Grant Access to Windsor.ai.
a) Click on https://onboard.windsor.ai/
b) Click on Google Analytics 4 (GA4) and connect your data.
3. Select Power BI destination
Go to Preview and Destination. Choose “Power BI Desktop (Web)”. Copy your API Key.
4. Download template
Download the template here.
5. Sync your Data
a) Click on the Connect your data button in the yellow ribbon at the top of the template page. Paste your API key and sign in.
b) When prompted, select the authentication method Anonymous.
Here you go!
Google Analytics 4 Power BI Desktop Template
Power BI Desktop
1. Connect your Google Analytics 4 Data to Windsor.ai at https://onboard.windsor.ai/.
Register for free or log in if you already have an account.
2. Choose Google Analytics 4 from the left-side menu, click on Sign in to Google, then follow the steps in the pop-up to sign in and grant the required permissions.
3. Select one Google Analytics 4 account that you’d like to link to the template.
4. Click on Preview and Destination, choose Power BI Web, then copy your API Key.
5. Download the Desktop Template:
Download Power BI Desktop Template: Google Analytics 4 Overview Report
6. When opening the template, on the start screen, paste your API Key from step 4:

Power BI Web Template
1. Connect your Google Analytics 4 Data to Windsor.ai: https://onboard.windsor.ai/.
2. Select one Google Analytics 4 account from the drop-down that you’d like to connect to the template.
3. Click on Preview and Destination, choose Power BI Web in the destinations, then copy your API Key.
4. Install this Power BI Web App template:
Install Power BI Web App: Google Analytics 4 Overview Report
5. Click on Connect your data in this section:

6. Enter your API Key from Step 4:

7. On the next screen, click on Sign In.
Your data should be loading now. Depending on your data size, this may take a minute or two.
FAQs
What is Google Analytics 4?
Google Analytics 4 (GA4) is a tool that captures event-based data from your apps and websites to understand the activity of your users or customers, particularly for e-commerce applications. The platform is characterized by the ability to integrate data across multiple apps and websites. Powerful predictive powers also characterize it, and you can obtain AI insights.
What is Google Analytics 4 used for?
Google Analytics 4 helps you to improve how you engage your users for the improvement of business outcomes, including conversions and revenues. That is possible because GA4 gives you the tools to understand the customers so you can design marketing and sales journeys that result in the best customer experience. When customers get an exceptional experience on your apps and websites, the engagement rates will be higher, and so will the conversion rates.
How much is Google Analytics 4 dashboard template on Power BI?
Using the Google Analytics 4 dashboard template on Power BI is free. You only need to integrate your data into the dashboard, and you may incur minimal data integration costs.
What is Power BI?
Power BI is a data visualization and reporting tool from Microsoft. It helps businesses extract, transform, load, and visualize large datasets. Using Power BI, companies can automate reports through powerful dashboards and storyboards. Power BI has dataflow features that enable you to sync data automatically.
The Power BI Google Analytics 4 dashboard template can be customized with > 500 different dimensions, breakdowns and metrics. Head here to see a complete list: available metrics and dimensions.
It queries the data through our connector and makes it available in real-time.
You might also be interested in…