 AI insights
 About us
 Careers
 Security
 Customer reviews
 Contact us
 Affiliate program
 Solution partners
 Looker Studio templates
 Tableau templates
 Facebook Ads templates
 Google Ads templates
 Data fields & Metrics
 AI prompt library & Guides
 Product documentation
 API documentation
 Case studies
 Blog
Blog Data models
 Windsor vs Supermetrics
 Windsor vs Fivetran
 Windsor vs Portermetrics
Free Google Analytics (GA4) Report Templates & Dashboards
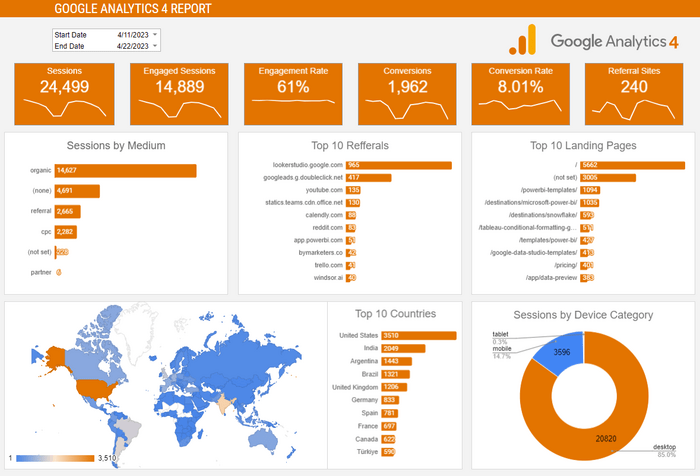
Google Analytics (GA4) is a powerful tool for capturing and visualizing marketing data from your e-commerce platform, website, or mobile application. However, with its 500+ dimensions and metrics, reporting GA4 data can overwhelm many marketers, which is why you need GA4 report builders. Consider using prebuilt GA4 reporting templates to streamline your reporting. Windsor.ai has free Google Analytics dashboard templates that can save you time and enhance your experience when generating data insights.


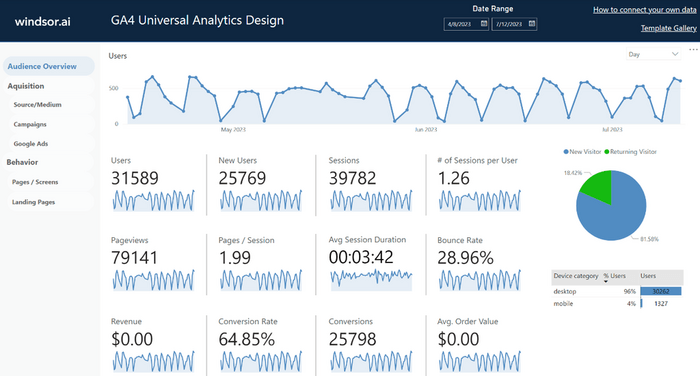
What is Google Analytics (GA4) Marketing Dashboard?
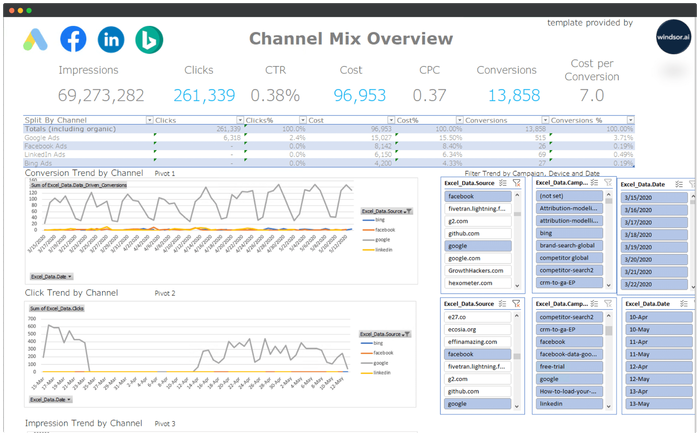
Google Analytics marketing dashboard is a set of reporting templates you can customize when reporting marketing data from your web and smartphone applications. The dashboards are created and designed to simplify the selection and visualization of metrics and dimensions from your data. The dashboards are optimized to tell your data story concisely and impactfully. You can use the marketing dashboards to create reports about different metrics depending on the specific needs of your marketing teams.
Benefits of Using GA4 Dashboards
Using the GA4 dashboard helps you focus on generating insights for intelligent marketing and business decision-making. The GA4 report builders involve carefully selected and sorted performance metrics. Here are some benefits of Google Analytics (GA4) reporting templates:
Time-Saving Express Dashboards
You don’t need to stress over selecting and visualizing key GA4 metrics and dimensions. The express dashboards comprise carefully selected and organized metrics and dimensions. The templates are organized around the major marketing ideas. Use the GA4 express dashboard templates to generate reports quickly and save time.
Real-Time Analytics
Working together with a suitable data integrator, the Google Analytics templates allow you to pull cross-network data into your analytics reports in real-time. The integration makes it possible to populate your marketing reports with updated data. Subsequently, you can use realtime dashboard analytics to make timely marketing decisions.
Automated Reporting
Google Analytics reporting dashboards allow you to automate the creation of marketing reports. With direct links to your dataset, the templates are automatically updated with all your new data and information. Automation of the GA4 report builder means you do not need to spend hours making the same reports every time you need the information.
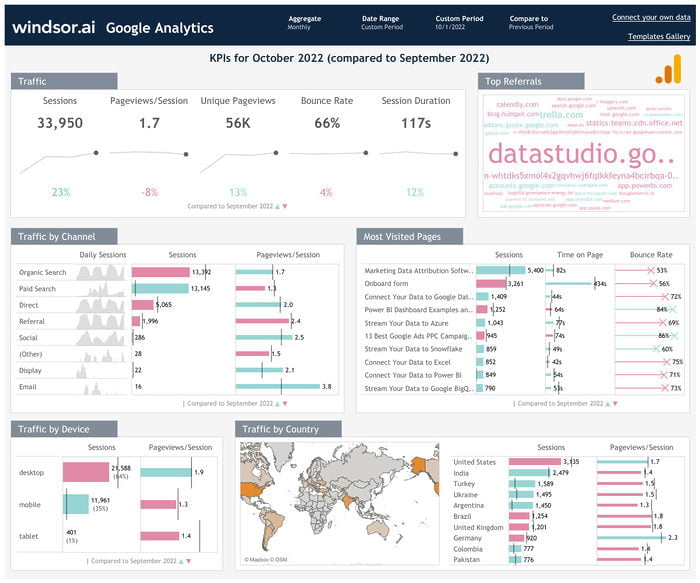
Deeper Marketing Insights with GA4 Gallery
Google Analytics allows you to collate all your marketing report data under one reporting platform. The reporting templates transform the data into insights. They also enable you to deepen your analytics by using the GA4 gallery. Subsequently, you can share your insights with your marketing teams and other parties in your business.
Free of Charge Templates
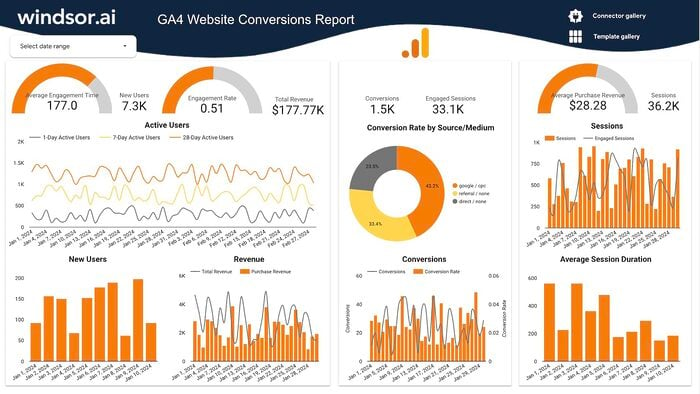
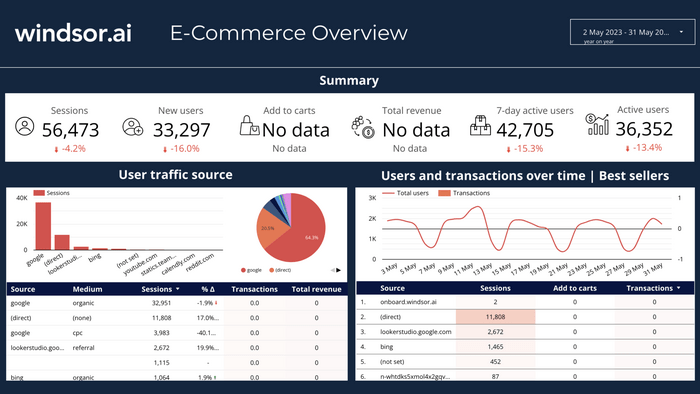
The templates are offered free of charge, just as is the case with the Google Analytics platform. You only need to connect your data to the templates and continue with marketing reporting. You can choose from a variety of report builders to suit your needs. The various GA4 dashboard examples you can choose from are the user engagement dashboard, site content dashboard, e-commerce performance dashboard, and more.
FAQs
What Is Google Analytics?
Google Analytics is a marketing analytics platform developed to help you collate data about the usage of your websites and applications. The platform gathers and analyzes web traffic data, sources of the traffic, the duration of each session, bounce rates, conversion rates, levels of engagement, and other important marketing information. With Google Analytics, you can tell what kind of demographics are visiting your website or using your mobile application and learn how they came across your platforms. You can also learn how they interact with the website or application. For entities that engage in web advertising, Google Analytics helps you measure the success of marketing campaigns against set goals.
What Is GA4 Used For?
GA4 is used to inform marketing strategies for companies in e-commerce and any entity that advertises goods and services on the internet. Using the insights from Google Analytics, a business measures the success of marketing campaigns. E-commerce businesses can also use Google Analytics to learn about prospective customers, develop targeted marketing campaigns, increase web traffic, enhance lead generation, and grow sales and conversion rates.
How Much Does Google Analytics Cost?
Google Analytics is free to use. Google relies on revenues from Google Ads to generate revenue. As you benefit from the analytics insights, you enhance Google’s advertising through Google Ads. Google counts on its Google Ads revenues to continue supporting Google Analytics. However, large businesses may opt for the premium plan, which is paid.
What Are Sessions in Google Analytics?
A session in Google Analytics is the time a visitor spends on an application or website. It begins when the user opens a website or application and ends when the user leaves the platform. Sometimes, the session closes when the application or website times out due to inactivity. Ordinarily, the platform times out within 30 minutes of inactivity.
What Is Cross-Network in GA4?
Cross-network is a feature in Google Analytics that allows you to combine data from multiple advertising networks. Through the cross-network channel, you can integrate data from all your online sources beyond Google Analytics. The feature is important because e-commerce businesses ordinarily place advertisements on multiple networks.
What Is an Engaged Session in GA4?
An engaged session is when the user is active on the mobile application or website. In an engaged session, the user clicks and scrolls through the web pages when interacting with digital content on the website. The engagement involves reading articles, watching videos, and listening to audio files. To qualify as an engaged session, at least one of the following must occur: the user spends at least 10 seconds on the website or application, engages in at least 2 page/screen views, or a conversion occurs, such as through signing up for a newsletter or making a purchase.
Read also:
Looker Studio Templates
Power BI Templates
Excel Dashboard Templates
Google Sheets Templates
Tableau Dashboard Templates
Marketing Templates
Google Ads Dashboard
Meta/Facebook Ads Dashboard
E-commerce Dashboard
Social Media Dashboard
SEO Dashboard