 AI insights
 About us
 Careers
 Security
 Customer reviews
 Contact us
 Affiliate program
 Solution partners
 Looker Studio templates
 Tableau templates
 Facebook Ads templates
 Google Ads templates
 Data fields & Metrics
 AI prompt library & Guides
 Product documentation
 API documentation
 Case studies
 Blog
Blog Data models
 Windsor vs Supermetrics
 Windsor vs Fivetran
 Windsor vs Portermetrics
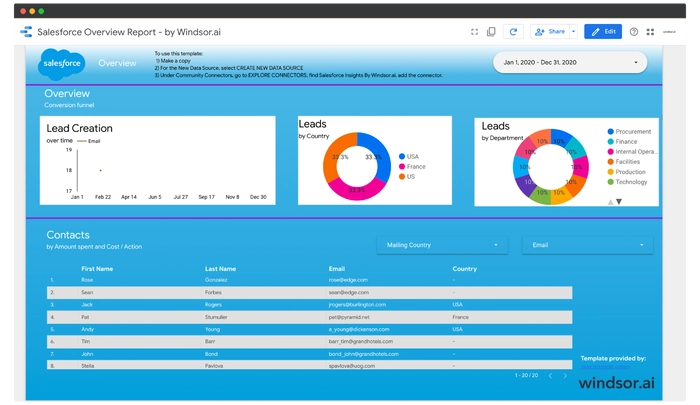
Free Salesforce Dashboard Templates
At Windsor.ai, we strive to make free Salesforce marketing reporting as effortless as possible for our users.
These free and customizable Salesforce templates will assist you in visualizing your data for easy reporting and analysis.
All the Salesforce dashboard report templates have easy-to-follow instructions.
Find the right template from Salesforce’s library and start using them to save time, effort and increase productivity.

Try Windsor.ai today
Access all your data from your favorite sources in one place.
Get started for free with a 30 - day trial.
Why to use a Salesforce dashboard?
Using a Salesforce dashboard provides several key benefits for businesses, particularly those focused on sales and customer relationship management. Here are some compelling reasons to use a Salesforce dashboard:
- Data Visualization: Dashboards present data in a visual format, such as charts, graphs, and tables. This visual representation makes it easier to grasp complex information and identify trends, patterns, and outliers at a glance.
- Customization and Personalization: Salesforce dashboards can be tailored to meet the specific needs and preferences of individual users or teams. This means that each stakeholder can have a personalized view of the metrics that matter most to them.
- Improved Decision-making: By having a clear view of key performance indicators (KPIs) and metrics, sales leaders and teams can make informed decisions about sales strategies, resource allocation, and customer engagement. This leads to more effective sales efforts and better outcomes.
- Efficient Resource Allocation: Dashboards can help in identifying which sales activities or channels are the most productive. This insight enables businesses to allocate resources, such as time and budget, more efficiently towards strategies that yield the highest return on investment (ROI).
- Performance Tracking: Dashboards allow for the monitoring of individual and team performance against set targets and goals. This helps in identifying high-performing individuals or areas that may need improvement, facilitating coaching and development efforts.
- Goal Alignment and Accountability: Salesforce dashboards provide a clear visual representation of progress towards sales goals and targets. This transparency fosters accountability among team members and ensures that everyone is aligned with the organization’s objectives.
- Proactive Issue Resolution: Dashboards can highlight potential issues or bottlenecks in the sales process. This early detection allows teams to take corrective actions before problems escalate and negatively impact performance.
- Streamlined Communication: Dashboards provide a centralized platform for sharing and discussing critical sales data. This helps in aligning teams, facilitating collaboration, and ensuring that everyone is working towards the same objectives.
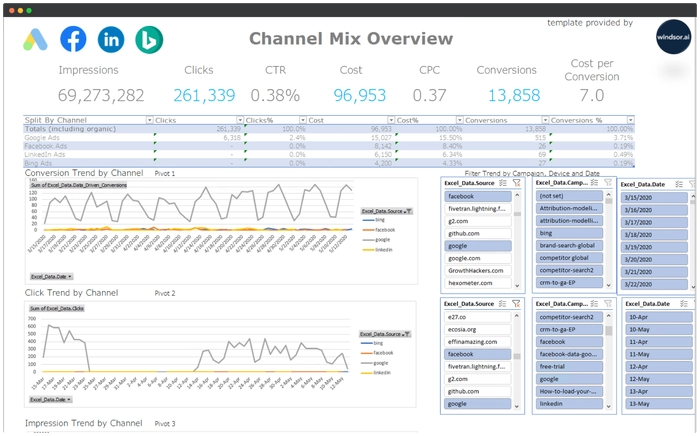
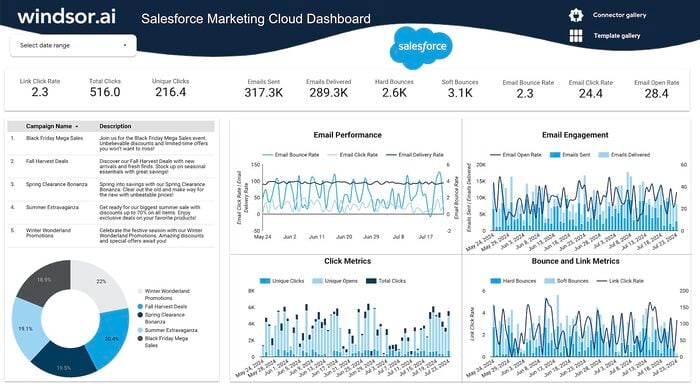
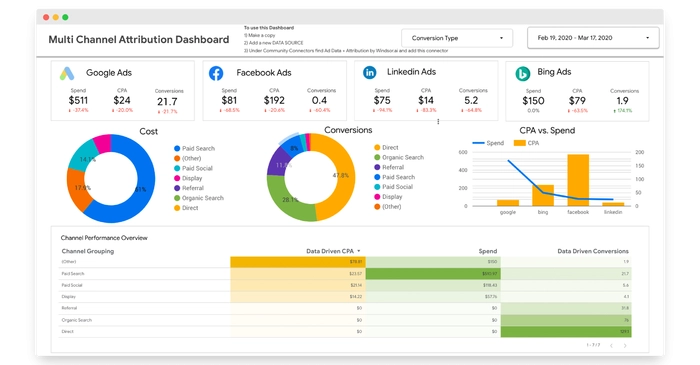
What are Salesforce marketing dashboards used for?
Let’s break it down a bit:
-
Designing Appealing Marketing Campaigns:
- Salesforce marketing dashboards provide a user-friendly interface that allows the marketing team to design visually appealing and effective marketing campaigns. This includes creating and tracking campaigns, managing leads, and analyzing the performance of various marketing initiatives.
-
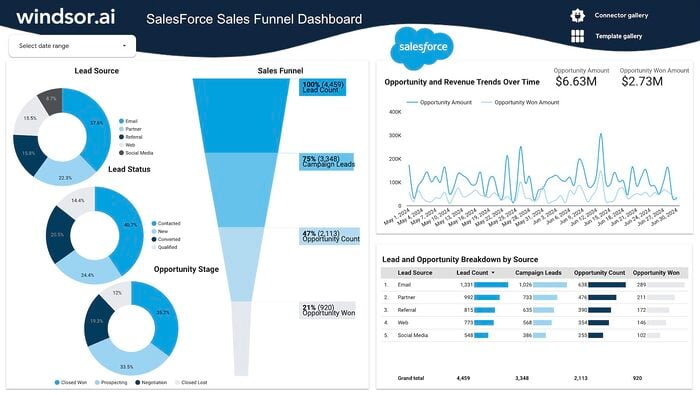
Enhancing Sales Analysis and Insights:
- The dashboards also benefit the sales team by providing tools to analyze data more effectively. This includes insights into customer behavior, lead conversion rates, and other key metrics that can inform sales strategies.
-
Real-time Metrics for Informed Decision-making:
- Salesforce campaign dashboards offer real-time metrics, which means that users can access the most current information about the performance of their marketing campaigns. This enables data-driven decision-making for optimizing ongoing campaigns and planning future ones.
-
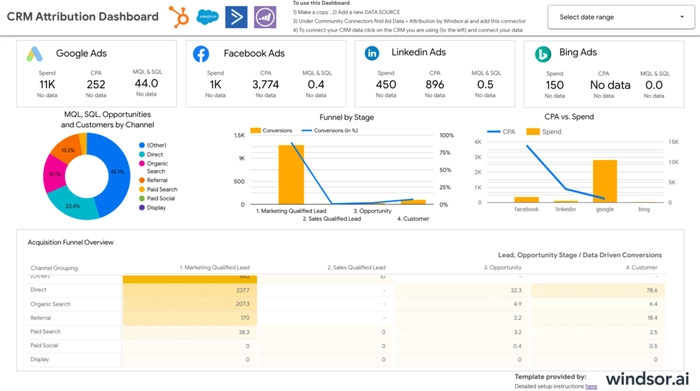
Key Metrics Tracked in Salesforce Campaign Dashboards:
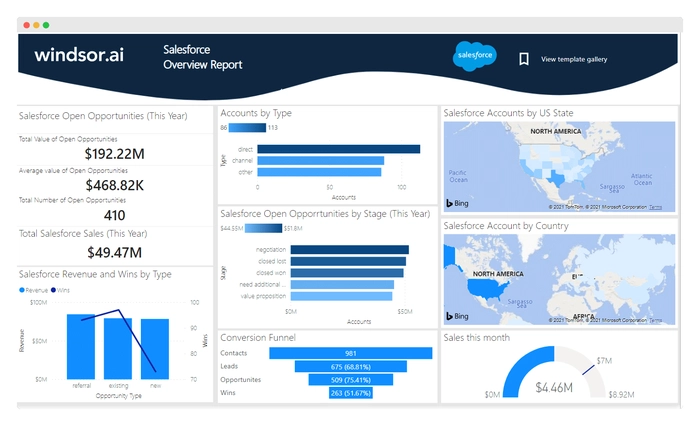
- Open Opportunities by Created Date: Provides insights into when opportunities were created, helping to understand the timing of lead conversions.
- Pipeline Quality Metrics: Measures the overall quality and potential value of the sales pipeline, helping to focus efforts on high-value leads.
- Traditional Funnel Chart: Visualizes the stages of the sales process, showing how leads progress from initial contact to conversion.
- Top Pipeline Customers and Prospects: Highlights the most promising leads and customers in the sales pipeline.
- Closed Won Opportunities by Month: Tracks the number of successful conversions over time, providing a clear view of sales performance trends.
- Pipeline Deals by Close Date and Opportunity Stage: Helps in forecasting future sales and understanding which stages of the sales process need attention.
- Long-term Pipeline Trends: Provides insights into the historical performance of the sales pipeline, helping to identify patterns and trends.
By utilizing these features and metrics in Salesforce marketing dashboards, businesses can optimize their marketing campaigns, improve sales strategies, and ultimately drive better results and ROI from their efforts.