 AI insights
 About us
 Careers
 Security
 Customer reviews
 Contact us
 Affiliate program
 Solution partners
 Looker Studio templates
 Tableau templates
 Facebook Ads templates
 Google Ads templates
 Data fields & Metrics
 AI prompt library & Guides
 Product documentation
 API documentation
 Case studies
 Blog
Blog Data models
 Windsor vs Supermetrics
 Windsor vs Fivetran
 Windsor vs Portermetrics
Free Facebook Page Insights Dashboard Templates
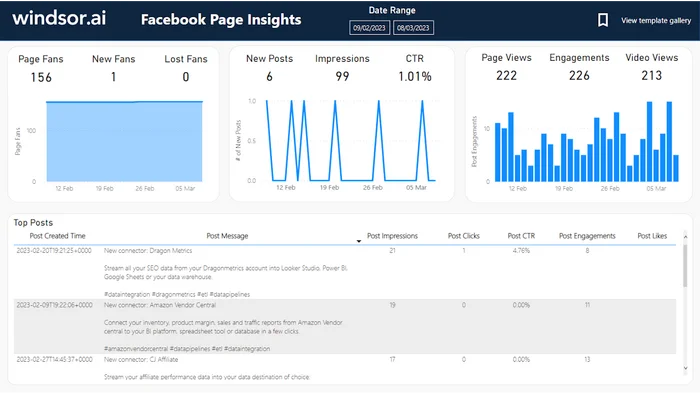
At Windsor.ai, we strive to make free Facebook Page Insights marketing reporting as effortless as possible for our users.
These free and customizable Facebook Page Insights templates will assist you in visualizing your data for easy reporting and analysis.
All the Facebook Page Insights dashboard report templates have easy-to-follow instructions.
Find the right template from Facebook Page Insights’s library and start using them to save time, effort and increase productivity.
You can find more information about Facebook Page Insights Connector here.


Try Windsor.ai today
Access all your data from your favorite sources in one place.
Get started for free with a 30 - day trial.
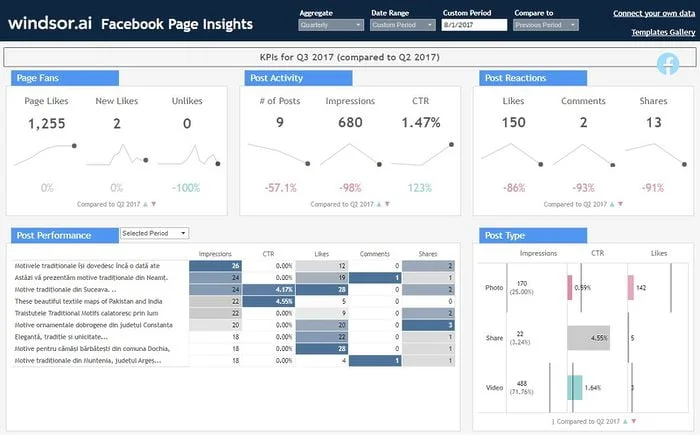
What are the key Facebook Page metrics to track and what do they mean?
Facebook Insights reports provide all the information about how your page is performing. It allows you to blend data from multiple data sources, for instance, demographic data and post engagement, to gain valuable insights into the behavior of the users on your Facebook pages.
However, at the page level, we must select critical variables from many different metrics within the same period to ensure we see meaningful data within a particular date range.
These critical metrics for generating a Facebook insights template are:
- Impressions and reach
- Page and post engagement
- Page likes follow, and demographics
- Reporting video statistics
These metrics will allow us to generate a new report template with content filtered by post name.
Impressions and reach
Impressions are the number of times a post appears in someone’s timeline that is equal to or more than the reach number.
Why should you track post impressions in Facebook insights?
Because the more times users view your content, the more interesting it becomes to them.
Repeated and viral impressions indicate that someone viewed it more than once in their feed or, much better, returned to find the post or your page again.
However, the reach is something different.
At the post level, it shows you how many unique users visited your post or page. This covers organic, paid, and viral reach.
When combined with other metrics such as impressions, Reach informs you if your posts or page are reaching your targeted audience.
For example, a post may get ten impressions but just one reach. As a result, you may presume that for that particular post, only 10% of the people were particularly interested in your brand.
This means the content you are creating is not well-suited to your audience, and you need to revise your strategy.
Page and post engagement
Engagement is the umbrella word for all user interactions with a post or a page. This includes, but is not limited to, all responses, post clicks, post shares, comments, profile clicks, and more.
Engagement shows how well the target audience receives a post or page. The more a post is interacted with, the more likely it is to appear in the newsfeed of your fans.
The total engagement counts, along with the breakdowns by type of engagement (angry, sad, love, laughing, comment, like, save, etc.), show how people react to your posts.
Thus, page analytics in an insights report template summarizes people’s positive and negative actions, sorted by post name.
Page likes, follows, and demographics
Page likes and follower numbers are one of the very first metrics for a Facebook Page.
These metrics demonstrate how keen someone is to keep in contact with your brand. Likes are a good sign, but getting followed matters because it makes your content visible to a larger audience.
A significant number of likes and followers tends to create more organic post engagement. This gives you a better in into paid marketing when using custom dimensions to set your target audience metrics according to the demographic of your followers.
Follower count is perhaps one of the essential metrics when designing your Facebook insights template. It’s an excellent data source for knowing your audience.
That will allow you to customize your content better according to their needs. The demographics of your target audience are a crucial part of developing your brand’s social media personas.
Plus, being able to build an engaging community through targeted content will lead to an organic increase in your Facebook page fans.
Reporting video statistics
Most of the post-engagement metrics described above also apply to video posts. However, there are two specific Facebook video metrics to analyze that can give you even more information about the performance of your page.
- Video views: The number of people who watched your video for three seconds or more.
- Audience retention: It tells you how long you maintained your audience’s attention in the total duration of a video.
These metrics will inform you about your video’s popularity with your audience and if you should spend more time creating similar content.