 AI insights
 About us
 Careers
 Security
 Customer reviews
 Contact us
 Affiliate program
 Solution partners
 Looker Studio templates
 Tableau templates
 Facebook Ads templates
 Google Ads templates
 Data fields & Metrics
 AI prompt library & Guides
 Product documentation
 API documentation
 Case studies
 Blog
Blog Data models
 Windsor vs Supermetrics
 Windsor vs Fivetran
 Windsor vs Portermetrics
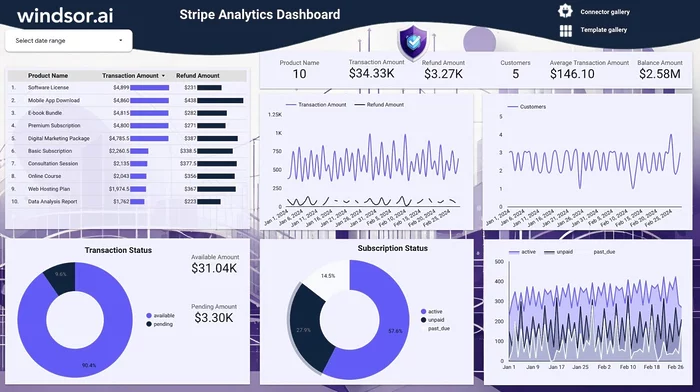
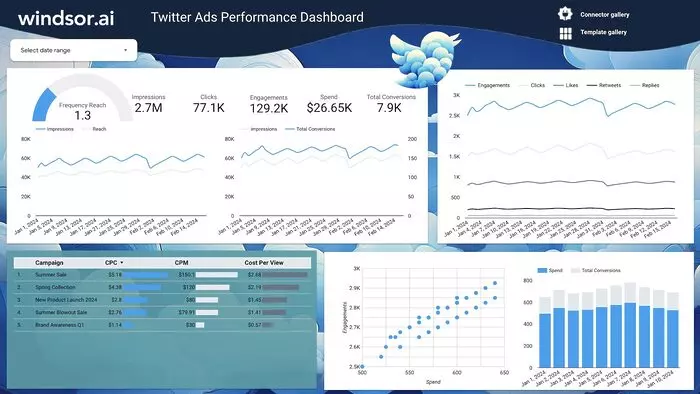
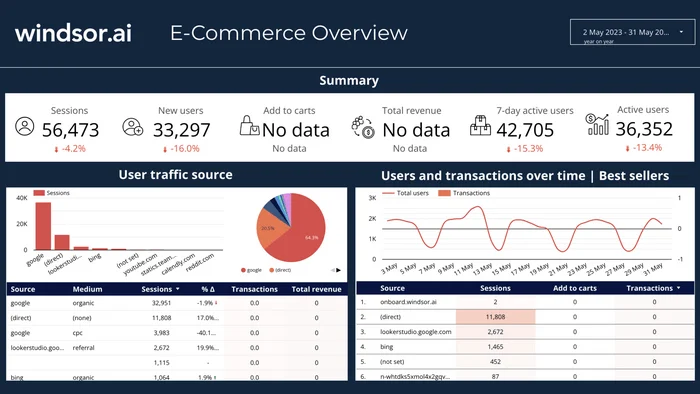
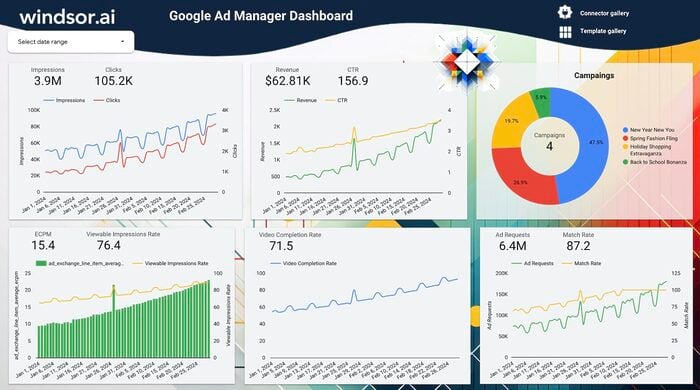
Free Sales Dashboard Templates
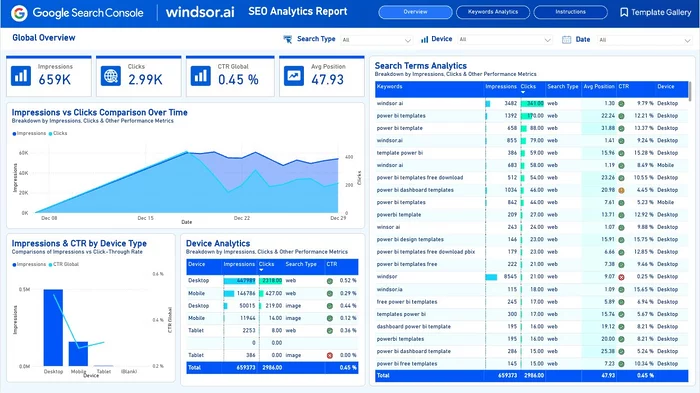
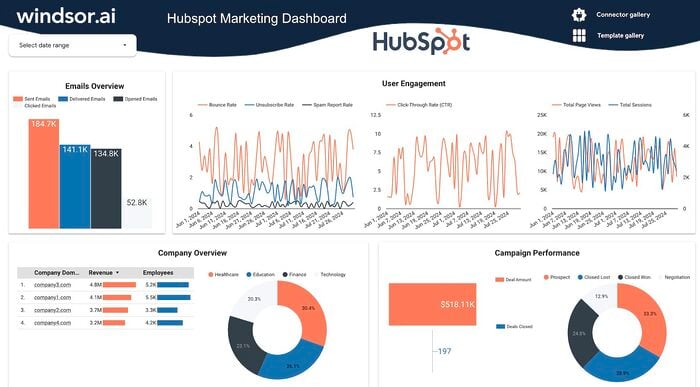
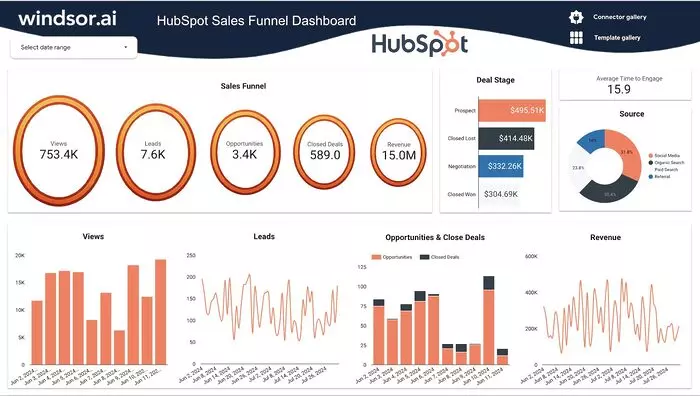
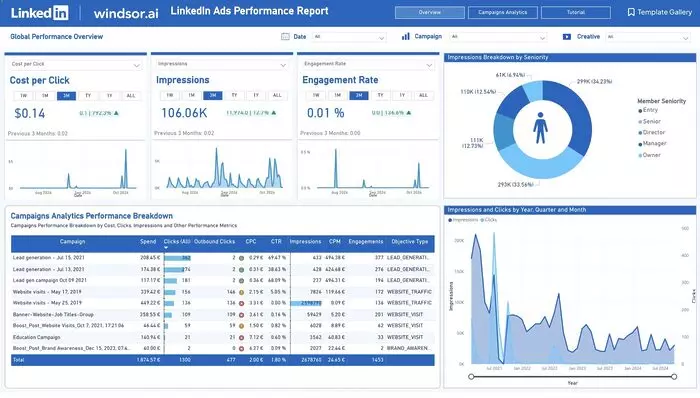
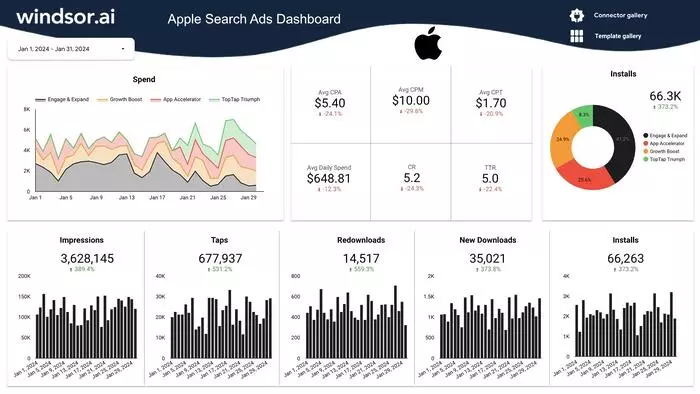
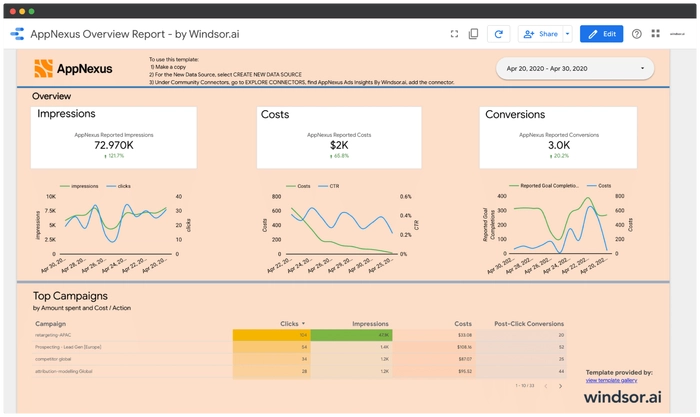
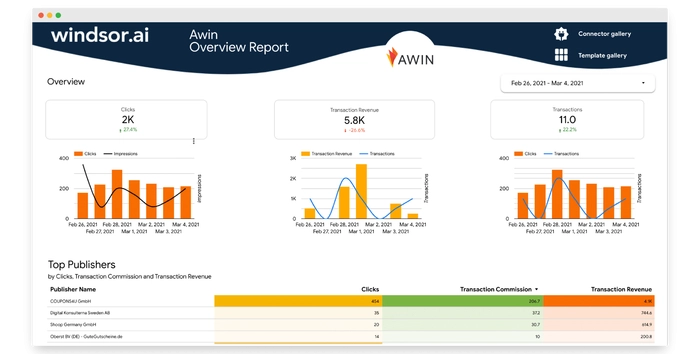
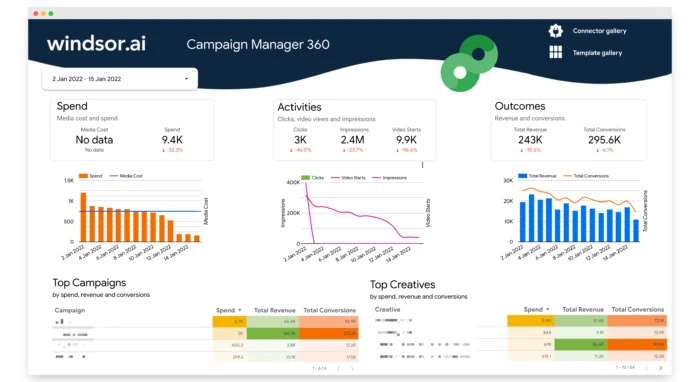
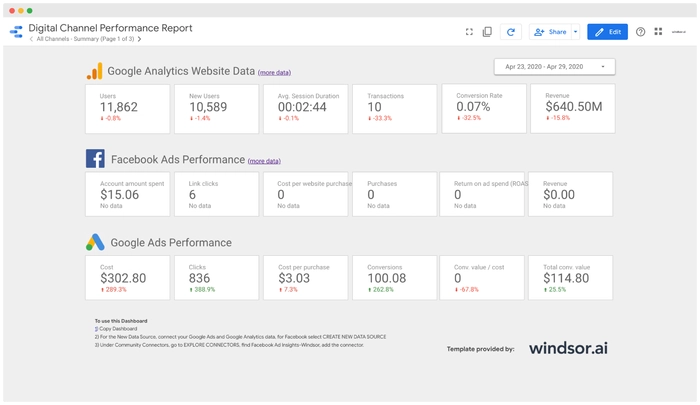
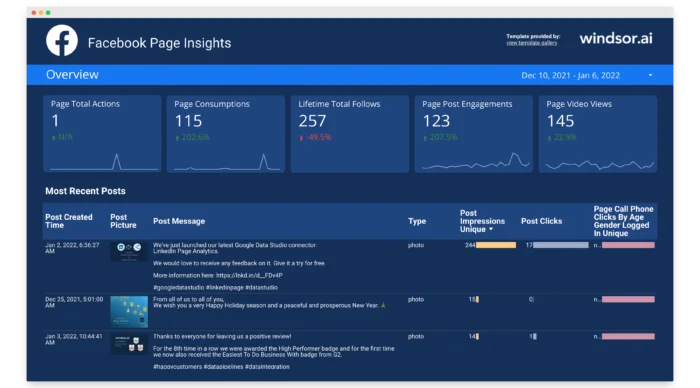
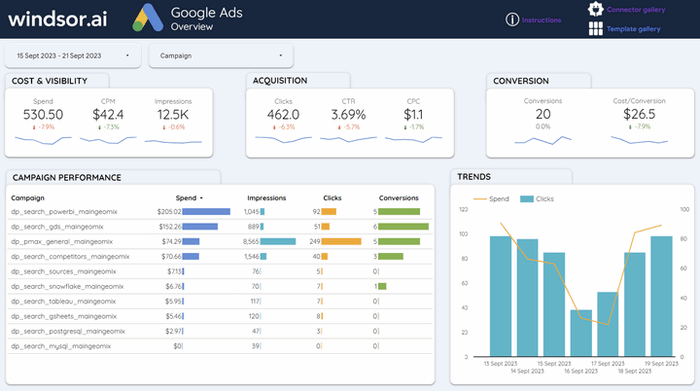
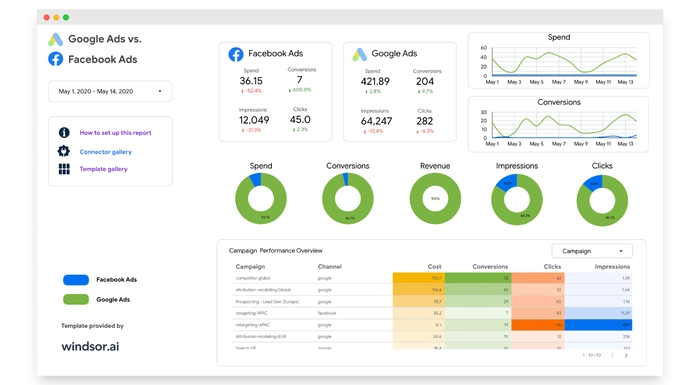
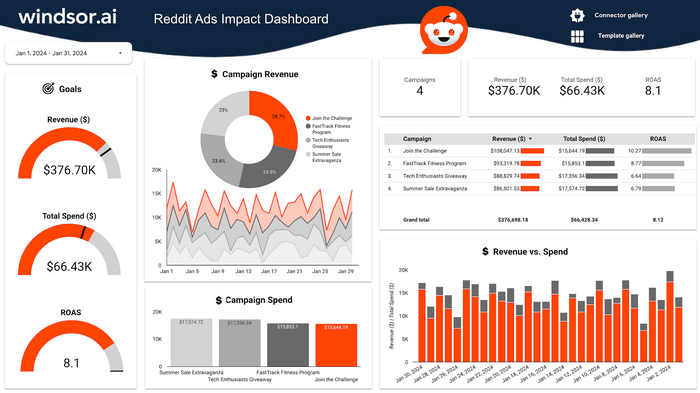
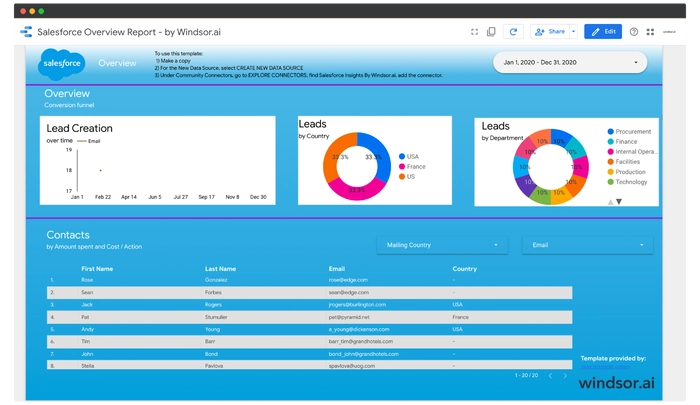
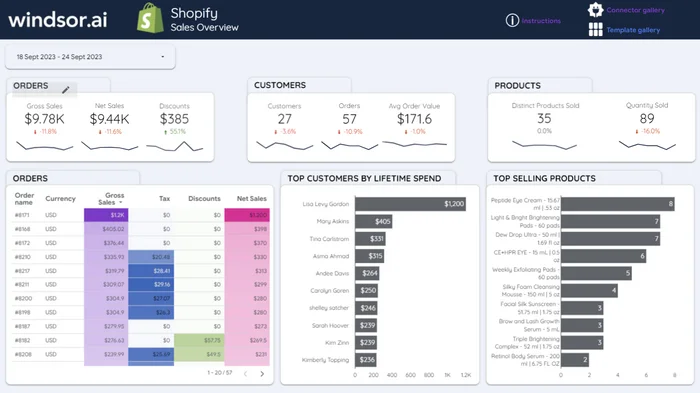
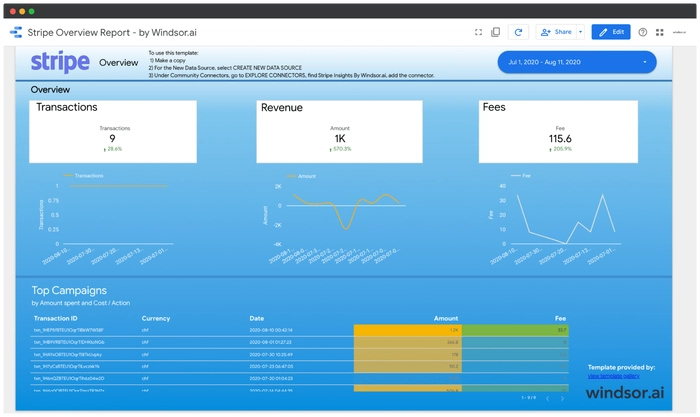
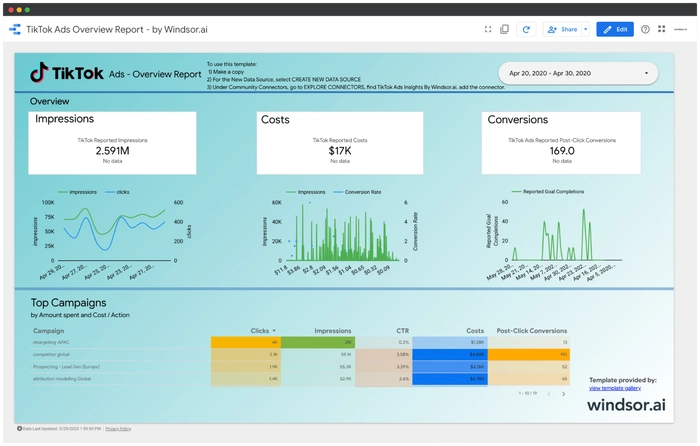
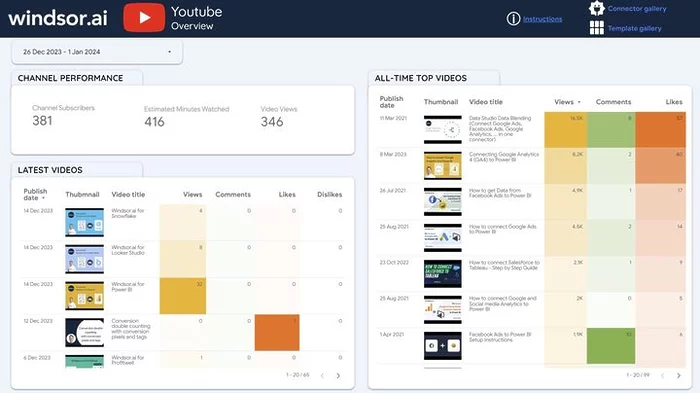
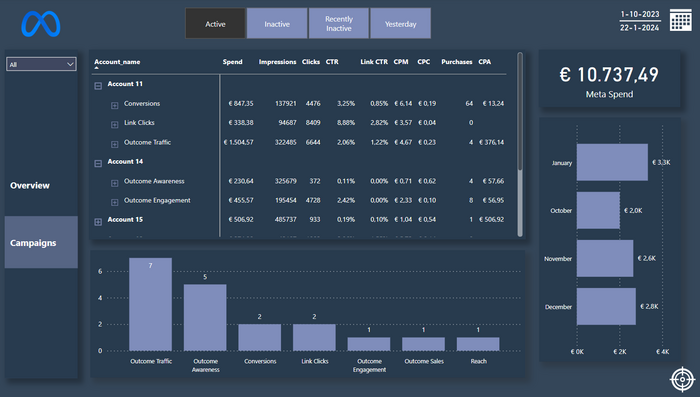
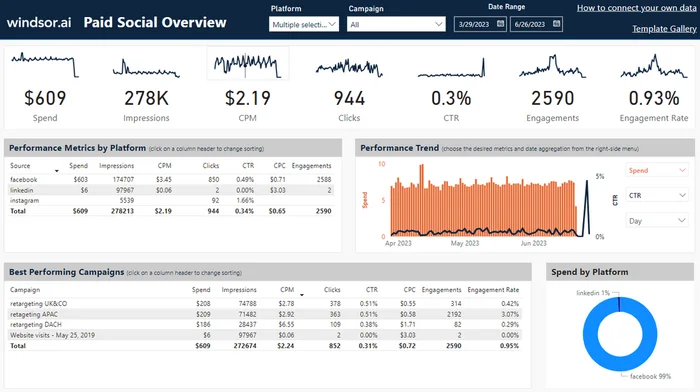
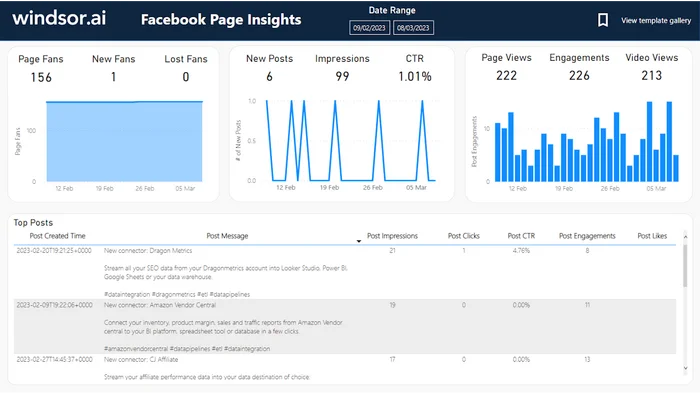
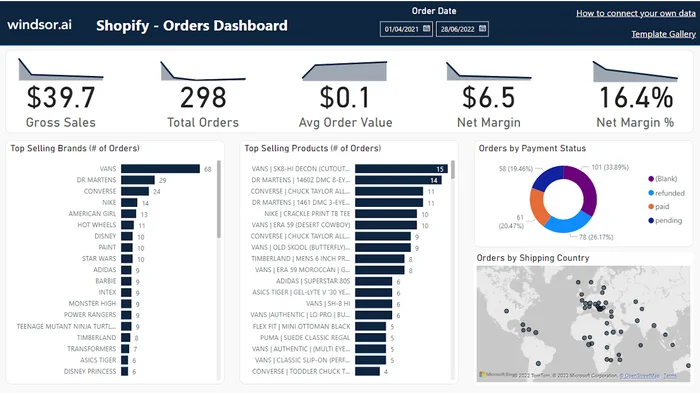
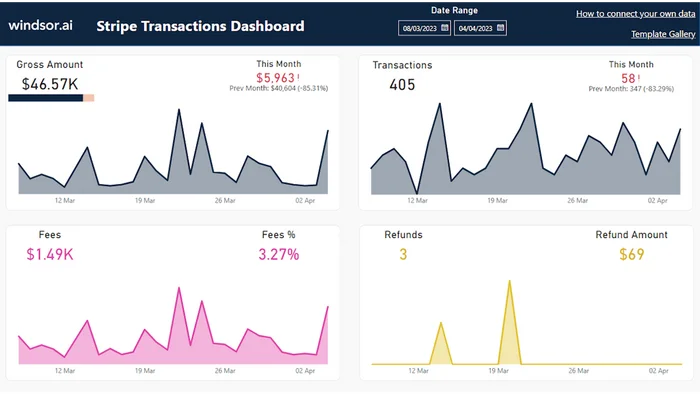
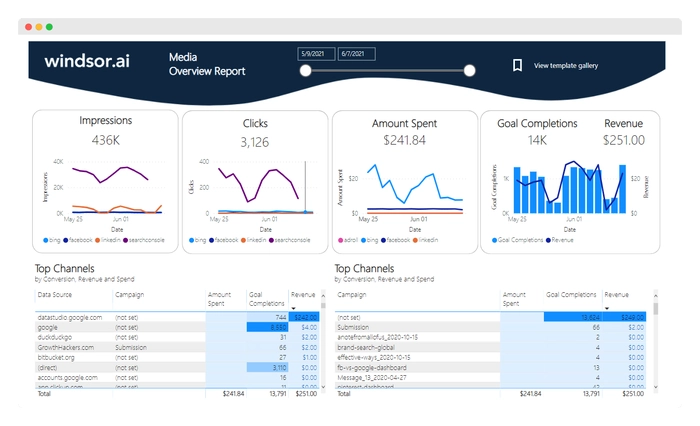
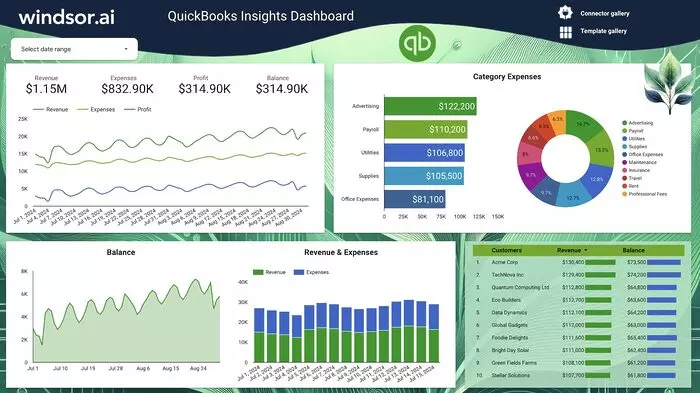
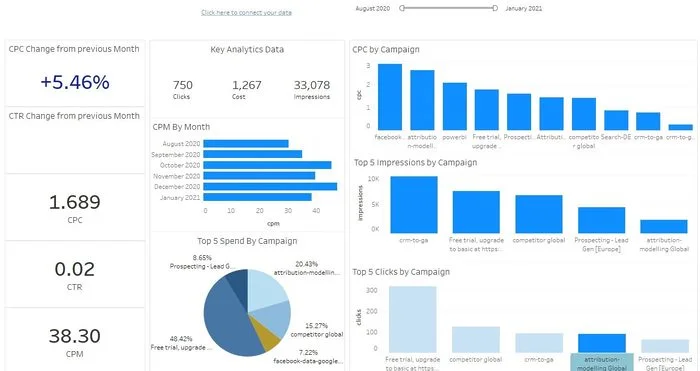
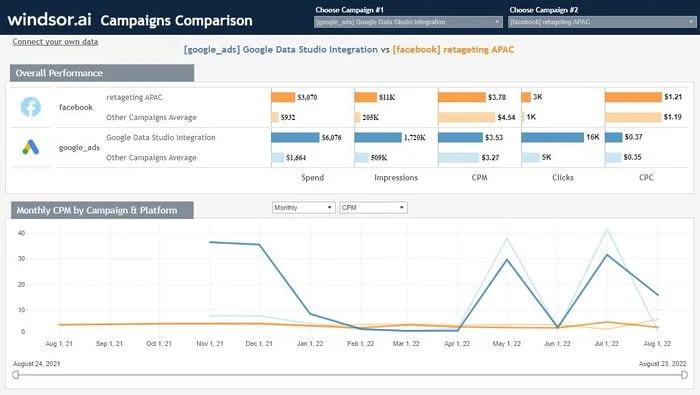
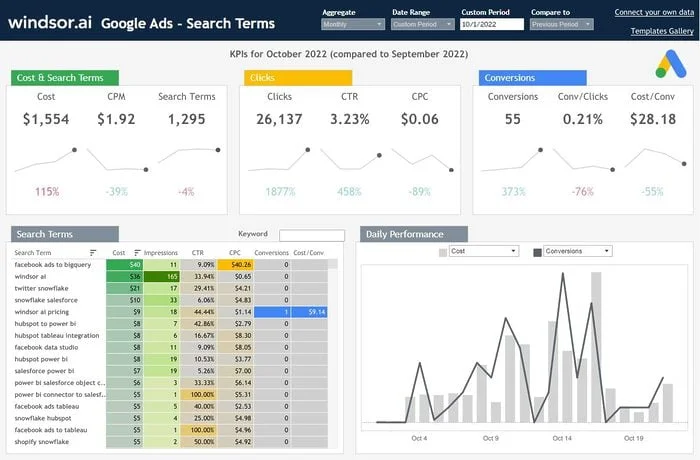
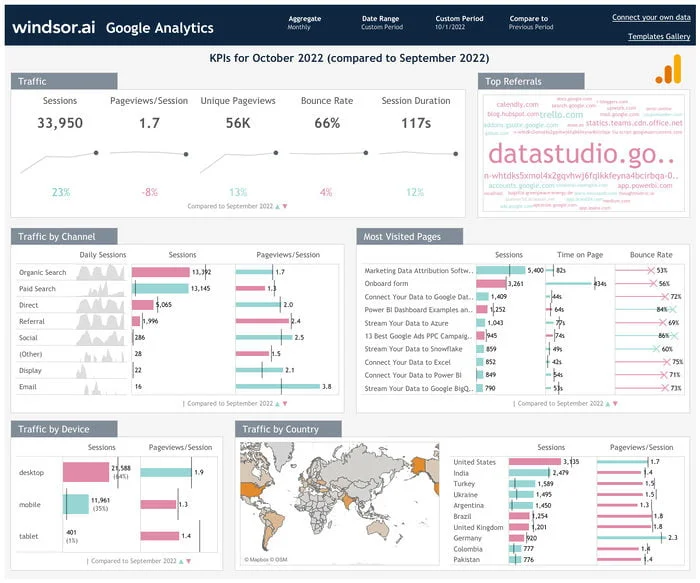
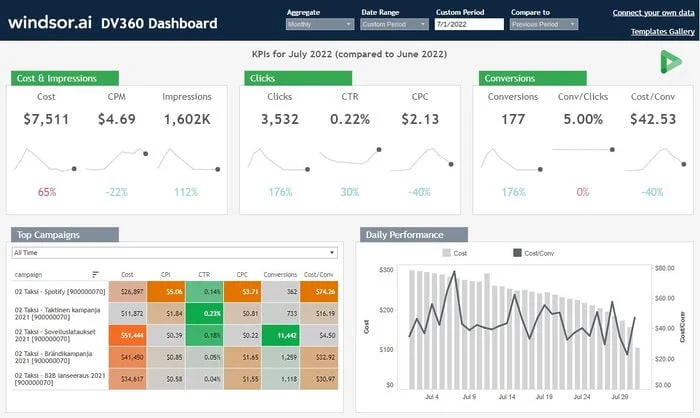
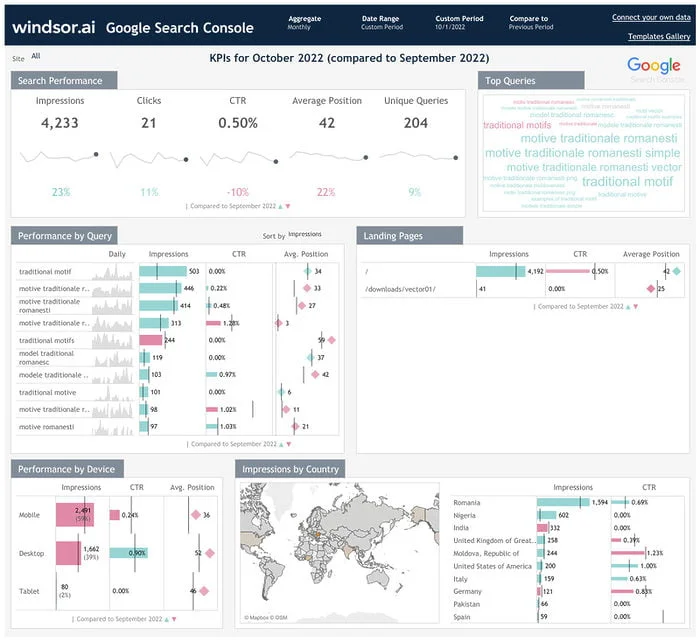
At Windsor.ai, we strive to make your sales reporting effortless and effective. For this, we offer a vast library of free sales dashboard templates that will help you refine your marketing & sales strategy while maximizing your return on investments.
Each template provides simple, step-by-step setup instructions, allowing you to connect your data in just a few clicks without complex configurations.
Browse our available sales dashboards below, select a suitable template based on your use case, and easily customize it to align with your data analytics needs and business goals.


Try Windsor.ai today
Access all your data from your favorite sources in one place.
Get started for free with a 30 - day trial.
The main benefits of Windsor.ai’s sales dashboards
Quick performance evaluation
Our sales dashboards feature a well-thought-out user interface that allows you to visualize and measure important sales data quickly and accurately. They provide a convenient way for sales managers and business owners to assess key metrics, identify challenges, and gain a comprehensive overview of sales performance.
Real-time insights
Windsor.ai’s sales dashboards generate real-time updates on all crucial sales metrics, informing the team and stakeholders of the latest results. This facilitates rapid responses to changing conditions and enables timely strategic adjustments.
Improved decision-making
Well-organized data in our sales dashboards enables sales managers to extract data-driven insights into trends, opportunities, and challenges, leading to smarter decision-making.
Extensive customization
You can easily customize Windsor.ai’s sales dashboard examples to your business’s specific needs and priorities. This powerful feature allows you to track KPIs relevant to success in your niche, whether in retail, software development, or real estate.
Enhanced accessibility
Our sales dashboards are adaptable to various devices, so you can access them anytime and anywhere to monitor sales performance, even while on the go, to stay connected and take timely action.
Time savings through automation
Professional sales dashboards by Windsor.ai automate data collection and formatting, eliminating the need for manual effort. By automating these processes, your sales teams can save time and concentrate on strategic decision-making and revenue growth.
FAQs
What is a sales dashboard?
A sales dashboard is the visual representation of your key sales performance metrics and other essential data in a BI tool or spreadsheet. It organizes complex information into an intuitive, easy-to-understand format, allowing you to quickly unlock actionable insights without diving deep into the raw data.
For example, with Windsor.ai’s sales dashboard templates, your sales representatives can easily track the following sales KPIs:
- The average amount of time callers
- The revenue generated by each representative
- The percentage of abandoned calls
- The number of dials made by each representative per hour, and other critical metrics.
Sales performance dashboards can benefit the entire sales team, including everyone from sales management to operations and individual account executives, ensuring everyone stays informed and can make data-driven decisions.
You can easily configure Windsor.ai’s free sales dashboards to gain real-time insights into your sales funnel and overall business operations. Our templates are designed to help you make smarter revenue forecasts, identify top-performing sales representatives, and uncover areas that need improvement.
What data should I include in sales reporting dashboards?
Various factors can help you determine what metrics you should include in your sales dashboard. Some of the things you should consider:
- Your industry
- Sales type
- Company size
- Specific goals, etc.
The chosen metrics can evolve based on your current objectives, company offerings, and individual sales goals. This flexibility is essential in sales representative dashboards, allowing for seamless tracking of both personal and overall performance.
To identify additional components for your sales performance dashboard, you should also answer the following questions:
- Which metrics and data points consistently appear in your reports?
- Are there specific metrics emphasized in sales team meetings or individual reviews?
- What are your core KPIs, and how do they align with overall business goals?
- Do you have multiple sales teams with unique goals?
Here’s a quick breakdown of the most common sales metrics.
Key big-picture metrics
- General sales
- Pipeline performance
- Forecasts
- Competitor analysis
- Product performance
Detailed metrics & KPIs for deeper insights
- Leads by source
- Open cases
- Open opportunities
- Open activities (calls, demos, visits)
- Closed opportunities
- Sales cycle duration
- Pipeline stages
- Win/loss rate
- Product gaps
- Deals won vs. deals lost
- Number of emails, meetings, and calls per week
- Average time to close a deal
- Deals leaderboard showcasing top-performing sales representatives
How much do the Windsor.ai sales reporting dashboards cost?
All our sales reporting templates are completely free! Pricing depends only on the number of connectors, accounts, and destinations you use.
How do I create a good sales dashboard?
Different businesses take unique approaches to creating their sales dashboards.
Below is a quick guide to help you create a sales dashboard that effectively visualizes key metrics, empowers data-driven decision-making, and enhances overall sales performance analysis within your organization:
- Identify key sales metrics
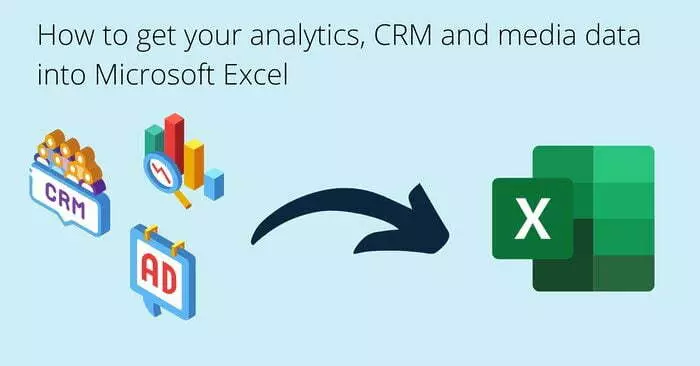
- Locate data sources: This could be data from your Customer Relationship Management (CRM) system, spreadsheets (Excel, Google Sheets), marketing automation platforms, or other business apps like HubSpot or Salesforce. Windsor.ai allows you to aggregate data from 325+ data sources and stream it to various destinations for further representation and analysis.
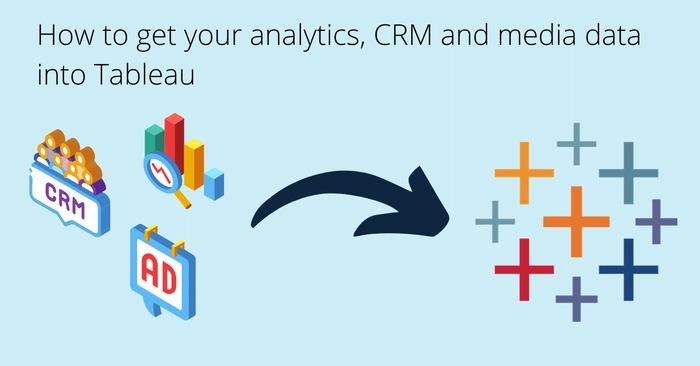
- Choose the data visualization platform & BI tool: Consider factors such as ease of use, customization options, integration capabilities, and scalability. Windsor.ai enables seamless integration with popular BI tools like Tableau, Power BI, and Looker Studio.
- Pull data into the dashboard by applying the necessary filters (visualize only the data that matters)
- Choose a visual representation format
- Customize dashboard layout
- Share the report with others
What are some sales dashboard examples?
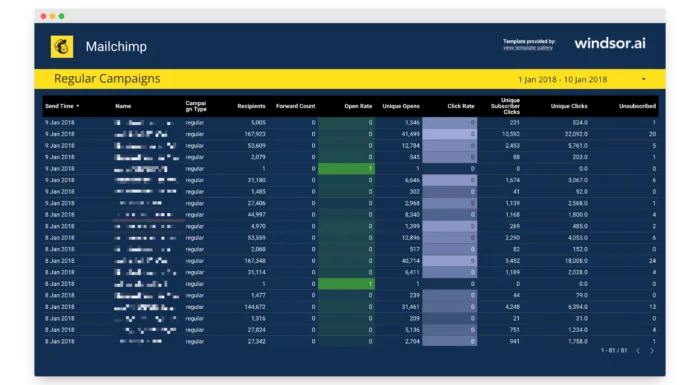
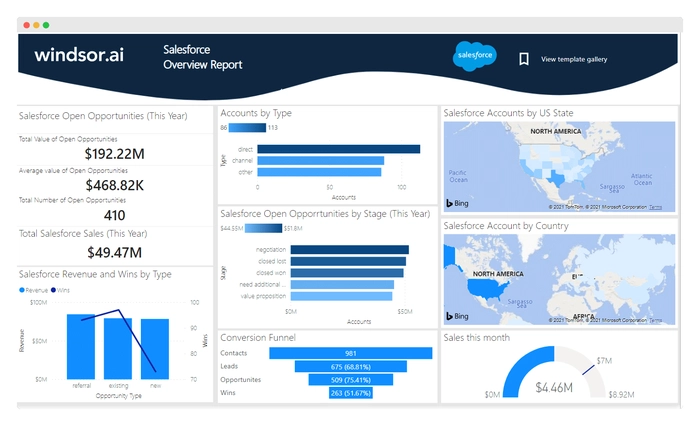
- Sales overview dashboard template
- CRM dashboard template
- Sales analysis dashboard template
- Sales performance dashboard template
- Sales activity dashboard template
- Sales pipeline dashboard template
- Sales conversion dashboard template
- Individual sales rep dashboard template
- Sales leaderboard dashboard template
- KPI dashboard template for sales
- Win/loss dashboard template