 Destinations
 Data sources
 AI insights
 About us
 Careers
 Security
 Customer reviews
 Contact us
 Affiliate program
 Solution partners
 Template gallery
 Looker Studio templates
 Power BI templates
 Excel templates
 Google Sheets templates
 Tableau templates
 Facebook Ads templates
 Google Ads templates
 Data fields & Metrics
 AI prompt library & Guides
 Product documentation
 API documentation
 Case studies
 Blog
Blog Data models
 Windsor vs Supermetrics
 Windsor vs Funnel.io
 Windsor vs Fivetran
 Windsor vs Rivery
 Windsor vs Portermetrics
 Windsor vs Coupler.io
 Last updated: 8 October 2026




This Facebook Ads vs Google Ads Report template for Power BI Desktop helps to visualize your marketing performance data in one single place. If you are working for your agency, this Power BI template will help you to save time. The target audience for agencies is clients. For internal teams, this dashboard helps with a high-level overview of the marketing performance. To get more granular data, additional columns can be loaded. By default, the template contains paid and non-paid data and contains an overview of the most commonly used channels.
You can easily compare your Google Ads vs Facebook Ads performance using different metrics and conversion data in this Power BI Facebook Ads vs Google Ads Report, like:
- Campaign
- Clicks
- Impressions
- Spend
- Date
- Sessions
- Conversions (as reported by Facebook Ads, Google Ads)
- Revenue (as reported by Facebook Ads, Google Ads)
- Optional: Any metrics or dimensions from our field list
It queries the data through our connector and makes it available in real-time. Follow the steps outlined below to connect your data.
To get started
1. Connect your Google Ads and Facebook Ads data to Windsor.ai here
- Register or log in if you already have an account.
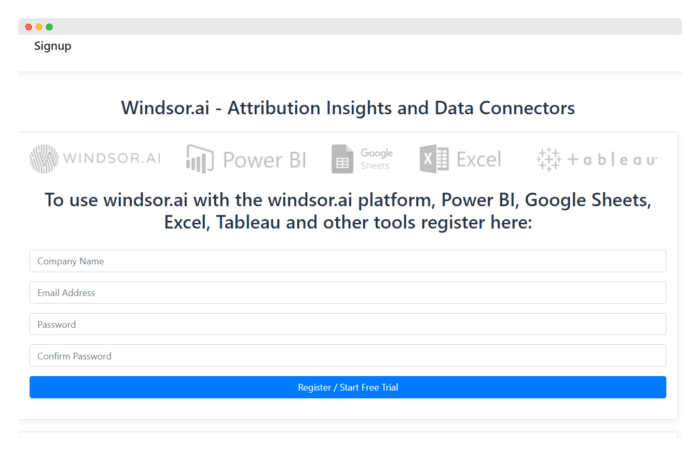
- Select both Facebook Ads and Google Ads accounts from the dropdown and remember to grant access.


- In the “Select destination” tab select Power BI and copy your API Key.

The template is available both as
- Power BI Web Template App
- Power BI Desktop Template
Power BI Web Template
2a. Install Power BI Web App: Google Ads vs Facebook Ads Report
- Click “Connect your data” on the top of the page, on the yellow background

- Enter your API key which you can get here. You can change the date range as well.

- On the next screen click on Sign In

- Your data should be loading now. Depending on your data size this may take a minute or two. Click on the Report tab and view your data.
Power BI Desktop
If you would like to explore how the template on the Power BI desktop you can also download the latest version of the dashboard template in .PBIT format.
- After completing the process of registering and connecting your data from Step 1
2b. Download Power BI Desktop Template: Google Ads vs Facebook Ads Report
- In the template on the start screen, paste your API Key from Step 1 like here
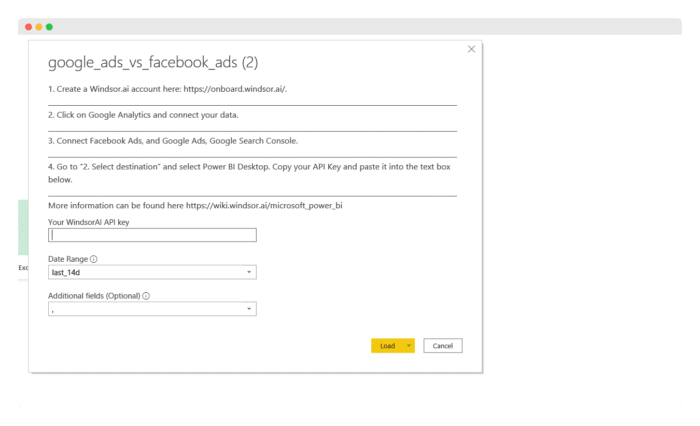
- Your data should be loading now. Depending on your data size this may take a minute or two.
Important: You will need to change the fields to their types (e.g. date, decimals, whole numbers, …) to use them in aggregations (sums, averages, …) or date filters. For users in Europe and other countries where a comma is used for decimals please change the locale of the data to English.


