 AI insights
 About us
 Careers
 Security
 Customer reviews
 Contact us
 Affiliate program
 Solution partners
 Looker Studio templates
 Tableau templates
 Facebook Ads templates
 Google Ads templates
 Data fields & Metrics
 AI prompt library & Guides
 Product documentation
 API documentation
 Case studies
 Blog
Blog Data models
 Windsor vs Supermetrics
 Windsor vs Fivetran
 Windsor vs Portermetrics
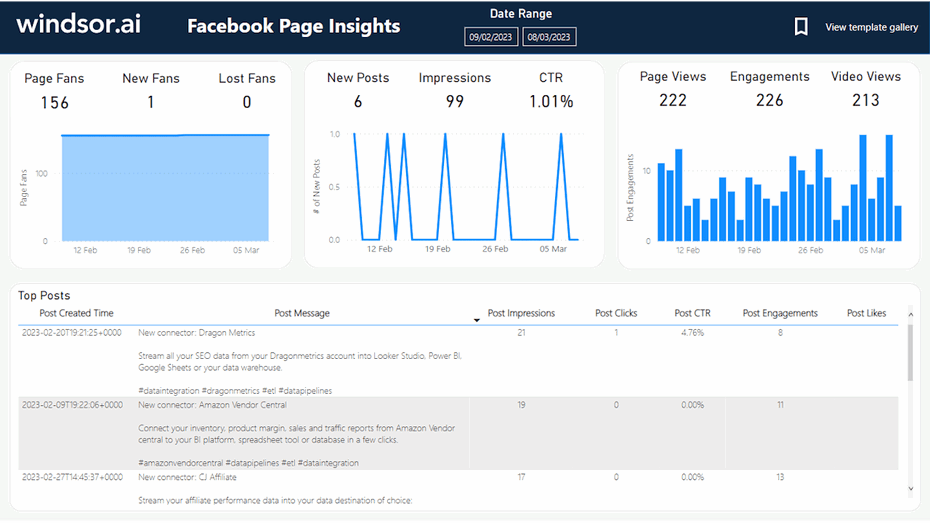
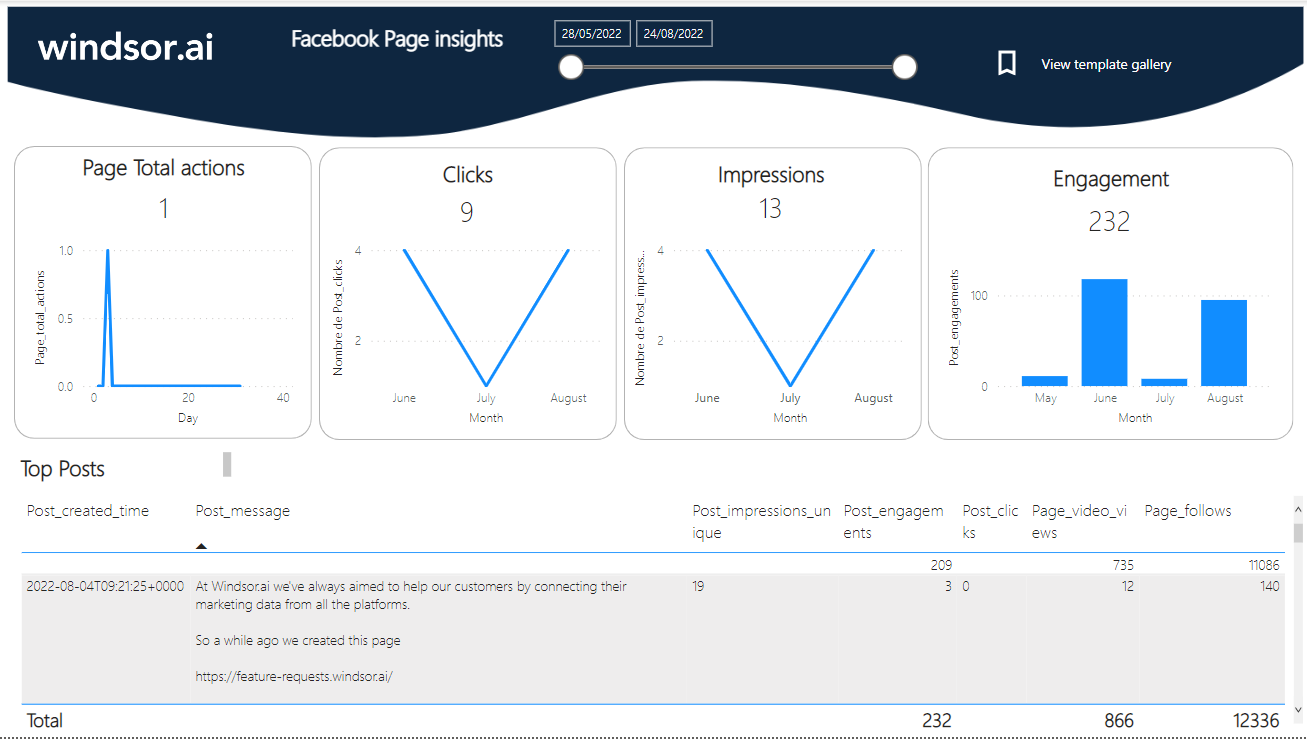
This Facebook Page Insights Dashboard Report Template for Power BI helps you to visualize your own Facebook Page data in Power BI in a few clicks.
Follow the steps outlined below to get your data connected.
The template is available both as
Power BI Web Template
- Connect your Facebook Page Data to Windsor.ai
Register for free or login if you already have an account.
- Choose Facebook Page (Organic) from the left-side menu, click on “Grant Facebook page Access” then follow the steps in the pop-up to sign-in and grant the required permissions.
- Select at least one Facebook Page from the drop-down.
- Click on Preview and Destination, choose Power BI Web, then copy your API Key.
- Install the Power BI Web App
Install Power BI Web App: Facebook Page Insights Overview Dashboard
- Click on Connect your data in the upper section of the dashboard.

- Enter your API Key from Step 4.

- On the next screen click on Sign In
- Your data should be loading now. Depending on your data size this may take a minute or two.


Power BI Desktop
- Connect your Facebook Page Data to Windsor.ai
Register for free or login if you already have an account.
- Choose Facebook Page (Organic) from the left-side menu, click on “Grant Facebook page Access” then follow the steps in the pop-up to sign-in and grant the required permissions.
- Select at least one Facebook Page from the drop-down.
- Click on Preview and Destination, choose Power BI Web, then copy your API Key.
- Download the Desktop Template
Download Power BI Desktop Template: Facebook Page Insights Dashboard Report
- When opening the template, on the start screen, paste your API Key from step 4:

Power BI Facebook Page Dashboard Template: metrics and dimensions
Below are the predefined metrics and dimensions available in the template. However, you can any other field you need in the connection string.
Dimensions:
- Date
- Post Timestamp
- Post Message
- Post Type
Metrics:
- Page Fans
- New Fans
- Lost Fans
- New Posts
- Impressions
- CTR
- Page Views
- Engagements
- Video Views
- Post Impressions
- Post Engagements
- Post Clicks
- Post CTR
- Post Likes
The Power BI Facebook Page dashboard template can be customized with > 50 different dimensions, breakdowns and metrics. Head here to see a complete list: available metrics and dimensions.
It queries the data through our connector and makes it available in real-time.
Why is it important to build a Facebook Page Insights dashboard?
With a Facebook Page Insights Power BI dashboard, you can better cater to the business needs of your Facebook page/s.
It is a great tool that measures page-level and post-level actions such as post reactions, net likes, comments, positive feedback, viral reach, etc.
You can create an Insights dashboard and generate a Power BI report, then share it across your organization.
How to Interpret Facebook Insights?
Facebook Insights reports provide all the information about how your page is performing. It allows you to blend data from multiple data sources, for instance, demographic data and post engagement, to gain valuable insights into the behavior of the users on your Facebook pages.
To efficiently track post reach, you must link your Facebook Insights to your Power BI dashboard through partner connectors.
What are the key Facebook metrics to track and what do they mean?
There are many Facebook metrics for a page, such as comments, net likes, post reactions, etc.
However, at the page level, we must select critical variables from many different metrics within the same period to ensure we see meaningful data within a particular date range.
These critical metrics for generating a Facebook insights template are:
- Impressions and reach
- Page and post engagement
- Page likes follow, and demographics
- Reporting video statistics
These metrics will allow us to generate a new report template with content filtered by post name.
This is your Facebook insights Power BI template, also known as your Facebook Analytics report template. We can use it to see how each post performs proportional to the number of people it reached.

Try Windsor.ai today
Access all your data from your favorite sources in one place.
Get started for free with a 30 - day trial.
Impressions and reach
Impressions are the number of times a post appears in someone’s timeline that is equal to or more than the reach number.
Why should you track post impressions in Facebook insights?
Because the more times users view your content, the more interesting it becomes to them.
Repeated and viral impressions indicate that someone viewed it more than once in their feed or, much better, returned to find the post or your page again.
However, the reach is something different.
At the post level, it shows you how many unique users visited your post or page. This covers organic, paid, and viral reach.
When combined with other metrics such as impressions, Reach informs you if your posts or page are reaching your targeted audience.
For example, a post may get ten impressions but just one reach. As a result, you may presume that for that particular post, only 10% of the people were particularly interested in your brand.
This means the content you are creating is not well-suited to your audience, and you need to revise your strategy.
Connecting Facebook Insights to Power BI will give you an accessible Facebook insights data studio report that tracks all the data about your impressions and reaches within a specific date range.
Page and post engagement
Engagement is the umbrella word for all user interactions with a post or a page. This includes, but is not limited to, all responses, post clicks, post shares, comments, profile clicks, and more.
Engagement shows how well the target audience receives a post or page. The more a post is interacted with, the more likely it is to appear in the newsfeed of your fans.
The total engagement counts, along with the breakdowns by type of engagement (angry, sad, love, laughing, comment, like, save, etc.), show how people react to your posts.
Thus, page analytics in an insights report template summarizes people’s positive and negative actions, sorted by post name.
Page likes, follows, and demographics
Page likes and follower numbers are one of the very first metrics for a Facebook Page.
These metrics demonstrate how keen someone is to keep in contact with your brand. Likes are a good sign, but getting followed matters because it makes your content visible to a larger audience.
A significant number of likes and followers tends to create more organic post engagement. This gives you a better in into paid marketing when using custom dimensions to set your target audience metrics according to the demographic of your followers.
Follower count is perhaps one of the essential metrics when designing your Facebook insights template. It’s an excellent data source for knowing your audience.
That will allow you to customize your content better according to their needs. The demographics of your target audience are a crucial part of developing your brand’s social media personas.
Plus, being able to build an engaging community through targeted content will lead to an organic increase in your Facebook page fans.
Reporting video statistics
Most of the post-engagement metrics described above also apply to video posts. However, there are two specific Facebook video metrics to analyze that can give you even more information about the performance of your page.
Video views: The number of people who watched your video for three seconds or more.
Audience retention: It tells you how long you maintained your audience’s attention in the total duration of a video.
These metrics will inform you about your video’s popularity with your audience and if you should spend more time creating similar content.
How to use the Power BI Facebook Page Insights Report Dashboard
- As seen in the figure below, go to onboard on Windsor.ai’s homepage and select “Facebook Page (organic)” from the column on the left. Once you have done that, grant access to your data source by clicking the gray button at the top.

- That will take you to your Facebook pages. To visualize data using Power BI, you need to grant access to the data source by selecting the right page.
Select the page you want to use as the data source for the Facebook page report, and click on “Next”, then click “Done”, and finally “OK”. 
- Click on Preview and Destination, at this step, you have to select “Facebook” as your data source, and then you can choose from over 200 key metrics that you would like to incorporate into your Facebook page report.

After selecting the metrics, click on “Power BI Web” and copy your API Key.
4. Download the Desktop Template and add your API Key and Date range as shown below

- After the Data will load you will be see you data in the Facebook page insights ready template
Conclusion: Power BI Facebook Insights report template
If you’re using Facebook, the data is there, but it’s not necessarily the best analysis tool. Thus, you should connect your Facebook Insights dashboard to Power Bi.
You can import Facebook insights data and create a Power BI report. On your Facebook insights template, you can customize your blank report, organize all the metrics, filter them, create a new report and use other features to make the most of it.
A Power bi Insights report will help you identify trends that will offer valuable insights into your business’s performance.
You can even connect Facebook Ads with Power Bi using Windsor.ai.
If you are someone looking to seriously fortify the weaknesses in your business strategy to work smarter for the next quarter, sign up for Windsor.ai right now!
Through its connectors, you can make the most of your Facebook insights reports by using Microsoft Power Bi.
So what are you waiting for? Head over to Windsor.ai right now!
Try Windsor.ai today
Access all your data from your favorite sources in one place.
Get started for free with a 30 - day trial.
Also read:
Guide to Power BI for Digital Marketing
Facebook Ads to Google Sheets Integration
Facebook Lead Ads Data Connectors