 AI insights
 About us
 Careers
 Security
 Customer reviews
 Contact us
 Affiliate program
 Solution partners
 Looker Studio templates
 Tableau templates
 Facebook Ads templates
 Google Ads templates
 Data fields & Metrics
 AI prompt library & Guides
 Product documentation
 API documentation
 Case studies
 Blog
Blog Data models
 Windsor vs Supermetrics
 Windsor vs Fivetran
 Windsor vs Portermetrics
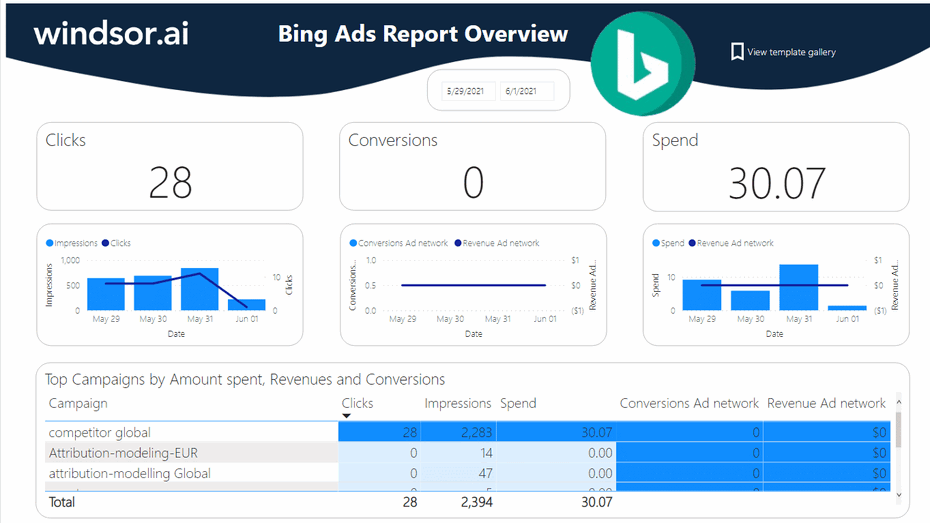
Introduction to Power BI Bing Ads Template
This Bing Ads Power BI Report Dashboard Template helps you to visualize your Bing Ads into Power BI in a few clicks. Dimensions and metrics visualized in this report are:
- Date
- Campaign
- Clicks
- Impressions
- Spend
- Conversions
- Revenue
It queries the data through our connector and makes it available in real-time. Follow the steps outlined below to get your data connected. In case you are interested in the Power BI desktop file used to create the report, simply scroll down further.
How to setup Power BI Bing Ads Report Dashboard Template in 2024
- Connect your Bing Ads Data to Windsor.ai here. Register or login if you already have an account.

- Select at least one Bing Ads account from the dropdown and remember to grant access. Copy your API Key from the top right corner


3. Install the Power BI Web App here
4. Click on Connect in the Connect your data section

5. Enter your API key which you got in Step 1

6. On the next screen click on Sign In

7. Your data should be loading now. Depending on your data size this may take a minute or two.
Alternative: Power BI Desktop
If you would like to explore how we build the template on the Power BI desktop, you can also download the latest version of the dashboard template in .pbix format here.
Please note that the source data is in US regional settings format (1234.56 and 2020-12-16), and if you are using different locale settings, you might need to transform numerical and date data. This will allow you to change the visuals and join the data with other data sets you might already have in your data setup.
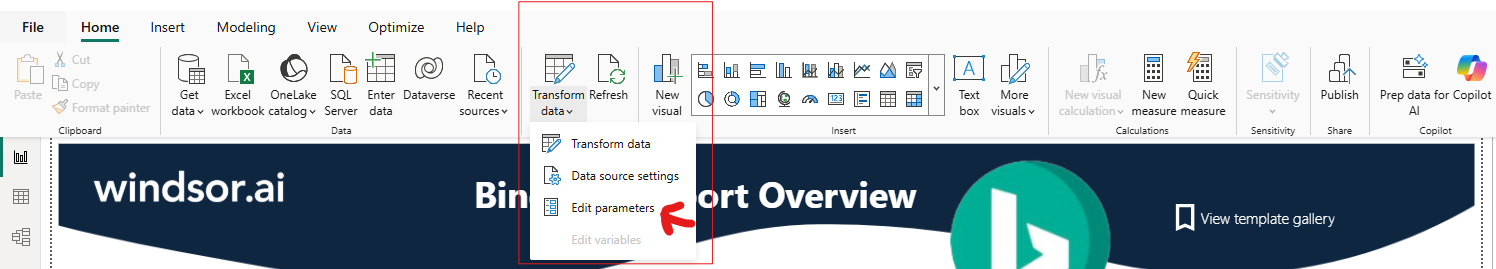
When opening the .pbix file on your Power BI desktop, click Home -> Transform data -> Edit parameters:
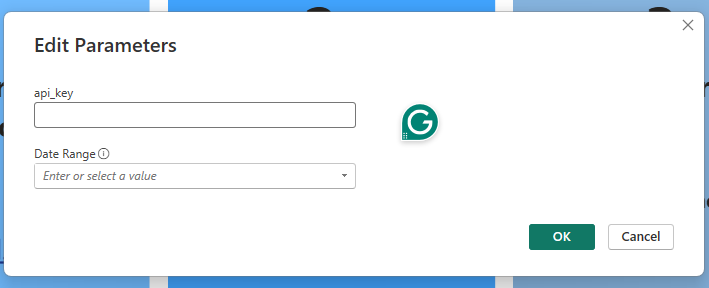
Then, you’ll be prompted to paste your Windsor.ai API key and select the desired date range:
Cheers! Now you can see your data integrated into this Bing Ads Power BI template. Feel free to customize it to your preference and extract actionable insights.
You might also be interested in…