 Destinations
 Data sources
 AI insights
 About us
 Careers
 Security
 Customer reviews
 Contact us
 Affiliate program
 Solution partners
 Template gallery
 Looker Studio templates
 Power BI templates
 Excel templates
 Google Sheets templates
 Tableau templates
 Facebook Ads templates
 Google Ads templates
 Data fields & Metrics
 AI prompt library & Guides
 Product documentation
 API documentation
 Case studies
 Blog
Blog Data models
 Windsor vs Supermetrics
 Windsor vs Funnel.io
 Windsor vs Fivetran
 Windsor vs Rivery
 Windsor vs Portermetrics
 Windsor vs Coupler.io
 Last updated: 8 October 2026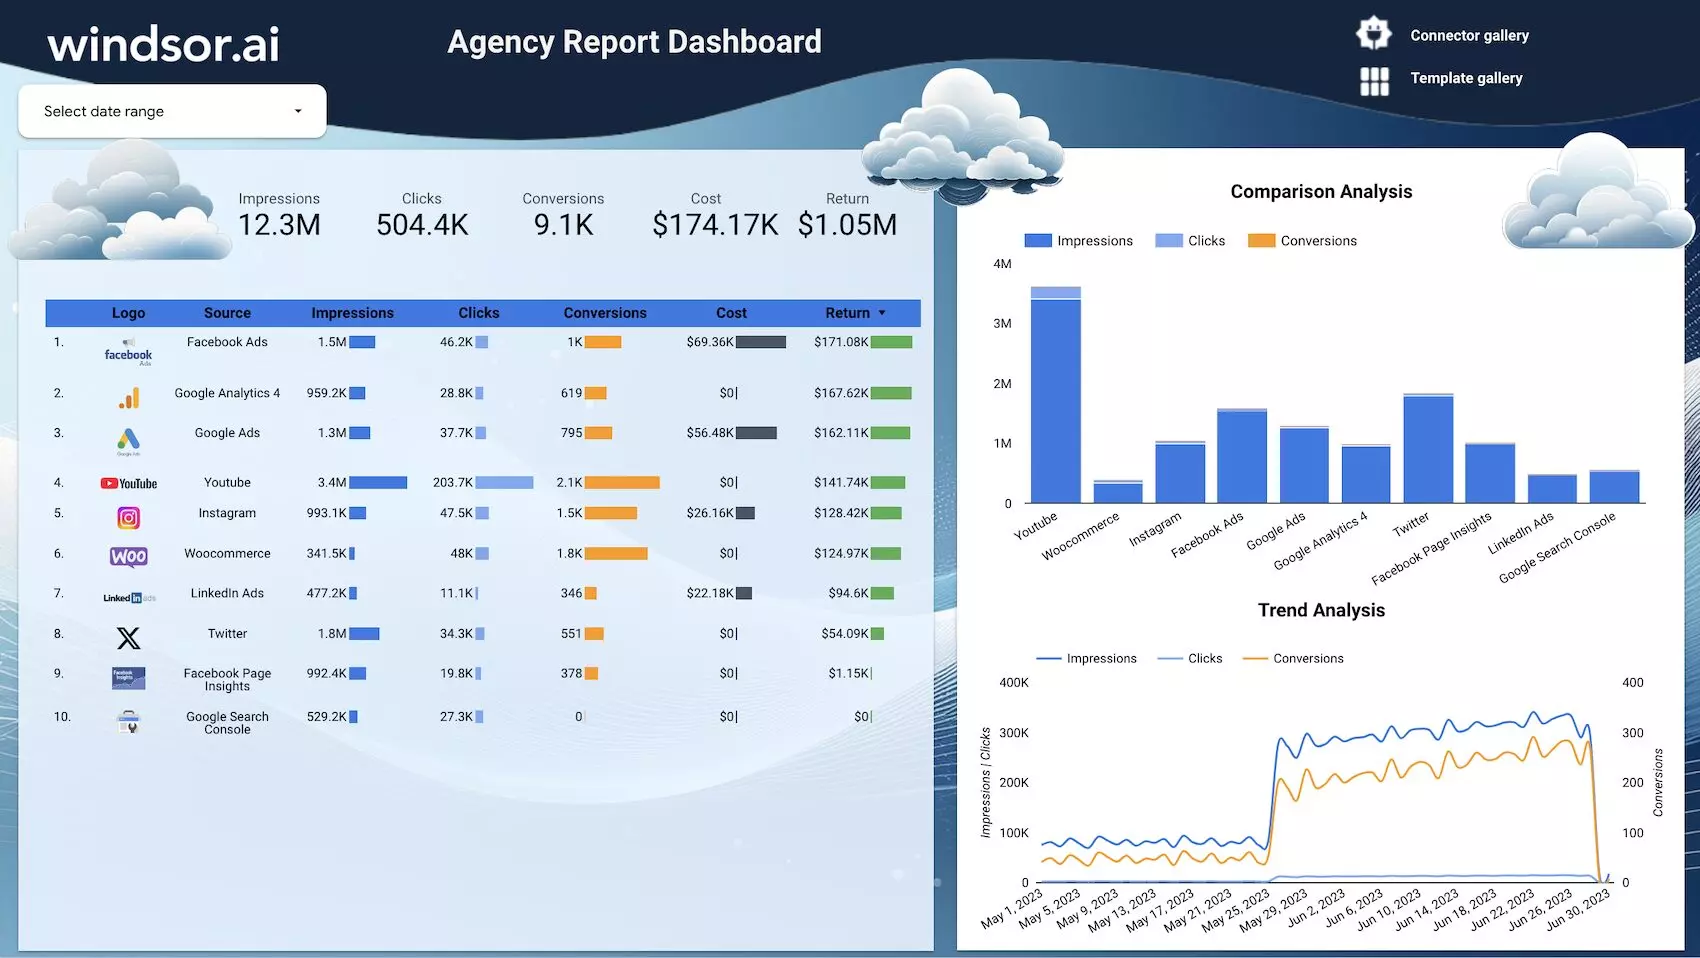




This free Windsor.ai Marketing Agency Reporting Dashboard Template for Looker Studio helps agencies and marketers automate cross-channel performance analytics and gain a unified view of their marketing data.
By using this template, you can achieve the following:
- Visualize key metrics, such as impressions, clicks, conversions, costs, and ROAS, across different campaigns, demographics, and platforms.
- Connect multiple data sources to gather insights from various channels for a comprehensive overview of your marketing performance.
- Optimize campaigns with real-time analytics data by identifying trends and gaps.
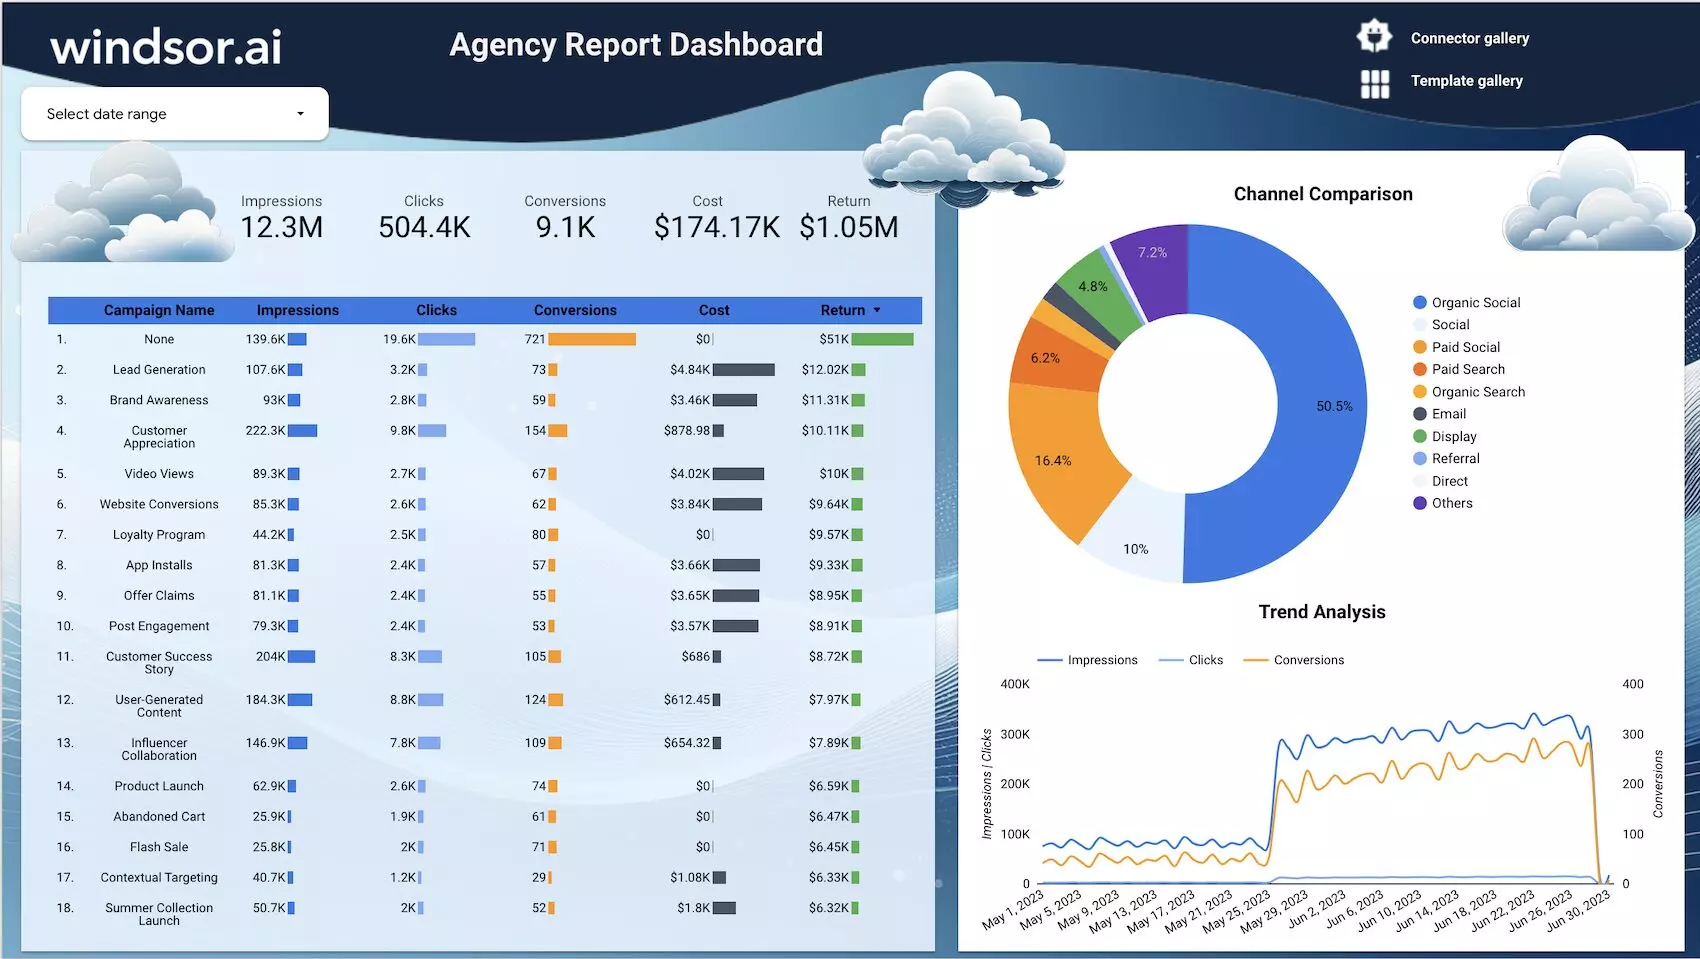
With a few clicks and no technical setup, you can quickly get started with this marketing agency report template. Just connect your data sources, and Windsor.ai will automatically generate your custom Looker Studio dashboard filled with fresh analytics.
How to use the Windsor.ai Marketing Agency Reporting Dashboard Template
- Configure the Windsor.ai Connector for Looker Studio
- Once you finish installing the connector, open the Marketing Agency Report Dashboard Template and make a copy of it (File -> Make a copy)
- Connect the data source(s).
Find the detailed instructions for setting up Windsor.ai Looker Studio templates in the documentation.
Now, your dashboard is set up and ready to use. Make the most out of your marketing data!
What is the Marketing Agency Report Dashboard on Looker Studio?
The Marketing Agency Report Dashboard is a pre-built Windsor.ai template for Looker Studio that helps agencies and marketers automate and streamline marketing agency reports.
Using it, you can deliver clear, data-driven reports to clients and stakeholders while eliminating manual reporting tasks.
In this way, this agency reporting dashboard helps you demonstrate your marketing capabilities and impact, including conversion rates and ROI, to justify spend.
Why is marketing agency reporting important?
Every marketing agency needs to analyze campaign success metrics efficiently to make smart, data-driven decisions and optimizations. A well-organized dashboard, like Windsor.ai’s Marketing Agency Report Dashboard, helps agencies achieve this by tracking the following key metrics:
- Visibility metrics: Impressions, reach, click-through rates, and more.
- Engagement metrics: Views, likes, shares, comments, and more.
- Conversion metrics: Conversion rates, cost per acquisition, return on ad spend (ROAS), and more.
You can further filter queries by media channels, campaigns, regions, and demographics to discover deeper insights and refine your marketing approaches.
Benefits of using Windsor.ai Marketing Agency Reporting Dashboard
Our Agency Reporting Dashboard Template takes your marketing reporting and analytics efforts to the next level with these features:
-
Automated reporting
The primary advantage is fully automated marketing reporting, made possible by Windsor.ai’s data integration tool, which seamlessly syncs your data sources with Looker Studio’s interface in a few minutes.
-
Data-driven marketing approach
The agency reporting template unlocks all the advantages of data-driven marketing. By delving into the results of your marketing campaigns, you can learn more about your target consumers and their behavior, allowing you to refine segmentation and improve targeting strategies.
-
Increased conversion rates
The agency dashboard reporting template can help you uncover valuable insights into boosting conversion rates. For example, by analyzing when your target audience is most likely to engage with your ads, you can optimize your advertising schedule for maximum impact.
-
Higher returns on advertising spending
Another significant benefit is maximizing your return on ad spend (ROAS). The agency reporting dashboard highlights which platforms drive the highest conversions relative to cost, allowing you to optimize bids wisely. By reallocating your budget to high-performing channels and reducing spend on underperforming ones, you can increase ROAS and overall marketing efficiency.
FAQs
What is the marketing agency reporting dashboard used for?
The agency reporting dashboard is used for centralized marketing performance monitoring. Marketing agencies also use it to offer brands their value proposition by demonstrating their ability to reach target audiences and drive conversions. Furthermore, the free agency data dashboard allows you to compare advertising budget utilization against conversions and ROI, helping you optimize spending for better results.
Why use the Windsor.ai Marketing Agency Reporting Dashboard Template?
Windsor.ai automatically generates marketing agency reports based on your data, allowing you to gain deep performance insights that can be easily shared with others. Our agency platform reporting & customer dashboard provide users with seamless data integration, making performance evaluation more efficient. Through our Looker Studio support for digital agencies, the system simplifies report generation, allowing agency staff to improve marketing effectiveness through comprehensive data visualization tools.
How much does the Windsor.ai Marketing Agency Reporting Dashboard cost?
All our templates are completely free! Pricing depends only on the number of connectors, accounts, and destinations you choose to use.
What is Looker Studio?
Looker Studio is a data visualization platform provided by Google to support businesses with big data analytics. It is web-based and available online at no cost. When using Windsor.ai Looker Studio connectors, you can easily automate marketing reporting by syncing data from marketing platforms, business apps, and data warehouses.


