 Destinations
 Data sources
 AI insights
 About us
 Careers
 Security
 Customer reviews
 Contact us
 Affiliate program
 Solution partners
 Template gallery
 Looker Studio templates
 Power BI templates
 Excel templates
 Google Sheets templates
 Tableau templates
 Facebook Ads templates
 Google Ads templates
 Data fields & Metrics
 AI prompt library & Guides
 Product documentation
 API documentation
 Case studies
 Blog
Blog Data models
 Windsor vs Supermetrics
 Windsor vs Funnel.io
 Windsor vs Fivetran
 Windsor vs Rivery
 Windsor vs Portermetrics
 Windsor vs Coupler.io
 Last updated: 12 October 2026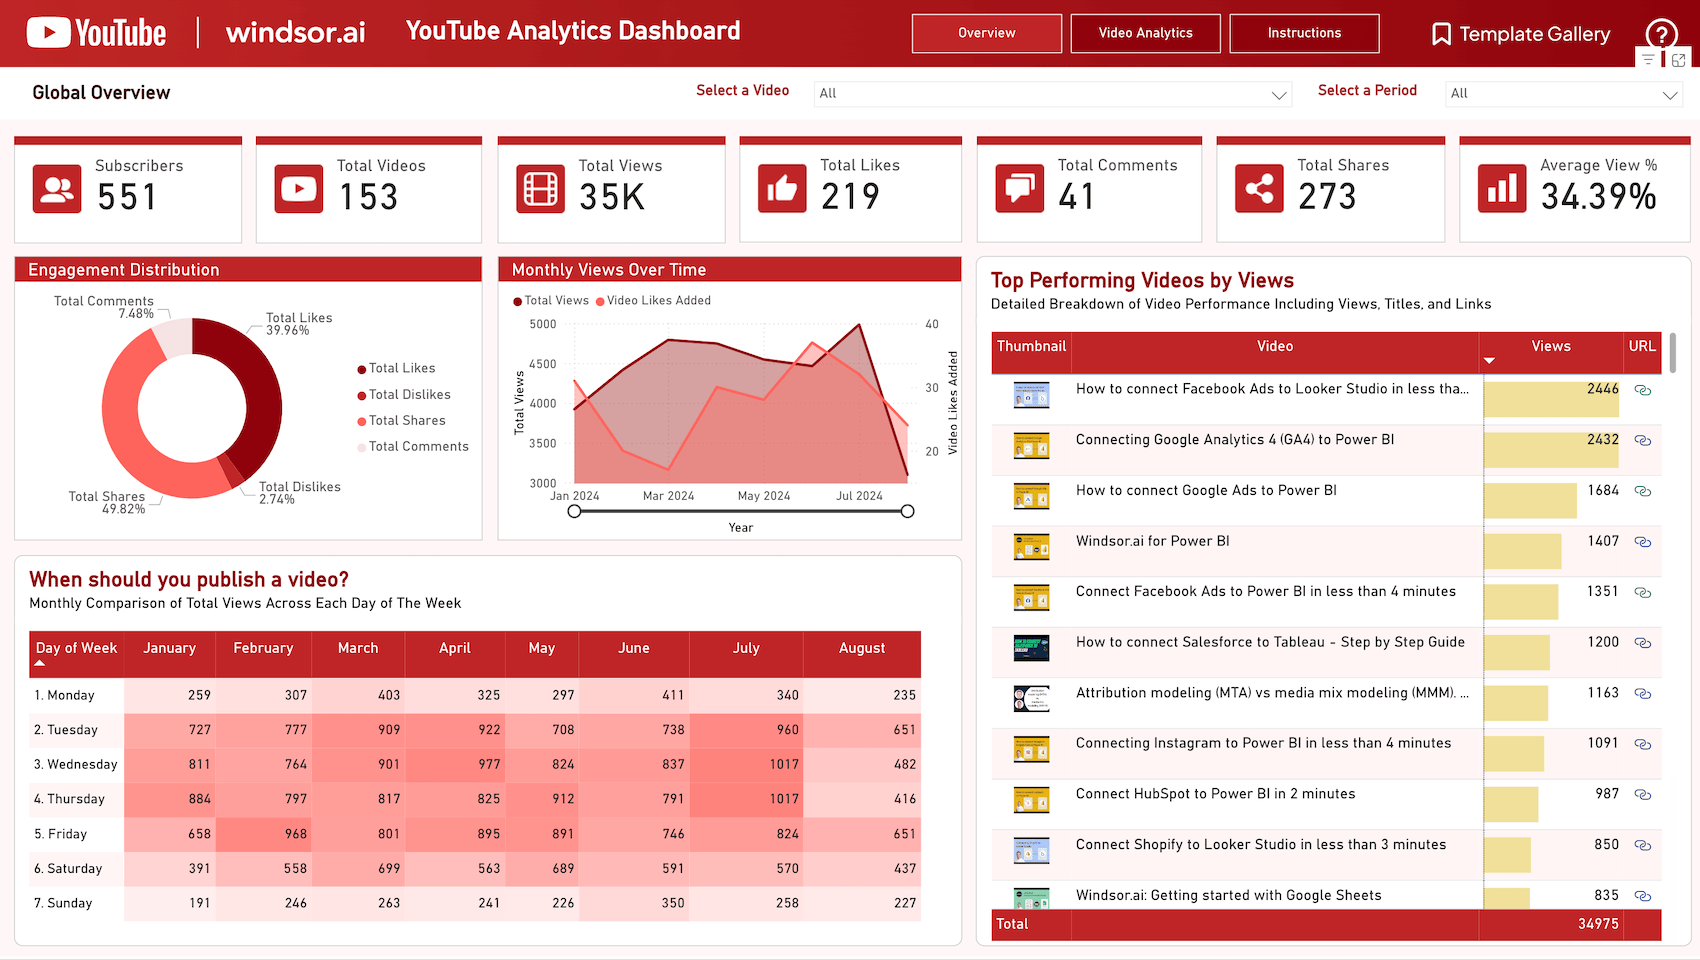




This free Power BI template turns your YouTube Analytics data into a two-page report: a channel overview and a per-video performance table. It pulls the data through the Windsor.ai YouTube connector, so you connect your channel once and the template loads your numbers when you open it.
We tested it on the Windsor.ai YouTube channel on 12 October 2026 in Power BI Desktop. The view count in the report matched the connector exactly (34,190 views for 14 September to 9 October 2026).
To connect YouTube to Power BI without the template, for example to build your own report or use Power BI on the web, see Connect YouTube to Power BI.

Get started for free
Access all your data from your favorite sources in one place.
Free forever plan, no credit card
What the template shows
Overview page
- Cards: subscribers, total videos, total views, likes, comments, shares and average view percentage
- Engagement distribution: a donut chart splitting likes, dislikes, shares and comments
- Top performing videos by views: thumbnail, title, views and a link to each video
- Monthly views over time: views and likes by month
- Filters for date and video title
Video Analytics page
One row per video with thumbnail, title, views, likes, dislikes, comments, subscribers gained, shares, average view percentage, video length, estimated minutes watched, publish date and a link to the video.
Data behind it
The template runs three queries against the Windsor.ai YouTube connector:
- Video (daily, per video): views, likes, dislikes, comments, shares, estimated minutes watched, average view duration and percentage, subscribers gained and lost, playlist adds and removals, YouTube Premium views and minutes
- Video details: title, URL, thumbnail, length, publish date, category, tags, captions, privacy status, resolution
- Channel: channel name, image, current subscriber count and number of public videos
Dislikes are visible because the data comes from the channel owner’s YouTube Analytics, not the public video page.
What it looked like on our channel
With Date_Period set to last 28 days on 12 October 2026, the data covered 14 September to 9 October (YouTube had not reported the last two days yet). The report showed 34,190 views, 116 likes, 17 comments, 127 shares and 39 subscribers gained across 329 videos that got views in the period. The top video was “How to Connect Instagram to Claude: 60-Second Setup” with 2,650 views and a 51.45% average view percentage.
How to set it up
You need a YouTube channel you can access, a Windsor.ai account and Power BI Desktop (Windows).
- Connect YouTube to Windsor.ai. Sign in at onboard.windsor.ai, choose YouTube and grant access to your channel.
- Copy your API key. You’ll find it in your Windsor.ai account.
- Download the template: Youtube Analytics (Desktop Template).pbit.
- Open it in Power BI Desktop. Paste your API key into API_Key, pick a Date_Period (from last 7 days up to last year) and click Load.
- Allow the connection. Power BI asks how to access https://connectors.windsor.ai/youtube. Choose Anonymous, keep the level at https://connectors.windsor.ai/ and click Connect. Your API key is already part of the query, so no other sign-in is needed.
- Open the Overview tab. The report opens on its Instructions tab, which still describes an older copy-the-URL setup. You can skip it.
To load new data later, click Refresh on the Home tab. Save the file as .pbix. It keeps your API key inside the queries, so don’t share that file.
Things to know before you rely on the numbers
- Data runs about three days behind. On 12 October 2026 the latest day available was 9 October. YouTube Analytics itself reports with a delay.
- The free plan covers the last 30 days. The Date_Period options from last 90 days up need a paid plan. Windsor.ai has a free forever plan, no credit card, with paid plans from $19/month.
- Subscribers is a current total. The card shows today’s subscriber count (rounded to “2K” for our 1,820) regardless of the date range. Subscribers gained in the period are in the Video Analytics table.
- Total Videos counts videos with views in the period, not all videos on the channel (329 against our 353 public videos).
- Average view percentage is a simple average across videos and days, not weighted by views. Ours showed 51.80% while the channel’s daily figures for the same weeks ran from 37% to 48%.
- Watch time per video adds up to less than the channel total. The template sums minutes per video per day: 12,575 minutes for our period, against 14,202 when the same days are pulled at channel level. Use the channel figure for total watch time.
- The monthly chart reflects partial months. With a 28-day period you get one full and one partial month, so the line drops at the end.
- No impressions or click-through rate. The connector doesn’t have thumbnail impressions or CTR, so the template can’t show them.
- Annotation and card fields return 0. The template still requests them, but YouTube retired annotations in 2019 and our channel had no card activity.
Customize it
Each table is a query with a list of fields in its URL. In Power BI, open Transform data, pick a query and edit the fields= list in the Advanced Editor to add fields. Useful additions the template doesn’t include:
-
traffic_source: how viewers found your videos (YouTube search, suggested videos, external links) -
creator_content_type: Shorts, long-form, live streams -
engaged_views: views past the first seconds, the comparable count for Shorts after YouTube changed how it counts Shorts views in March 2025 -
viewer_age_group,viewer_genderwithviewer_percentage: audience demographics as percentages -
subscribers_gained_channel,subscribers_lost_channel: daily subscriber changes for the whole channel
See the full list in the YouTube field reference.
FAQs
Does it work in Power BI on the web?
The template is a Power BI Desktop file (.pbit). To get YouTube data into Power BI on the web, use the Web connector with a Windsor.ai query URL, as described on Connect YouTube to Power BI.
Why don't the numbers match YouTube Studio?
Three common reasons: the connector data runs about three days behind, the template’s watch time is summed per video (lower than the channel total) and its average view percentage is unweighted. Studio’s lifetime figures also cover a different period than the template’s date range.
Can I see click-through rate or impressions?
No. The connector doesn’t include thumbnail impressions or click-through rate, so the template can’t show them. Views, watch time, engagement, subscribers, traffic sources and demographics are available.
Can I add YouTube Ads data?
Not through this template. YouTube ad campaigns are reported through Google Ads. Connect Google Ads to Windsor.ai and add it as a separate query.


