 Destinations
 Data sources
 AI insights
 About us
 Careers
 Security
 Customer reviews
 Contact us
 Affiliate program
 Solution partners
 Template gallery
 Looker Studio templates
 Power BI templates
 Excel templates
 Google Sheets templates
 Tableau templates
 Facebook Ads templates
 Google Ads templates
 Data fields & Metrics
 AI prompt library & Guides
 Product documentation
 API documentation
 Case studies
 Blog
 Data models
 Windsor vs Supermetrics
 Windsor vs Funnel.io
 Windsor vs Fivetran
 Windsor vs Rivery
 Windsor vs Portermetrics
 Windsor vs Coupler.io
Connect YouTube Analytics to Power BI
Get your YouTube channel data into Power BI with the Windsor.ai connector: views, watch time, likes, shares, subscribers, traffic sources and audience demographics, per video and per day.
Use the native connector in Power BI Desktop, a query URL in Power BI on the web, or start from our free YouTube template.
 Sign up with Google
 Free forever plan
No credit card needed










What you can report on in Power BI
The connector reads your channel’s YouTube Analytics. A few reports teams build first:

Which videos keep viewers watching
Compare average view percentage, average view duration and minutes watched per video, then sort by publish date to see whether newer videos hold attention better.

Shorts against long-form
Split views, watch time and subscribers gained by content type (Shorts, long-form, live) to see which format grows the channel.

Where your views come from
Break views down by traffic source, such as YouTube search, suggested videos, playlists and external sites, and track how the mix changes after you publish.
What YouTube data reaches Power BI
The YouTube connector covers your own channel’s analytics. Fields are grouped like this:
- Per video, per day: views, engaged views, estimated minutes watched, average view duration and percentage, likes, dislikes, comments, shares, subscribers gained and lost
- Video details: title, URL, thumbnail, length, publish date, tags, category, captions, privacy status
- Channel: current subscriber count, number of public videos, total views
- Breakdowns: traffic source, content type (Shorts, long-form, live, stories) and audience age and gender as percentages
Data runs about three days behind, because YouTube Analytics reports with a delay. The connector doesn’t include thumbnail impressions or click-through rate. YouTube ad campaigns are reported through Google Ads, not this connector.
Example: where the Windsor.ai channel’s views came from
For Power BI on the web, a query URL like this one loads views and watch time by traffic source (replace YOUR_API_KEY with your key):
https://connectors.windsor.ai/youtube?api_key=YOUR_API_KEY&date_preset=last_28d&fields=traffic_source,views,estimated_minutes_watched
On our own channel, for 14 September to 9 October 2026 (pulled 12 October), it returned 34,190 views, the same total the YouTube template showed for that period:

| Source | Views | Share | Minutes |
|---|---|---|---|
| YouTube search | 26,847 | 78.5% | 8,239 |
| External sites | 3,758 | 11.0% | 3,460 |
| Direct or unknown | 1,011 | 3.0% | 720 |
| Channel pages | 622 | 1.8% | 485 |
| Subscriptions | 607 | 1.8% | 219 |
| Shorts feed | 513 | 1.5% | 86 |
| Other | 832 | 2.4% | 882 |
Source values in the query output: YT_SEARCH, EXT_URL, NO_LINK_OTHER, YT_CHANNEL, SUBSCRIBER, SHORTS. “Other” covers playlists, other YouTube pages, suggested videos, ads and notifications. Minutes are estimated_minutes_watched.
Adding creator_content_type splits the same views by format: Shorts had 9,313 views and 9 new subscribers, long-form videos 24,877 views and 30 new subscribers. Search brings most of our views, but viewers from external sites watch about three times longer: 0.92 minutes per view, against 0.31 from YouTube search.
Example: YouTube views next to GA4 sessions
Add Google Analytics 4 as a second query in the same report to see what the channel sends to your website. For the same 14 September to 9 October 2026, GA4 (field session_source_medium) recorded 379 sessions on windsor.ai from youtube.com / referral, 239 of them engaged. Set against 34,190 channel views, that is about 1.1 website sessions per 100 views.
GA4 also listed 464 sessions from accounts.youtube.com / referral. That referrer typically comes from Google sign-in redirects rather than from videos, so we left it out of the comparison.
Example: which videos keep viewers watching
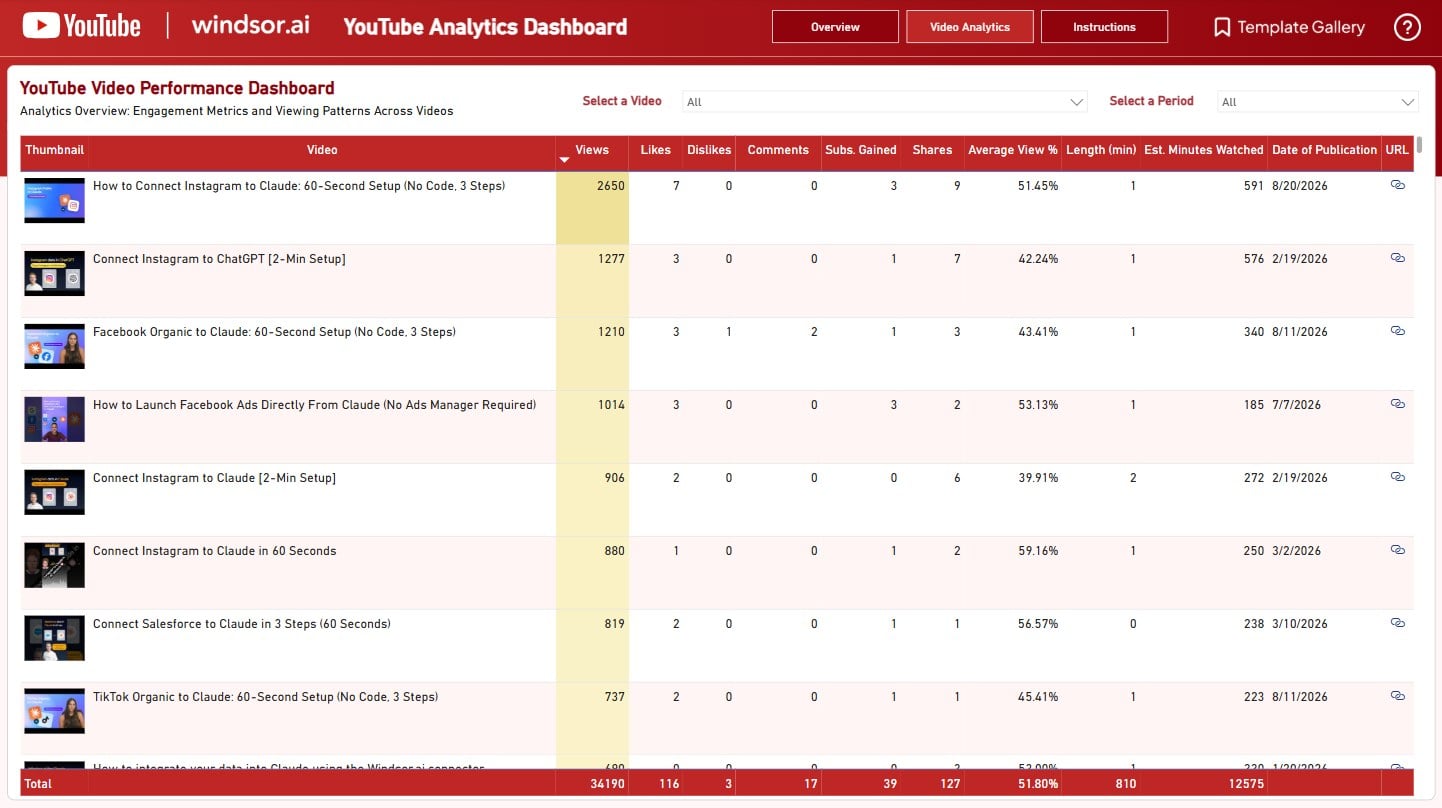
The free YouTube template has a per-video page built from video_title, views, likes, shares, subscribers_gained, average_view_percentage and estimated_minutes_watched (screenshot alongside). On our channel for the same period, the most-viewed video, “How to Connect Instagram to Claude: 60-Second Setup”, had 2,650 views and a 51.45% average view percentage. “Connect Instagram to Claude in 60 Seconds” had fewer views (880) but held viewers longest of the top videos, at 59.16%.
How these numbers were pulled: Matei Ioan Nicolae (SEO Director, Windsor.ai) ran the test on 12 October 2026 on the Windsor.ai YouTube channel and GA4 property, both connected to one Windsor.ai account. The YouTube figures come from the connector for 14 September to 9 October 2026 (the latest day available on 12 October). The template total, the traffic-source total and the content-type total all came to 34,190 views. GA4 sessions are filtered on session_source_medium for the same dates.


How to connect YouTube to Power BI in Windsor.ai
There are three ways to connect: the native connector in Power BI Desktop, a query URL in Power BI on the web, or the free YouTube template. All three start with connecting YouTube to Windsor.ai.
Full guide: How to integrate data into Power BI.
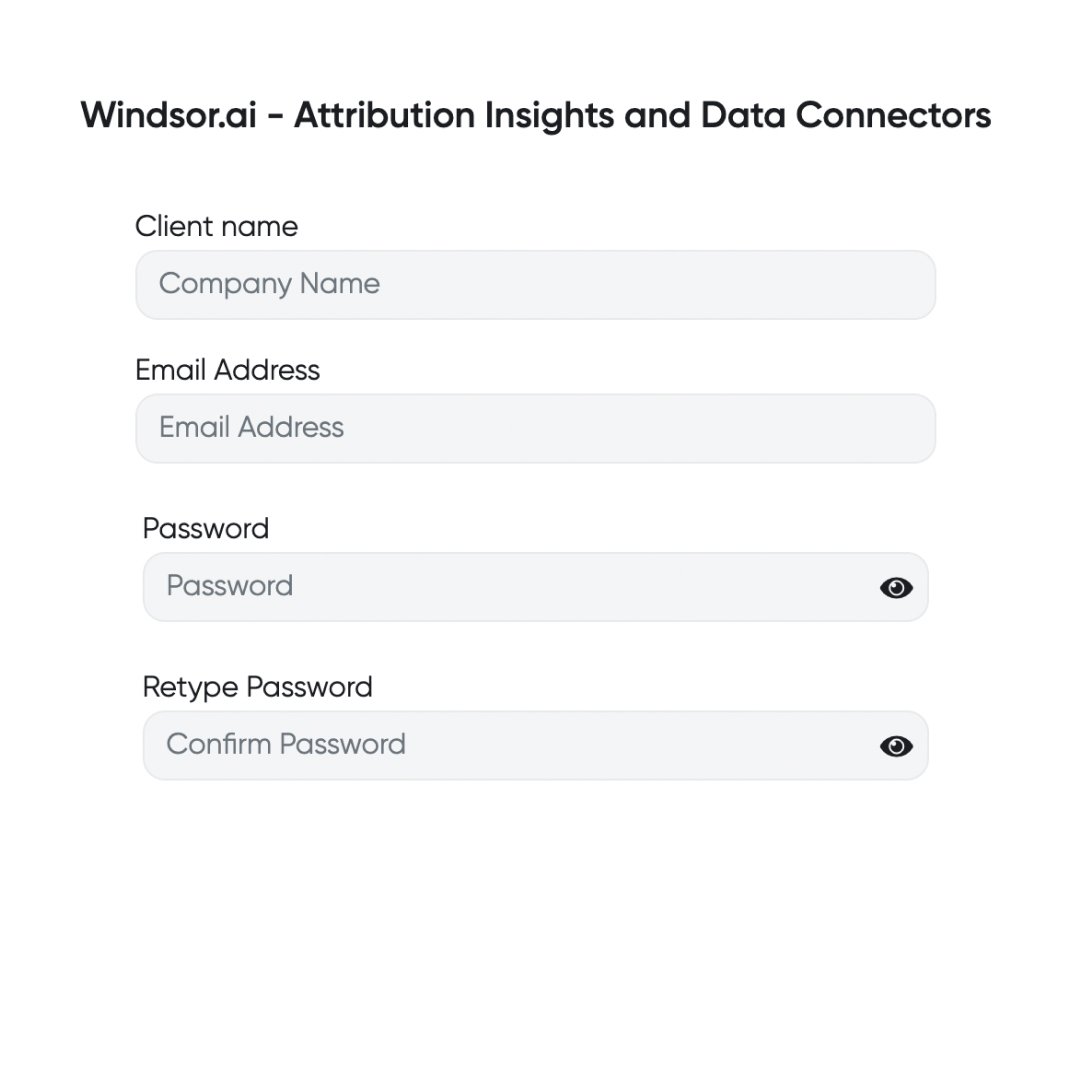
Register and log in to Windsor.ai
Create a new Windsor.ai account or log in if you already have one.
Connect YouTube
Choose YouTube as the data source, grant access to your channel and open the preview to check that your data loads.

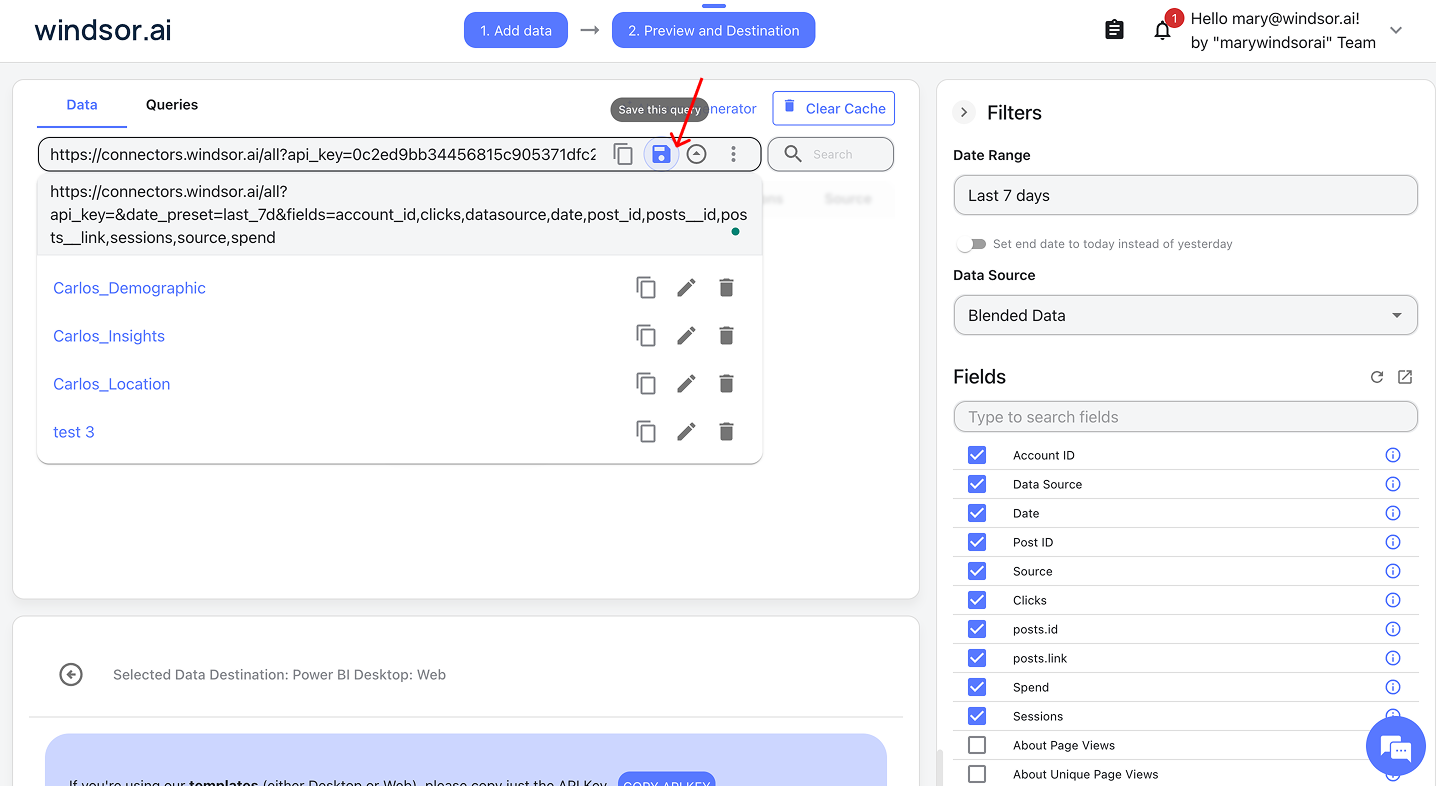
For Power BI Desktop: Save your query and select it in the app
- Save a query if you’re building a custom report in Power BI Desktop
- In Power BI Desktop, go to Get Data → Windsor → Sign in
- Select your saved query from Windsor and click Load
Video: Windsor.ai for Power BI Native connector
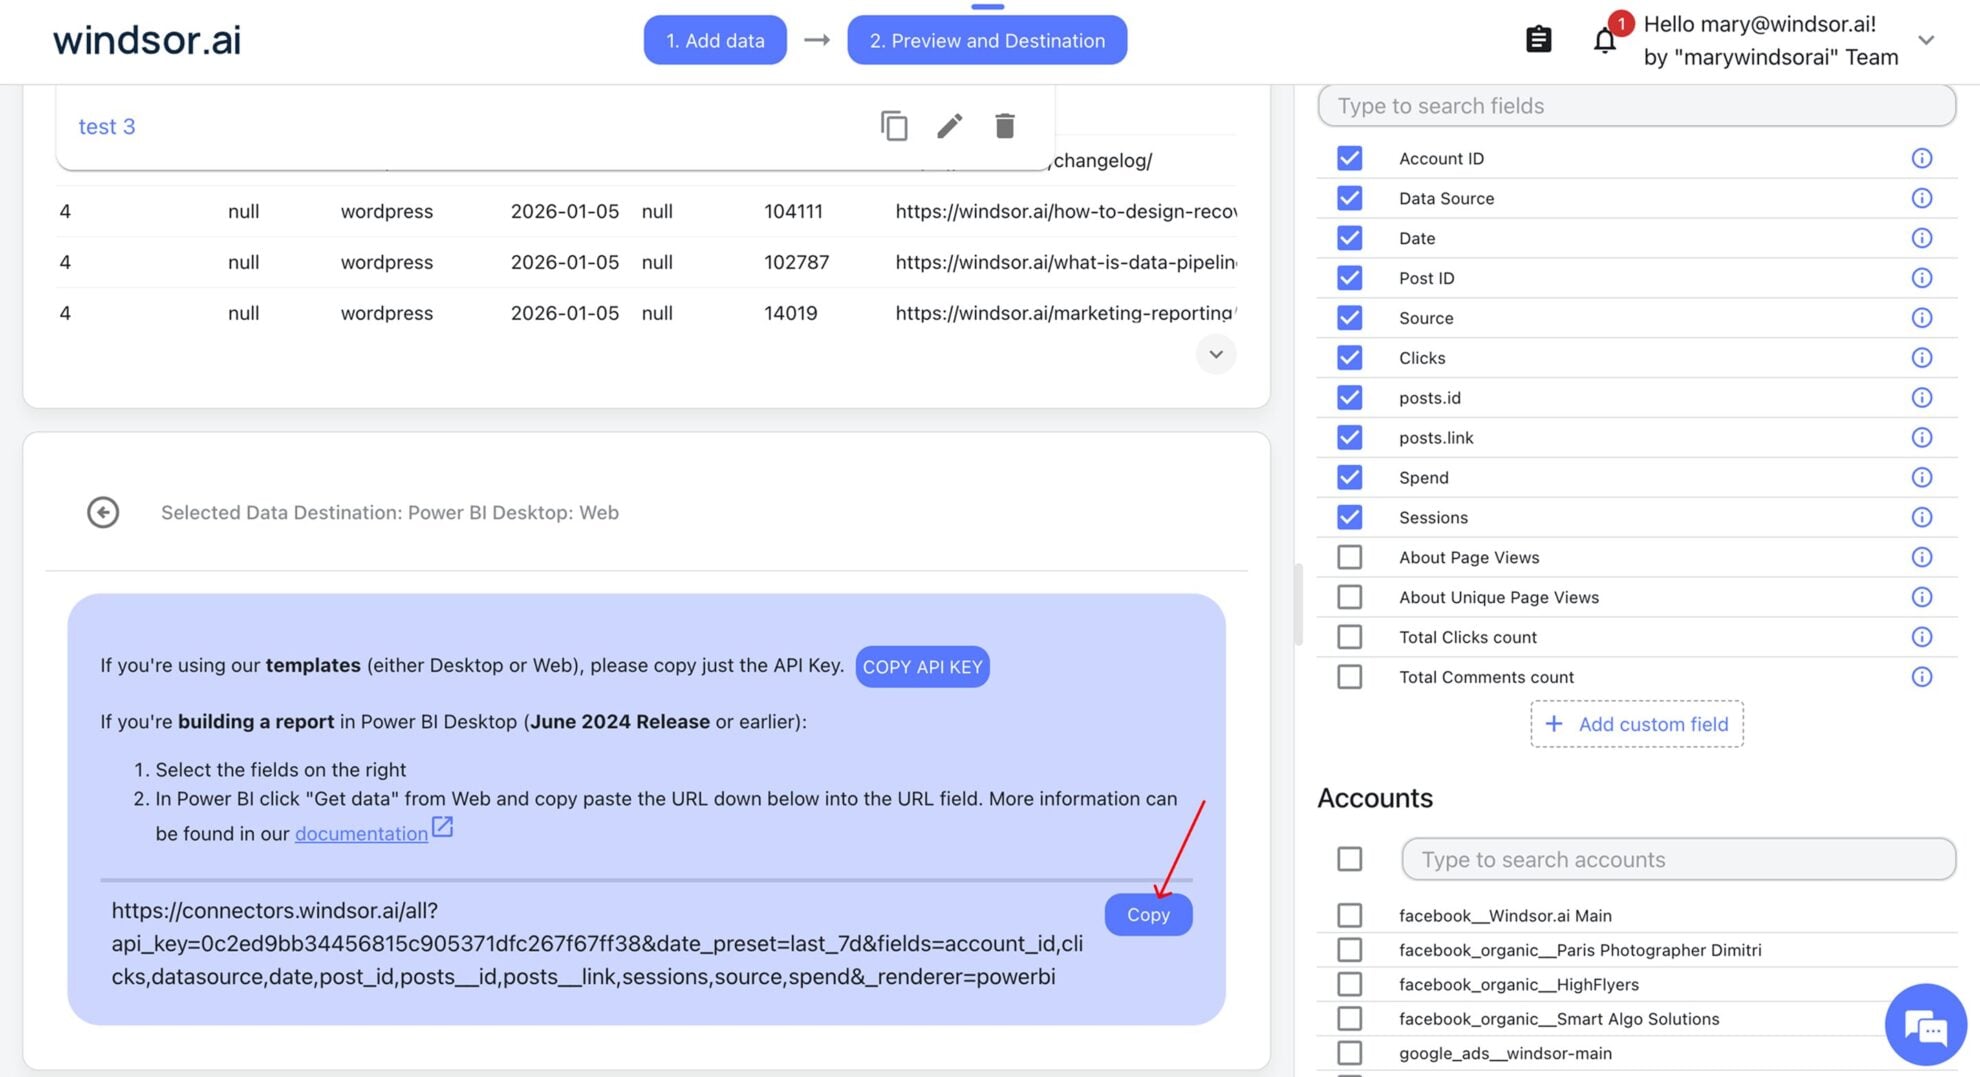
For Power BI on the web: use your query URL
- Copy your query URL from Windsor.ai
- In Power BI, go to Get Data → Web, paste the URL and click OK
- When Power BI asks how to access connectors.windsor.ai, choose Anonymous and click Connect. Your API key is already in the URL.
Video: Windsor.ai connector for Power BI
Or start from the free template
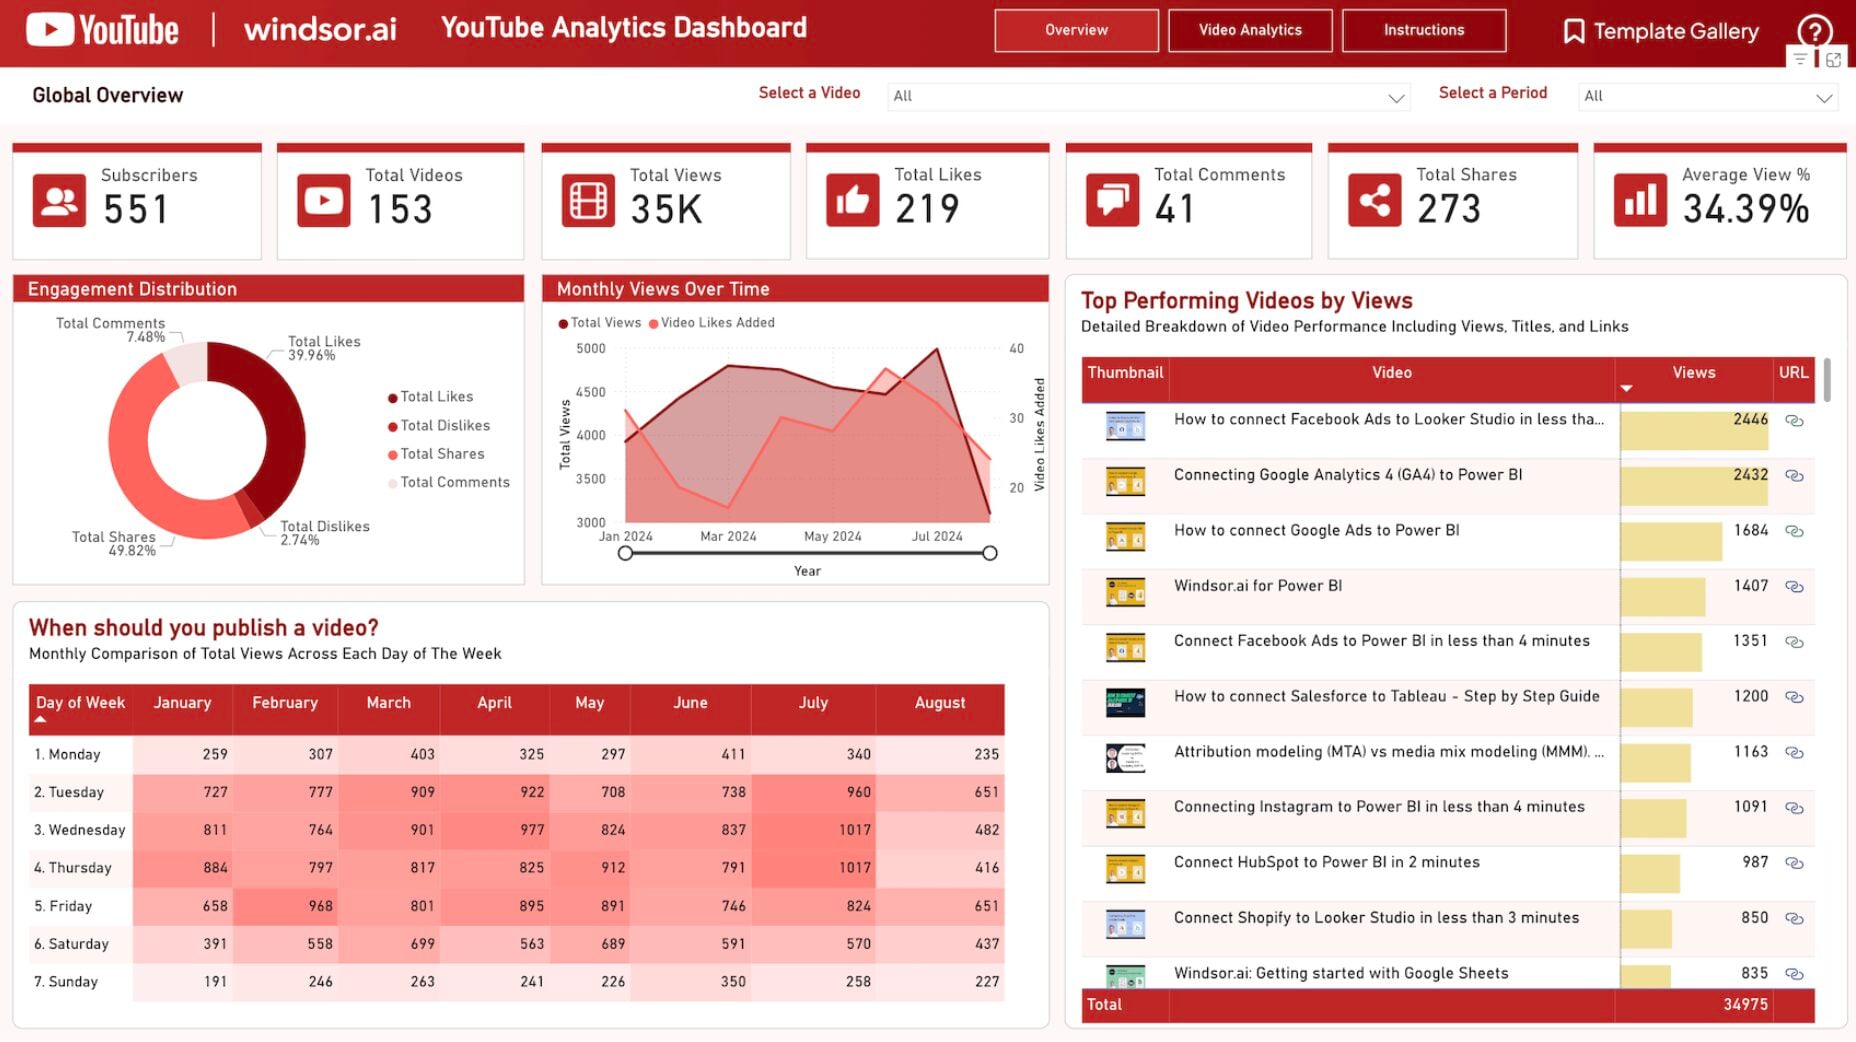
Download the YouTube Analytics template, open it in Power BI Desktop and paste your Windsor.ai API key. It loads an overview page and a per-video table. Tested on our channel on 12 October 2026.
Refresh your report
Click Refresh in Power BI to load new data. YouTube Analytics data arrives with a delay of about three days, so the latest days fill in over the following refreshes.

FAQs
Does it include click-through rate or impressions?
No. The connector doesn’t include thumbnail impressions or click-through rate.
Can I report on YouTube ads?
Not with this connector, which covers organic channel analytics. YouTube ad campaigns are reported through Google Ads. Connect Google Ads to Windsor.ai to bring ad spend and results into the same Power BI report.
Why does Power BI ask how to access connectors.windsor.ai?
The first time a report loads data from https://connectors.windsor.ai, Power BI shows an “Access Web content” window. Choose Anonymous, keep the level at https://connectors.windsor.ai/ and click Connect. Your API key is already in the URL, so no sign-in is needed.
The latest days are missing or lower than expected. Is something broken?
Usually not. YouTube Analytics data arrives about three days late, so the most recent days fill in over the next refreshes. Also check the date range: on the free plan, only the last 30 days are available.
How fresh is the data?
About three days behind. On 12 October 2026 the latest available day was 9 October. The delay comes from YouTube Analytics.
How much does it cost?
Windsor.ai has a free forever plan, no credit card, that covers the last 30 days of data for one data source and one account. Paid plans start at $19/month and add longer history, more data sources and accounts. See pricing.
Do you have resources to get started?
Yes. The YouTube field reference lists every field the connector returns, the YouTube Power BI template gives you a ready-made two-page report, and the Power BI integration documentation covers the Desktop connector and the web URL method step by step.
Tired of manual YouTube exports? Connect YouTube to Power BI with Windsor.ai


