 AI insights
 About us
 Careers
 Security
 Customer reviews
 Contact us
 Affiliate program
 Solution partners
 Looker Studio templates
 Tableau templates
 Facebook Ads templates
 Google Ads templates
 Data fields & Metrics
 AI prompt library & Guides
 Product documentation
 API documentation
 Case studies
 Blog
Blog Data models
 Windsor vs Supermetrics
 Windsor vs Fivetran
 Windsor vs Portermetrics
How to integrate data into Power BI with Windsor.ai
What is Power BI?
Power BI is a robust business intelligence tool by Microsoft that allows users to connect, analyze, and visualize data from various sources. With its extensive data visualization capabilities, Power BI transforms raw data into interactive dashboards and reports, enabling data-driven decision-making.
When integrated with Windsor.ai’s Power BI connectors, users can automate data syncing from 325+ marketing and business platforms with no code, eliminating manual data formatting, transfers, and reporting.
Explore our video tutorial and a step-by-step guide to seamlessly integrate your data into Power BI with the Windsor.ai ELT connector, consolidating your data sources in one place for advanced analytics and insights.
How to connect your data to Power BI Desktop with Windsor.ai
Before you start, make sure you have the Power BI desktop version installed and that you have access to your data sources accounts (Facebook Ads, Instagram, GA4, etc.).
1. Log in to your Windsor.ai account or register if you don’t have one.
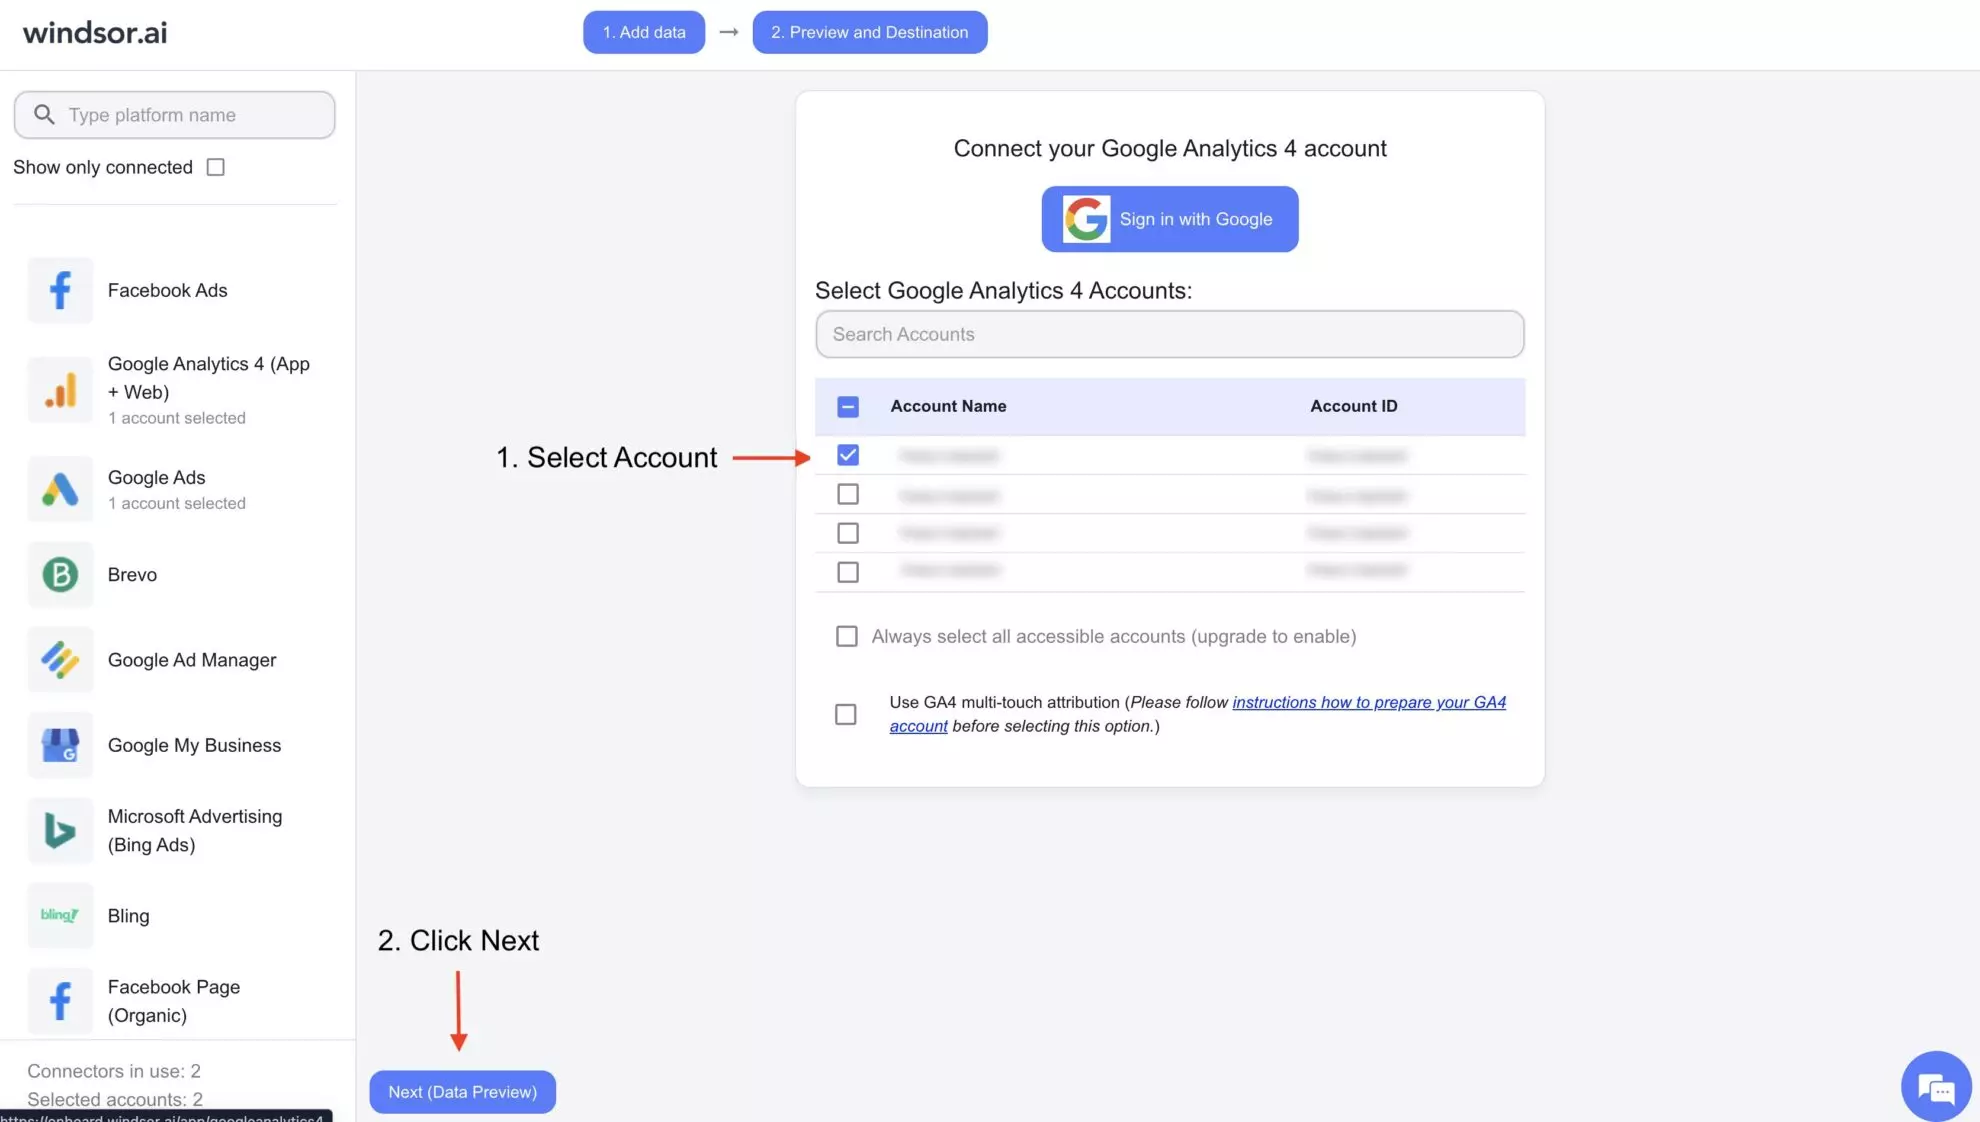
2. Connect your preferred data sources to Windsor.ai. In this example, we’ll use Google Analytics 4 (GA4). Select the necessary account(s) you want to pull data from and click “Next.”
3. On the left side of the preview window, set your preferred reporting settings, and under the “Fields” tab, select the data you want to work with.
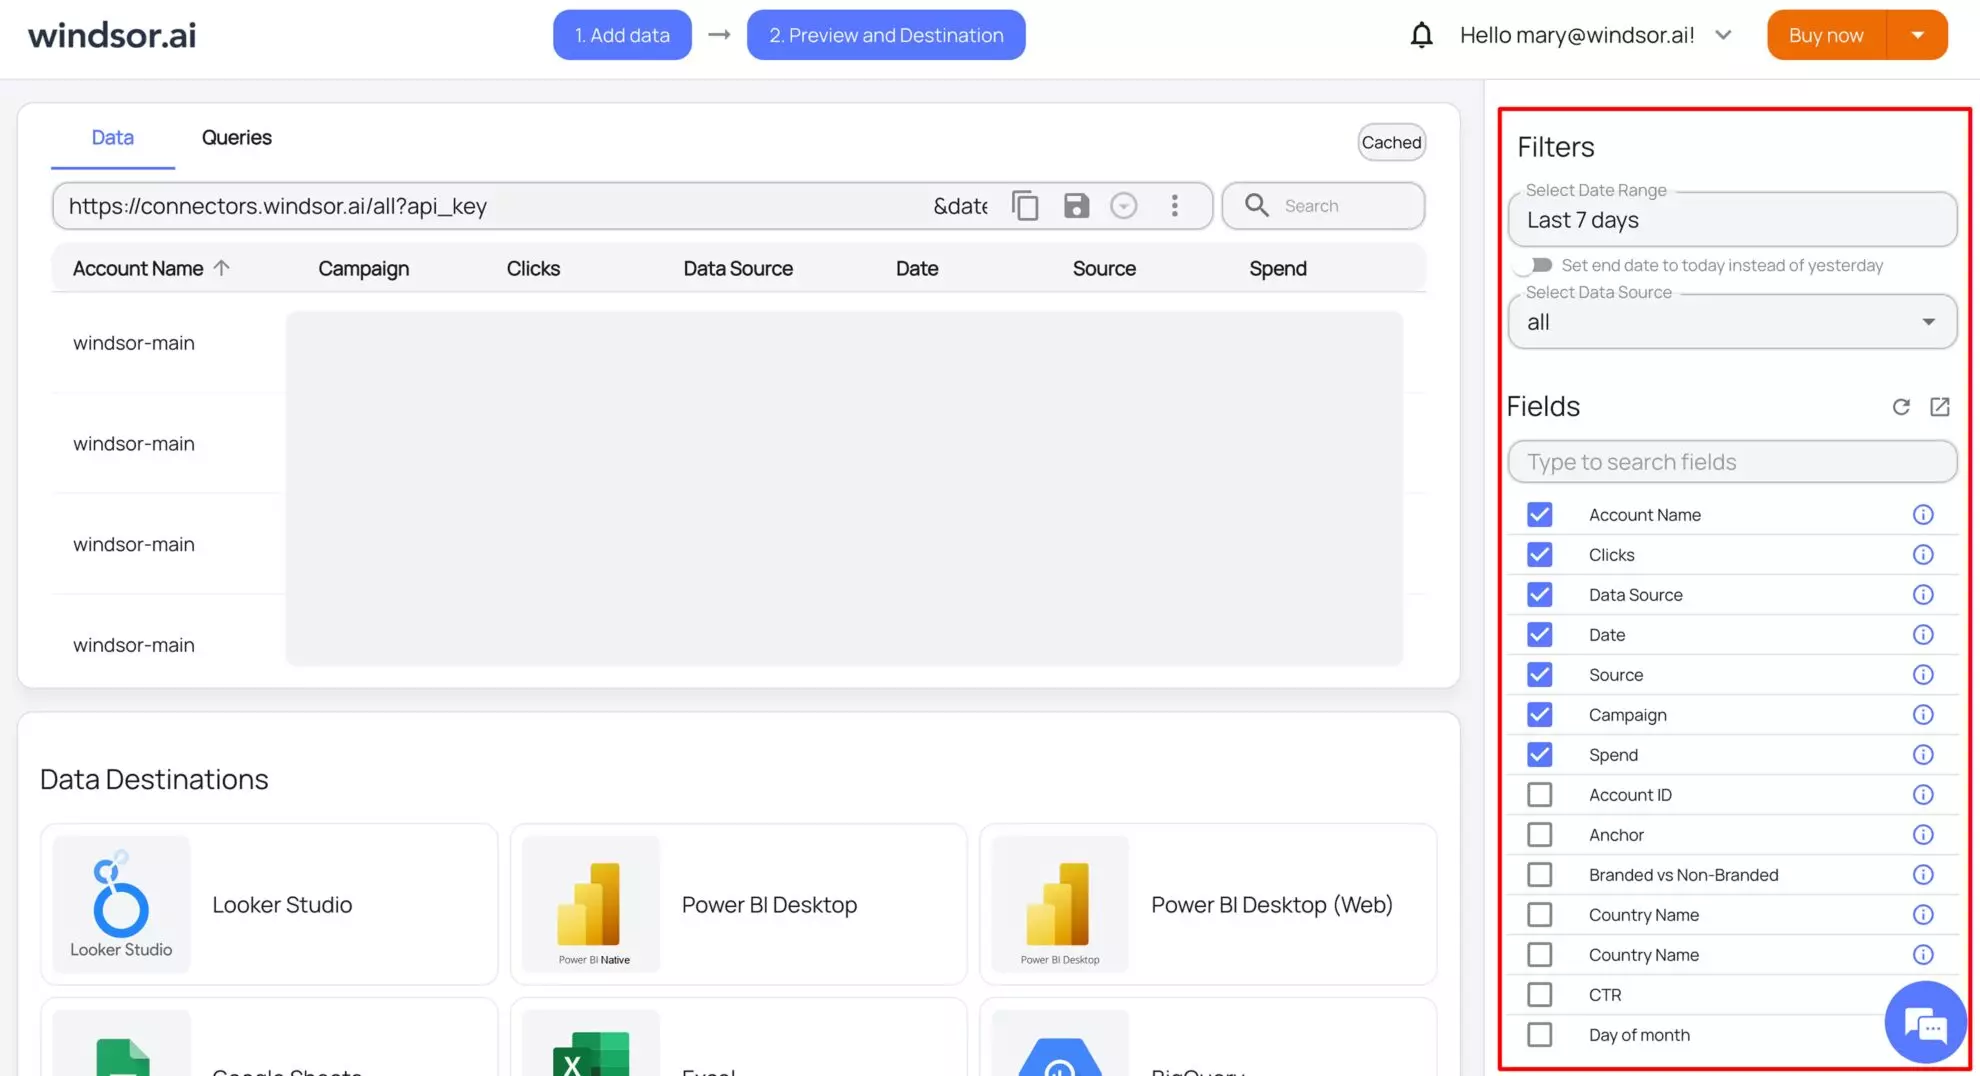
* Search for a specific field by name if it is not automatically included.
You can also add a new custom field if it’s not shown by default.
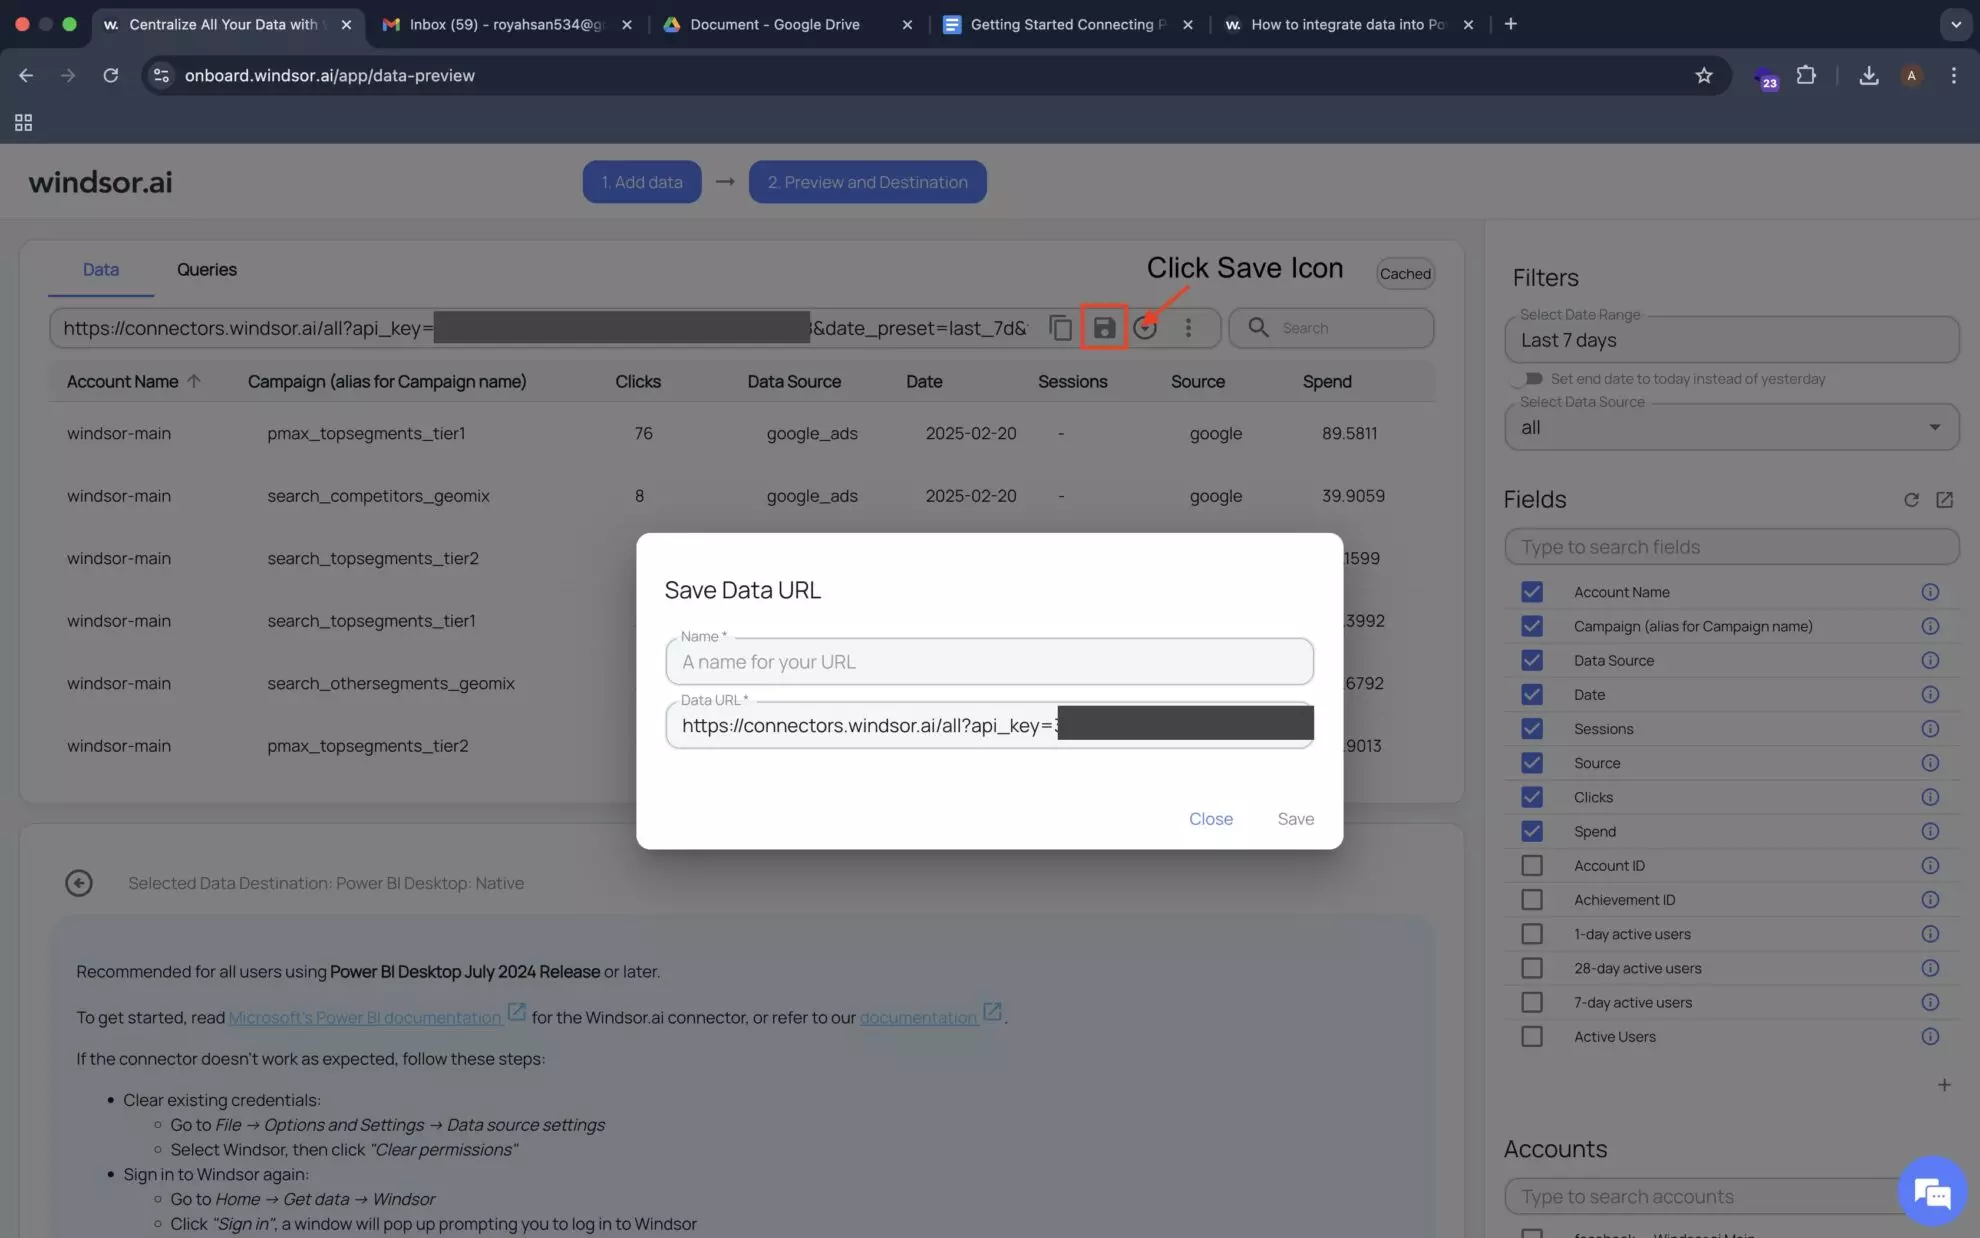
4. Now, save your query in the top field and give it a “Name” (it can be anything).
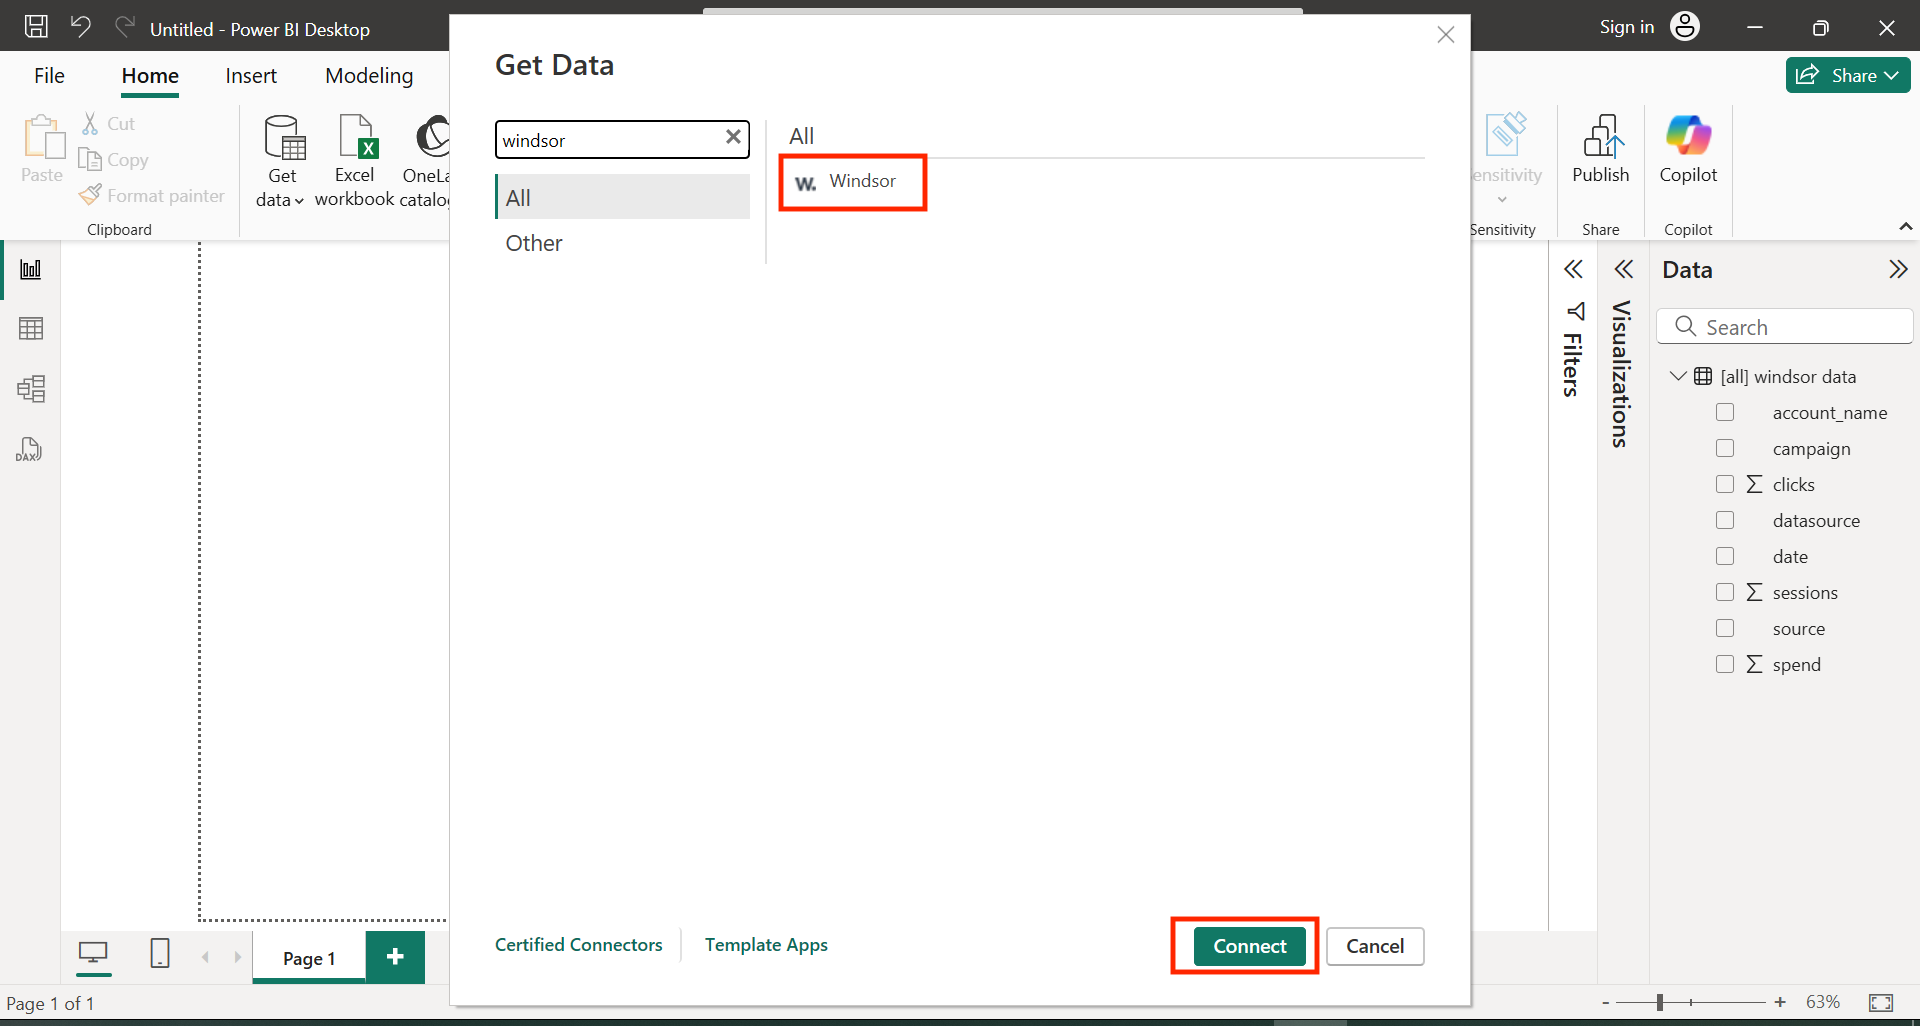
5. Open Power Query and click on “Get Data.”
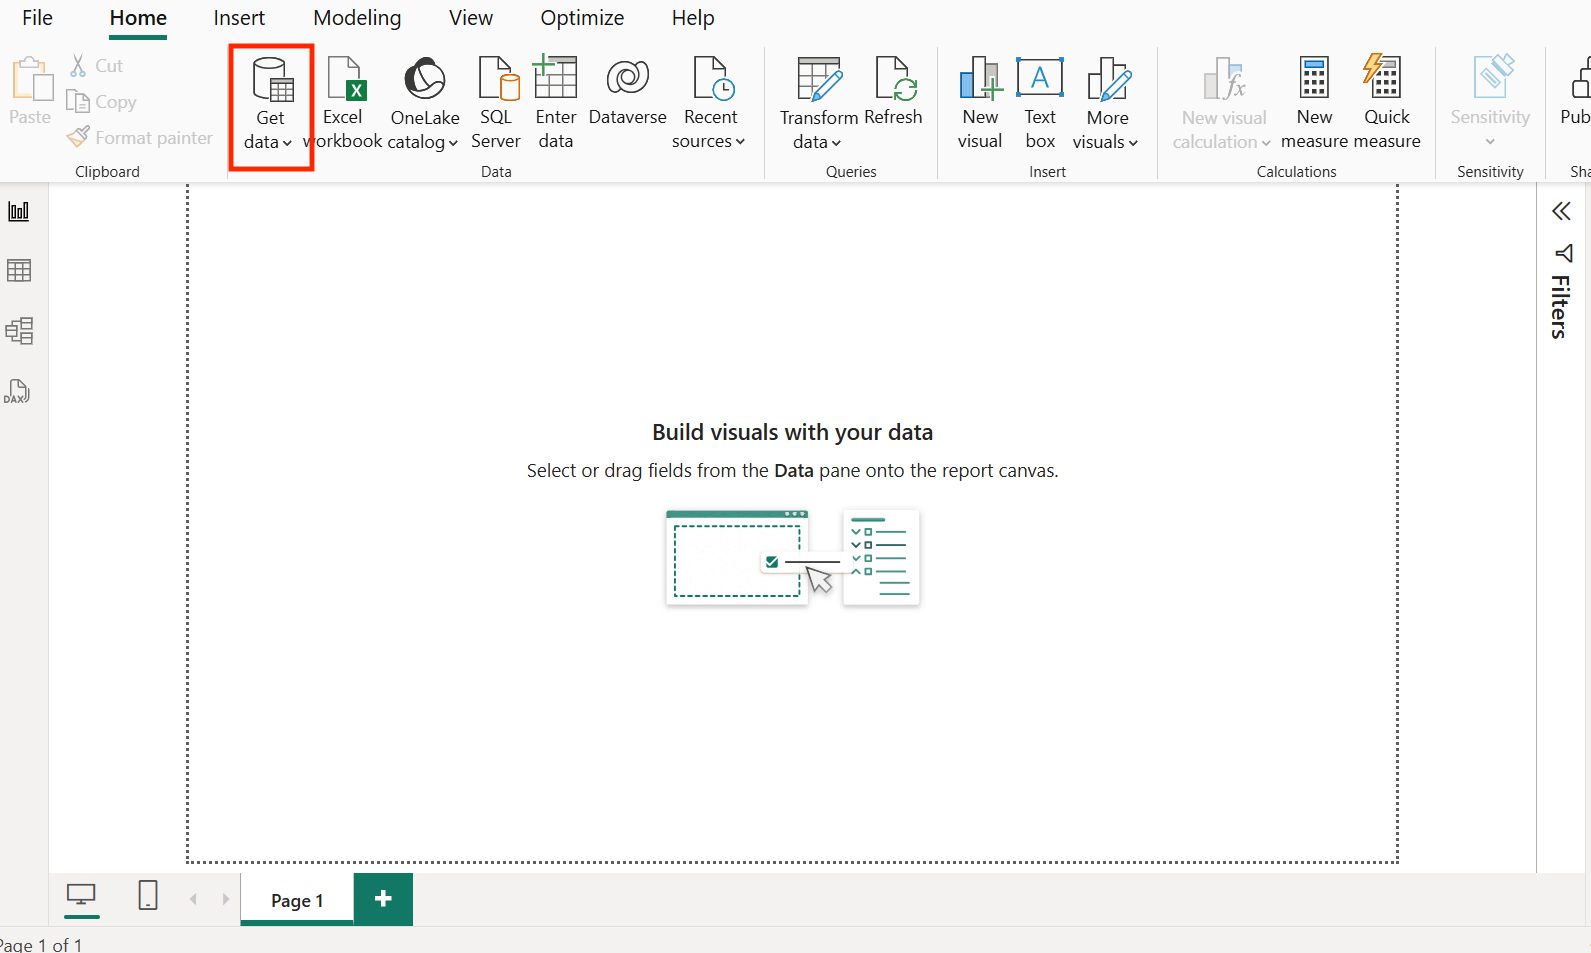
6. Search for the “Windsor” native connector for Power BI, select it, and click “Connect.” Log in to windsor.ai if prompted.
7. Once the Navigator dialog box loads, you can preview all the queries you saved in your Windsor account. Select the checkboxes next to any queries with data you’d like to use for your report.
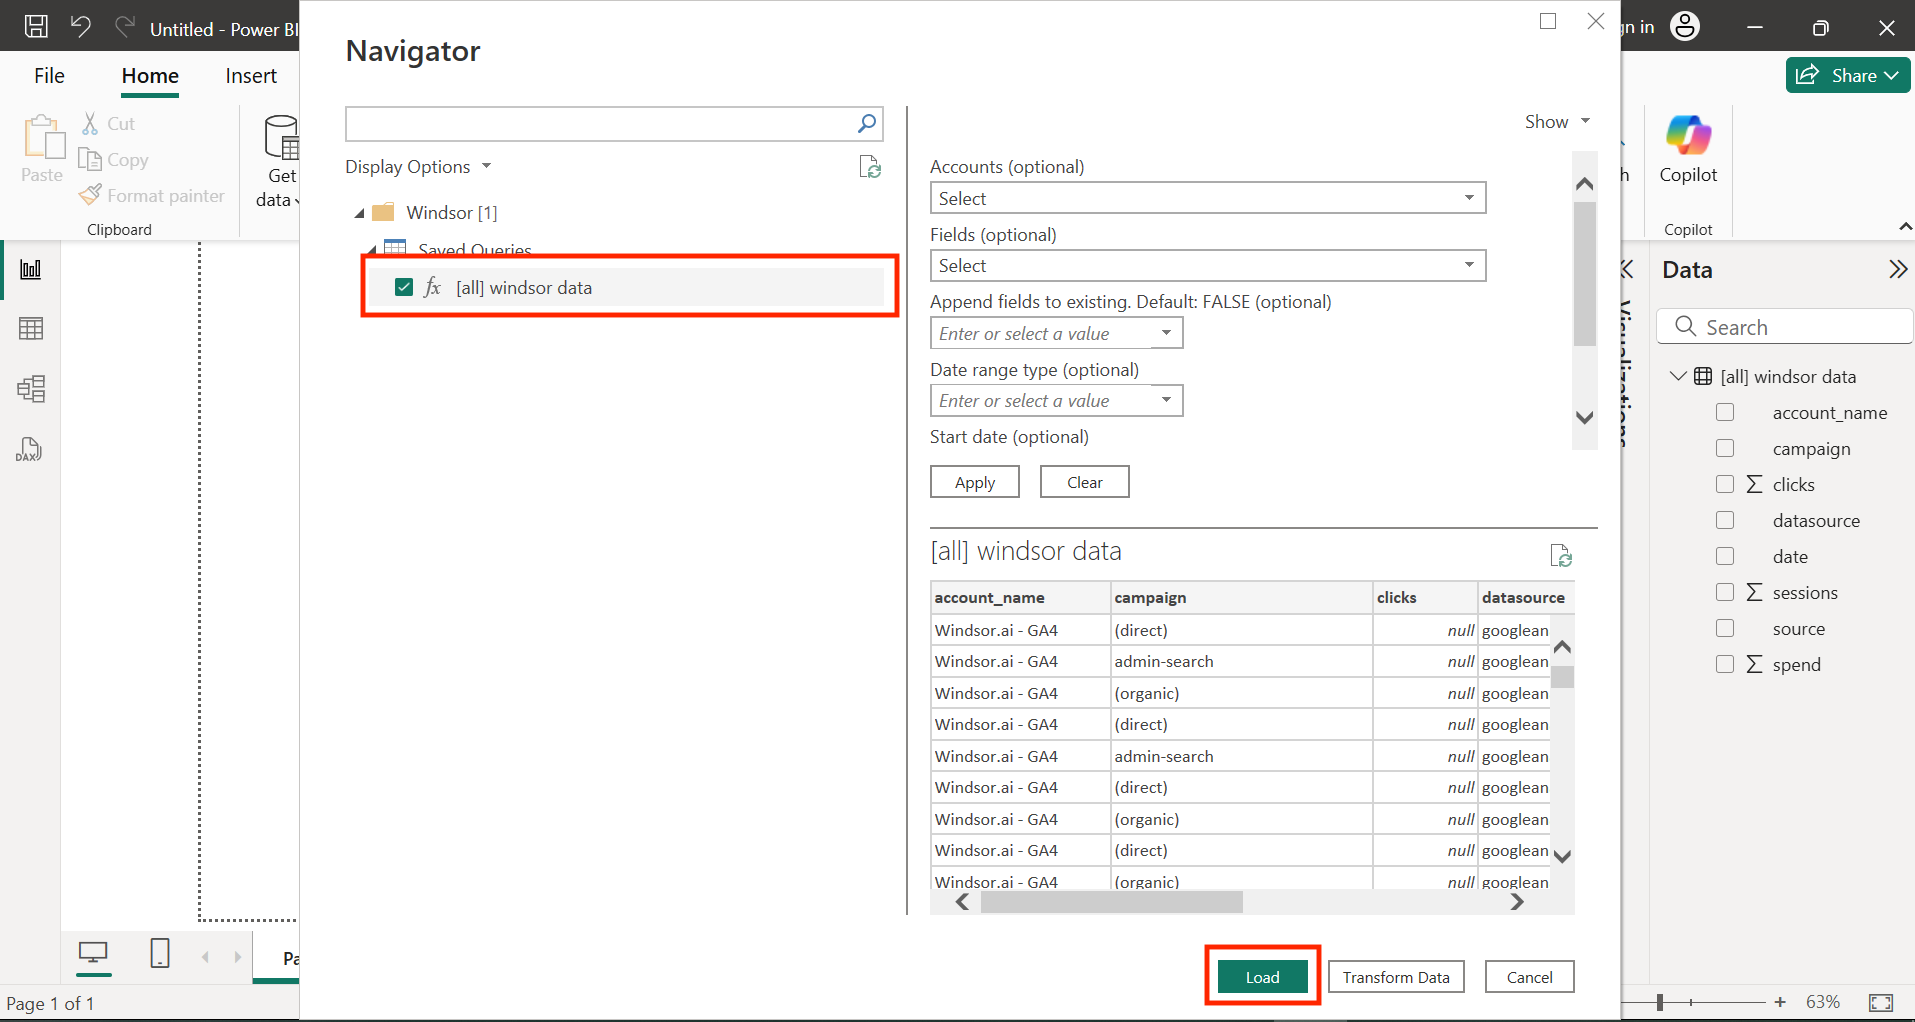
The preview loads with the saved query settings. However, you can make some changes before loading the data to your report by using the settings above the preview:
- Under Accounts, you can choose a different set of accounts for the same query settings. Select Ok and Apply to load the preview with the changes.
- You can choose a new set of fields using the Fields dropdown. Remember to select Ok and Apply the changes.
- You can append selected fields to existing ones by setting Append fields to existing to TRUE.
- If you want to check the data for a different time period than the one specified in the saved query, select the necessary option in the Date range type or Start date/End date field and select Apply. When you select options like This month or Year to date, the refreshes always bring the latest data to your report. When you leave the End date empty, and it isn’t set in the query. Today’s date is used internally, and refreshes bring the latest data to your report.
If you make changes to only one of the fields, other settings remain the same as you saved them in Windsor.ai.
Once you see the dataset you’d like to use, click “Load” to use it in Power Query, or “Transform Data” to refine it in the Power Query editor first.
8. Go to the “Table View” from the sidebar and select your data table from the “Data” section on the right. You’ll see the data streamed from windsor.ai.
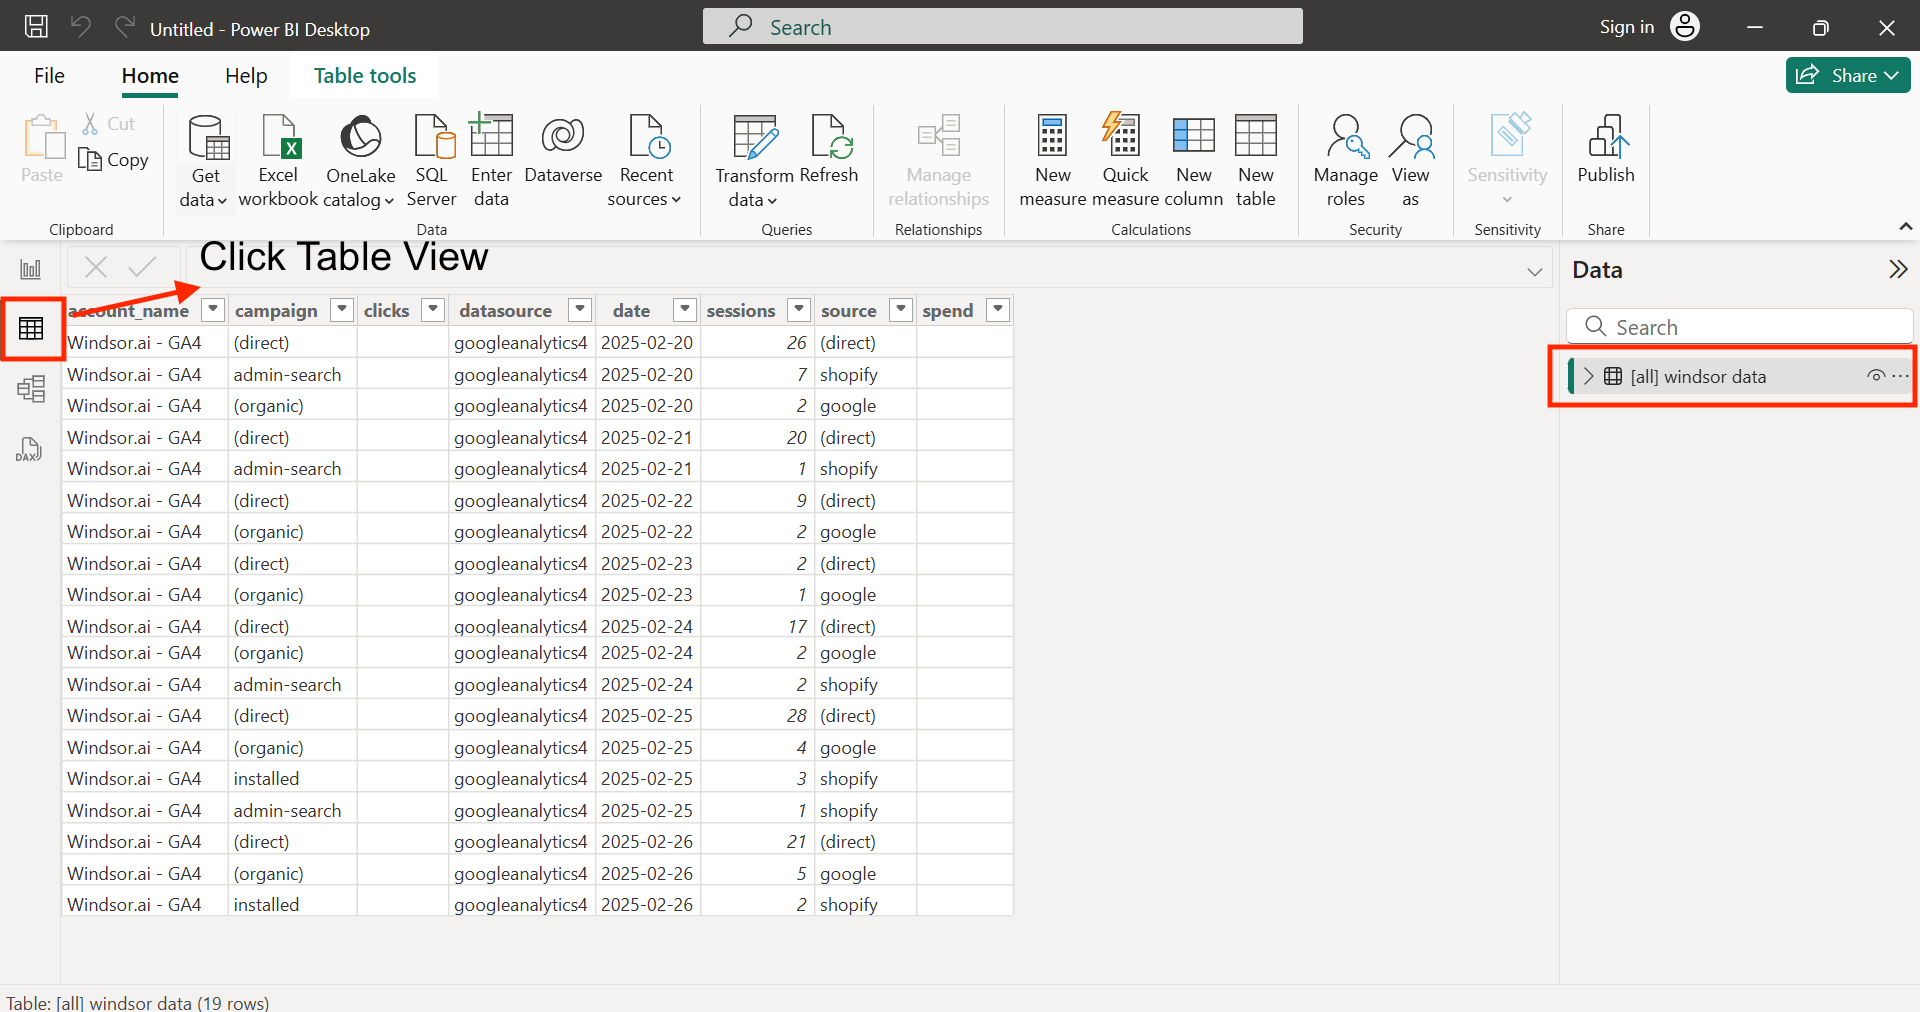
Congratulations, you’ve connected your Power BI desktop app with Windsor.ai. You can now visualize your data in Power BI in the preferred way.
Known issues and solutions
1) Expression.Error: Empty response, please check your query at onboard.windsor.ai/app/data-preview
Possible reason and solution:
- The data is missing for the selected query. Check that this query works and shows data in your Windsor.ai account.
2) Expression.Error: Error
Possible reason and solution:
- The data source was disconnected. Check that the data source is connected in your Windsor.ai account. Select Show only connected to show the data sources you have connected.
How to connect your data to Power BI Web with Windsor.ai
1. Similarly to the Power BI Desktop integration method, you start by connecting your data source(s) to Windsor.ai and selecting the account(s) from which you want to pull data.
2. Then, you customize your query by selecting the required reporting date range, fields, and optionally, filters.
3. Scroll down and select Power BI Web from the list of Data Destinations. Copy your query URL from the instructions below.
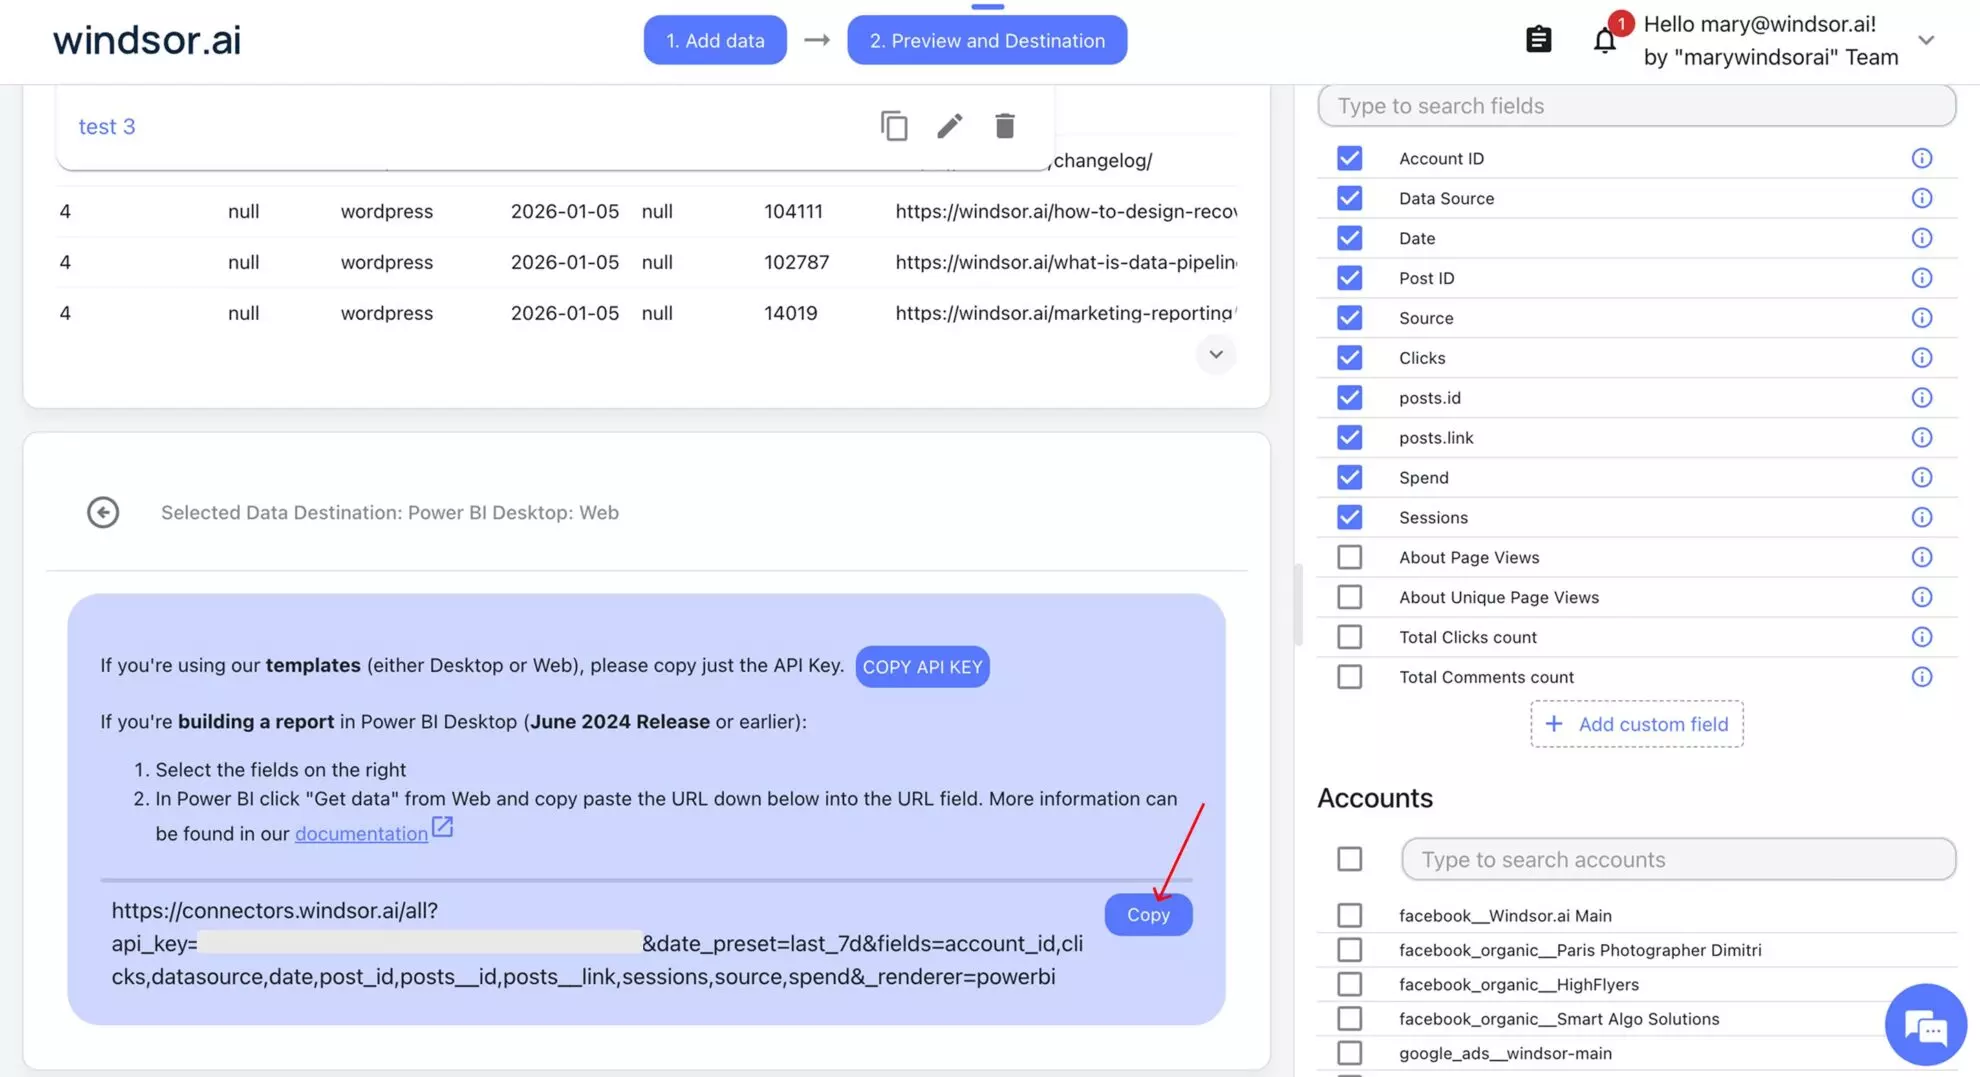
4. In Power BI, go to Get Data → Web, paste your copied query URL, and click Ok.
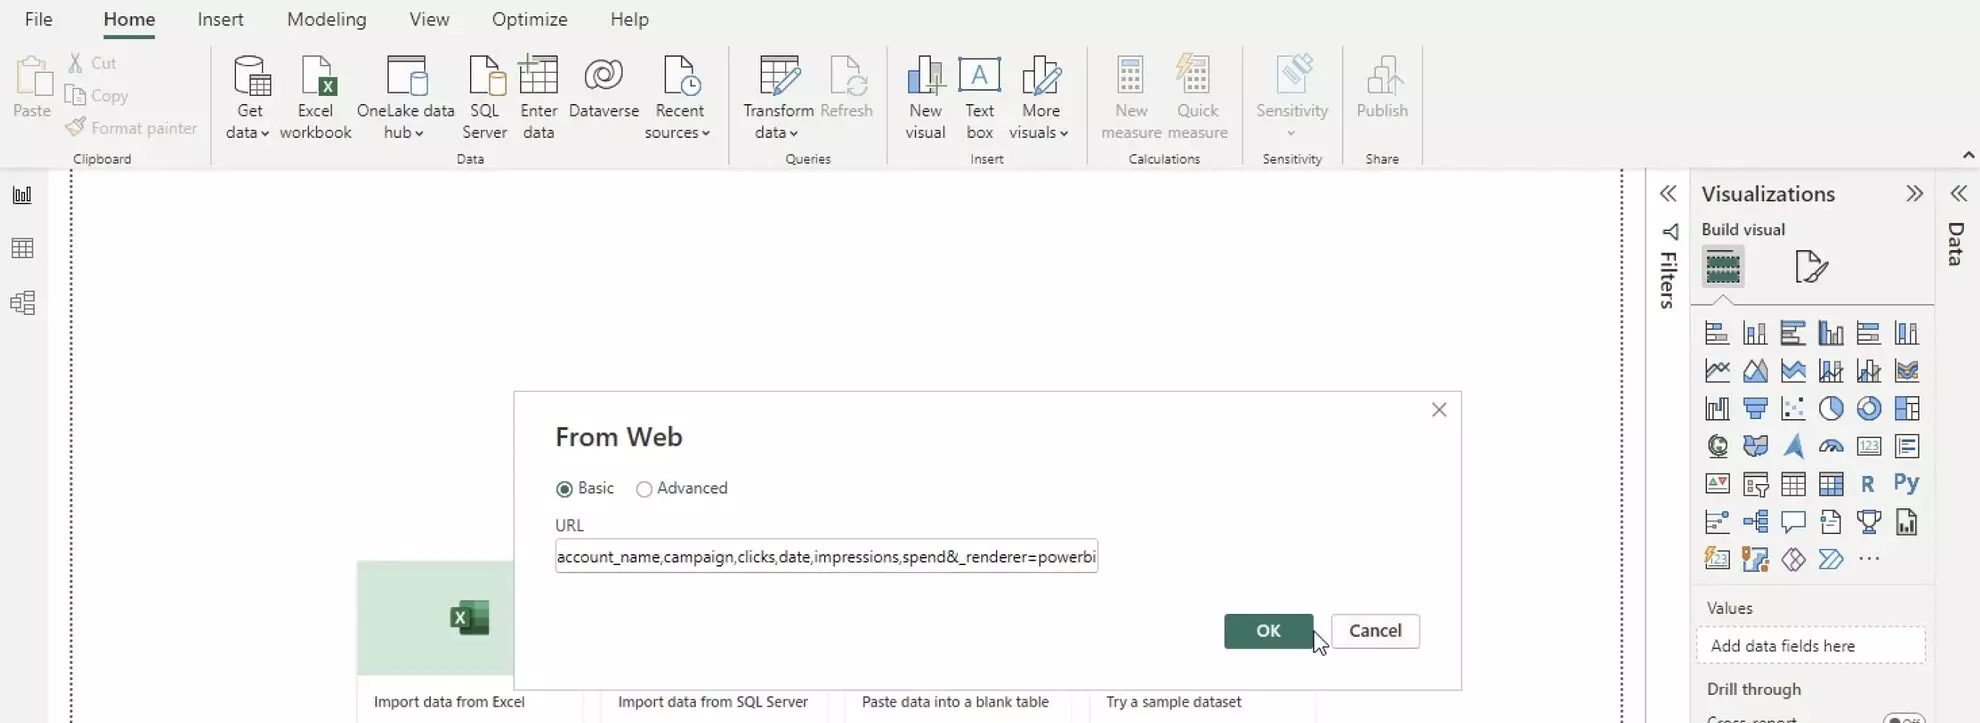
Let the dashboard auto-load your data within a minute.
How to get your Windsor.ai Power BI API key
After selecting Power BI as a destination for your data, you’ll see your API key provided in the instructions below.

How to use Windsor.ai report templates for Power BI
Using Windsor.ai Power BI templates on desktop
1. Navigate to the Windsor.ai Power BI templates page and pick a suitable template. In this example, we’ll use Google Analytics 4 as our data source.
2. Connect your Google Analytics 4 data to Windsor.ai by signing into the associated Google account and selecting at least one GA4 account you want to extract data from.
3. Click on “Preview and Destination,” choose Power BI Web, and copy your API key.
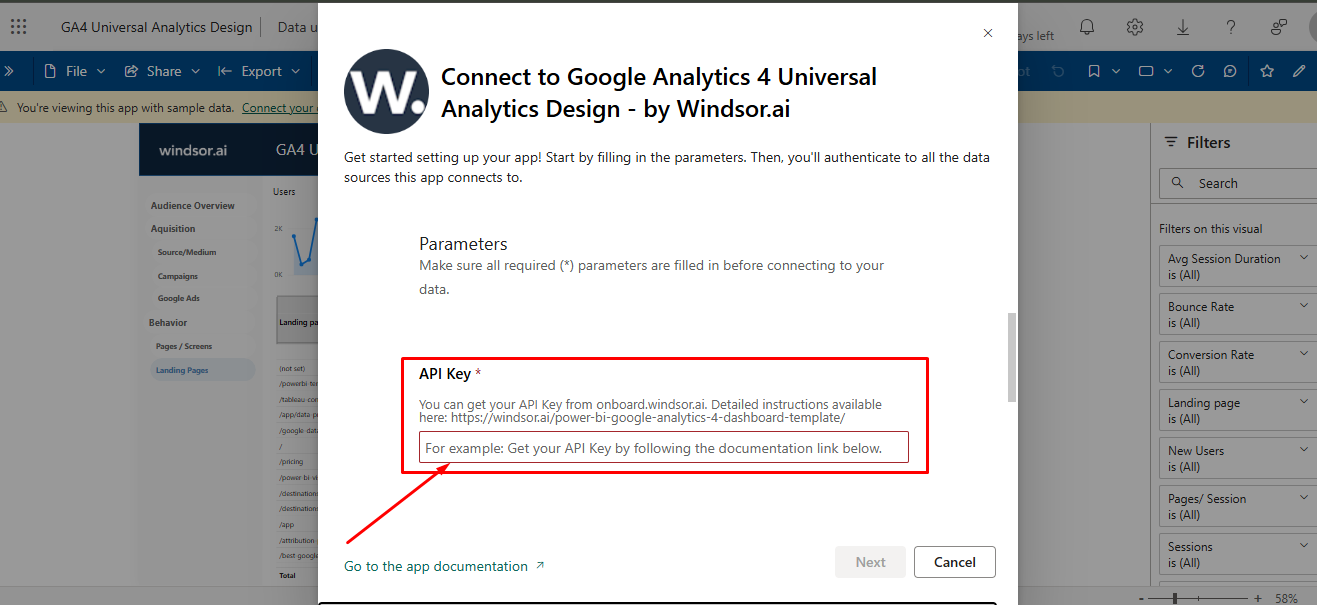
4. Download the selected desktop template from the template page using the provided link and insert your API key on the start screen.
Using Windsor.ai Power BI templates on web
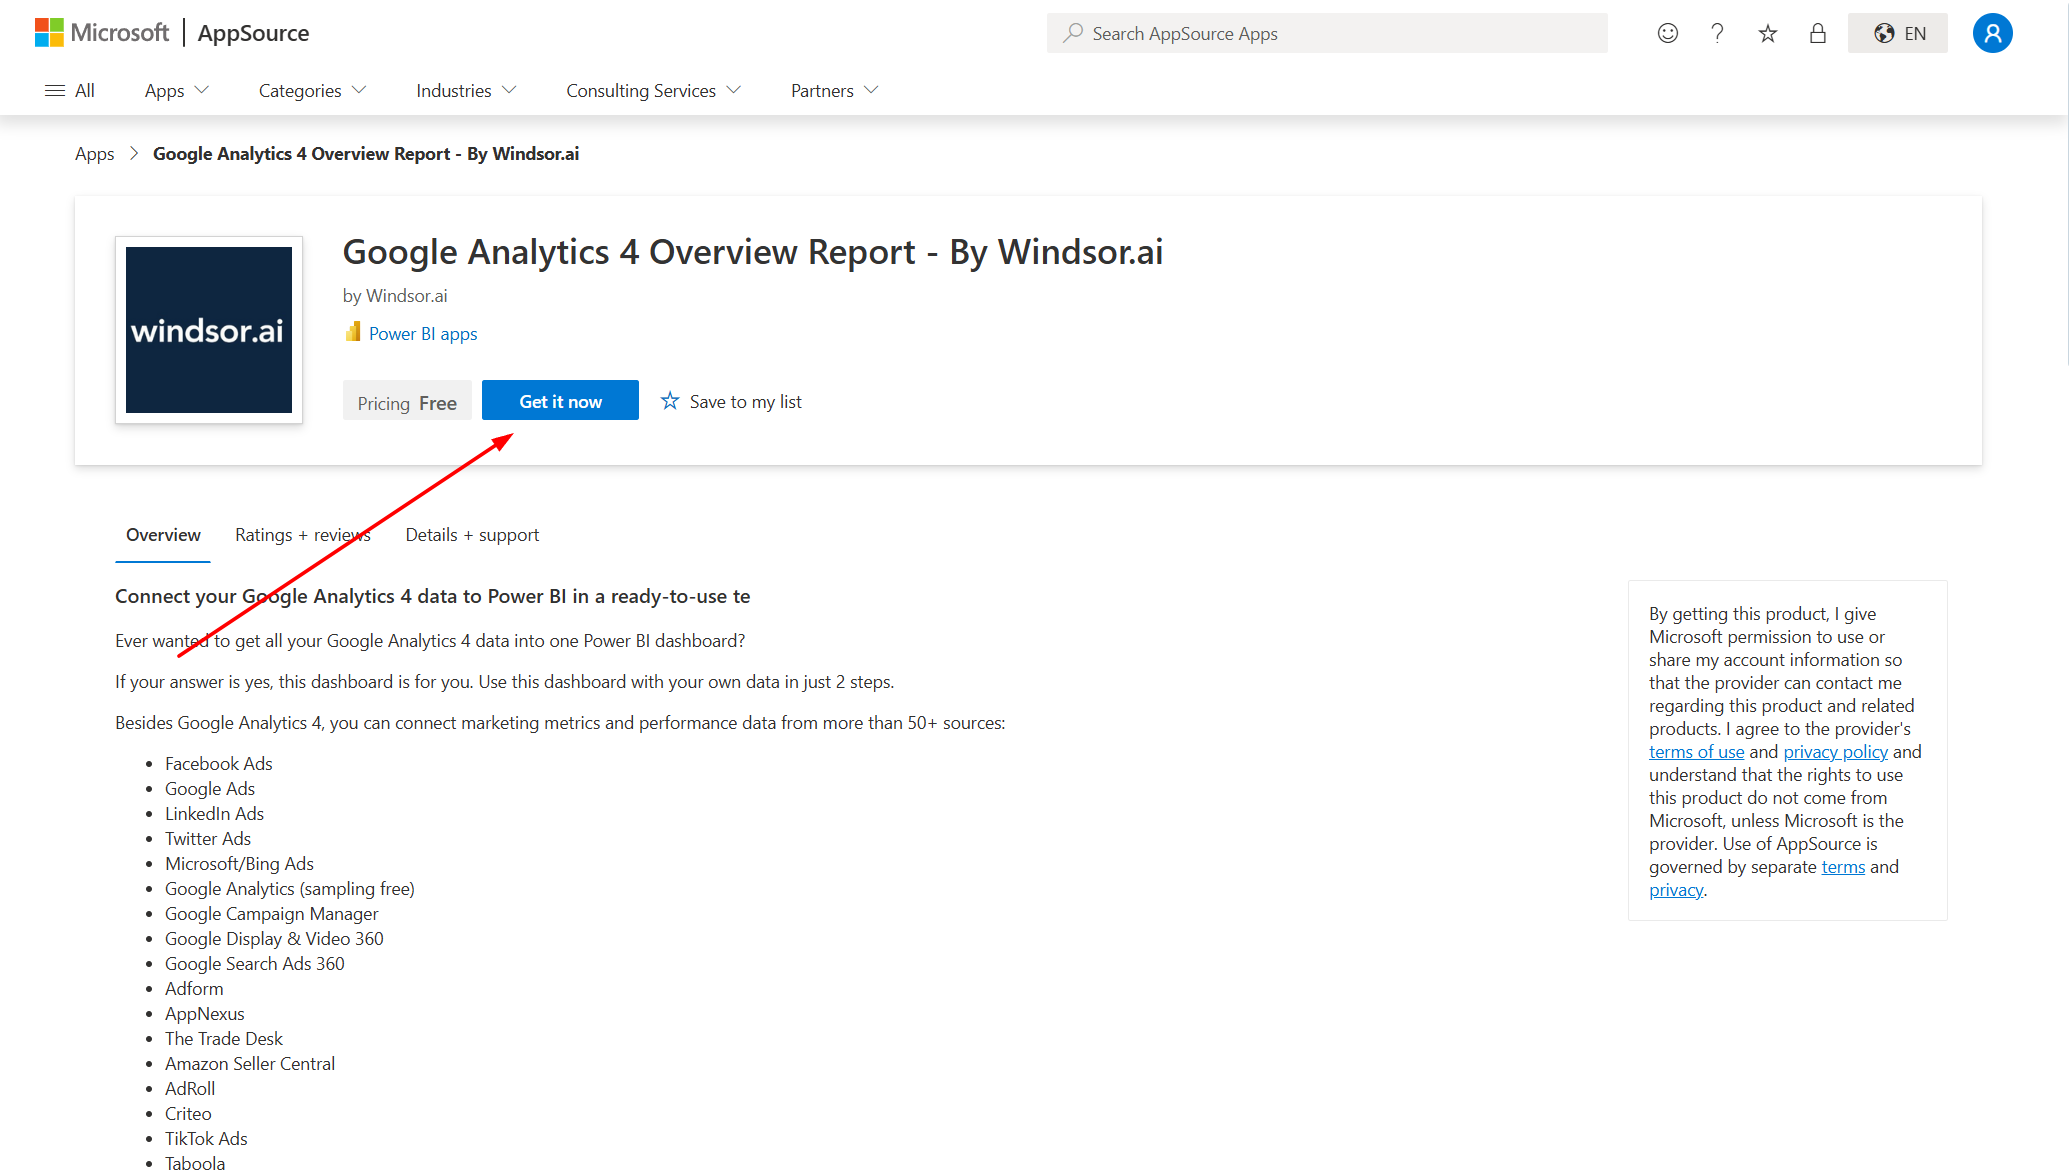
1. Go to the Microsoft AppSource and install the Windsor.ai Power BI report you need.
Let’s use Google Analytics 4 as our data source again.
2. Connect your Google Analytics 4 data to Windsor.ai by signing into the associated Google account and selecting at least one GA4 account you want to extract data from.
3. Click on “Preview and Destination,” choose Power BI Web, and copy your API key.
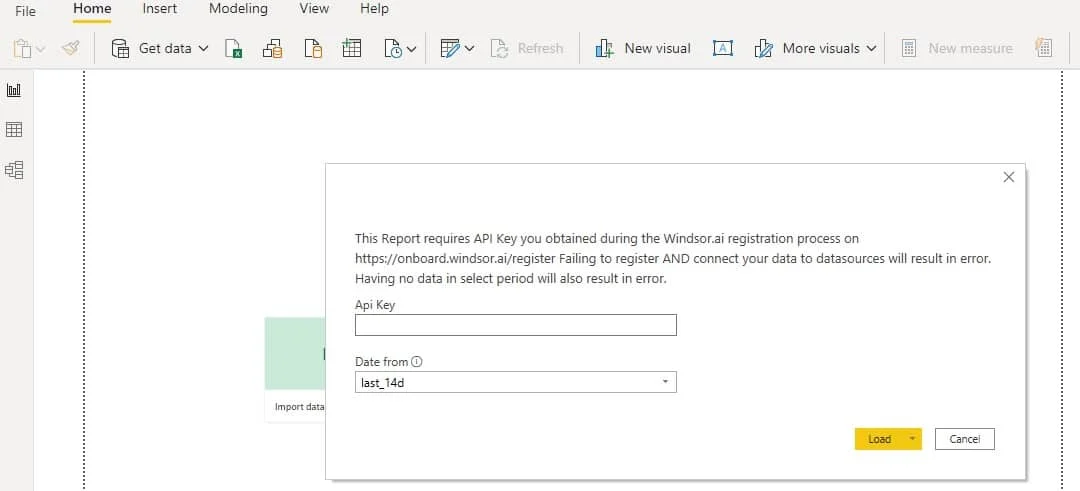
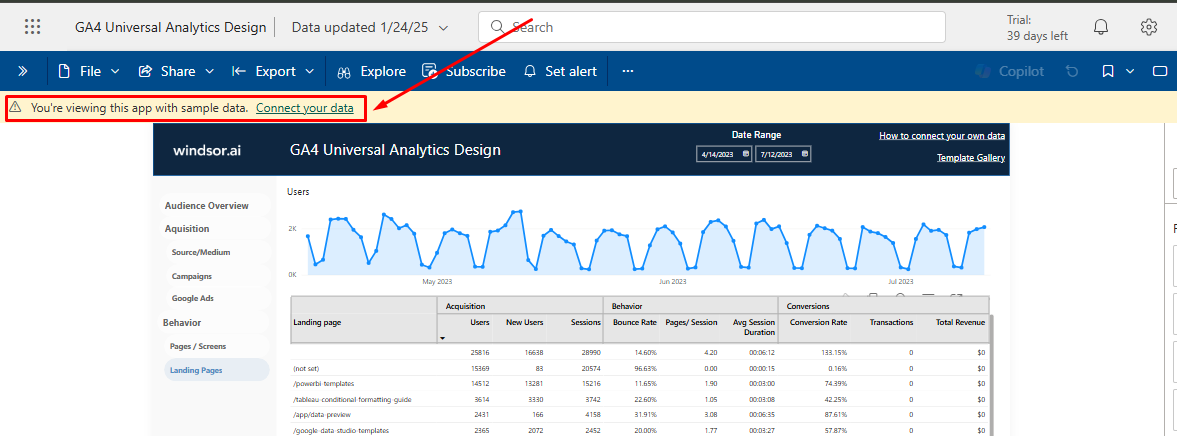
4. Open the installed template and click “Connect your data.”
5. Enter your API key copied from the Windsor.ai account and set the required data range. Click “Next.”
Your data should be loading now. Depending on your data size, this may take up to 2 minutes.
FAQs
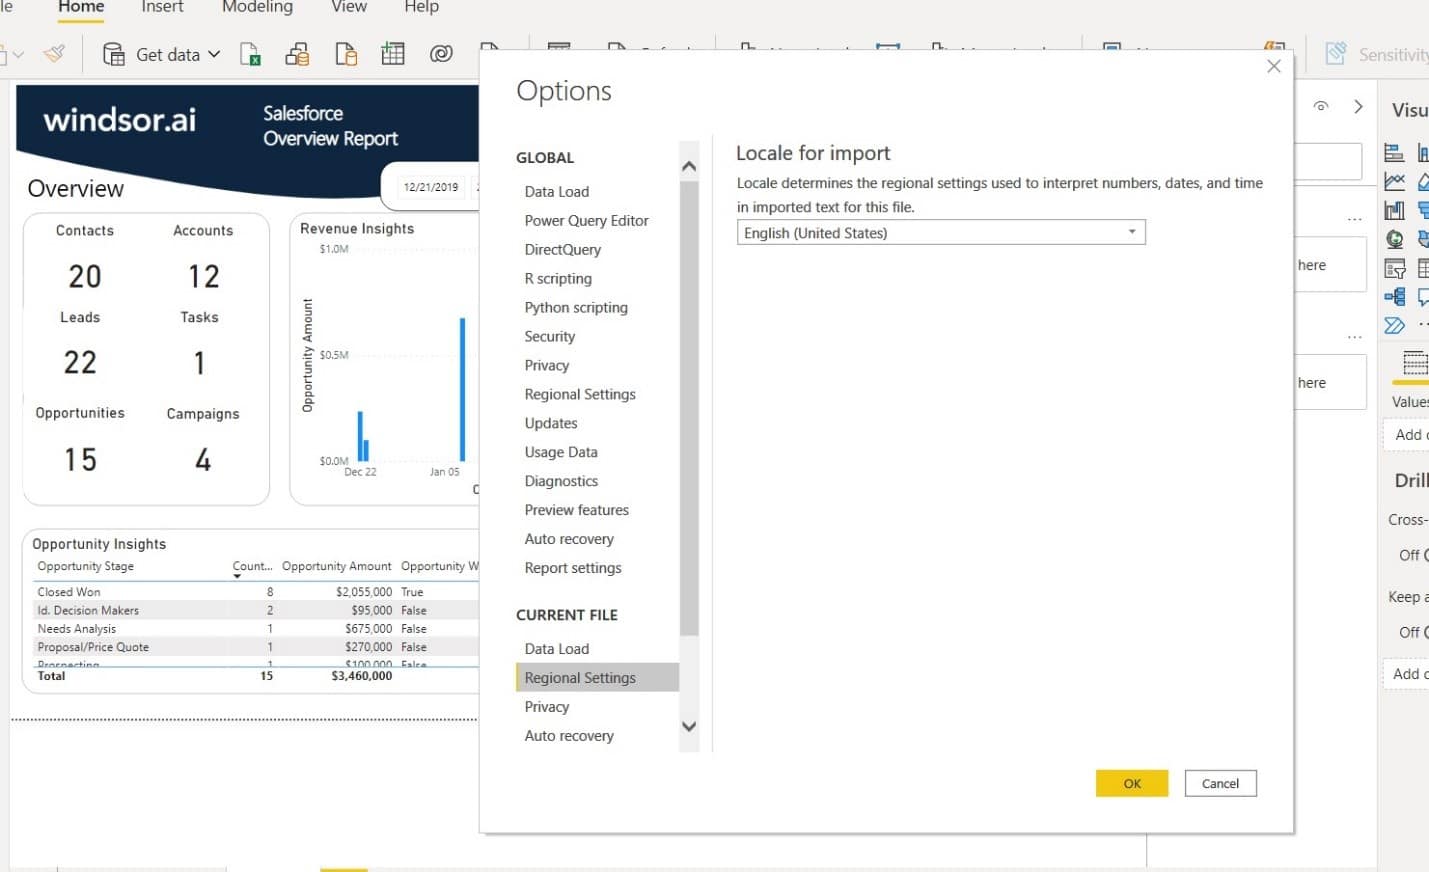
Why are my numbers multiplied on the Power BI Desktop?
If your PC is in a non-English locale, values may be multiplied. For example, a Western European locale would format the number 1.00 wrongly as it would expect the number to look like this: 1,00. You will need to change the locale in the Power BI settings to English (United States).
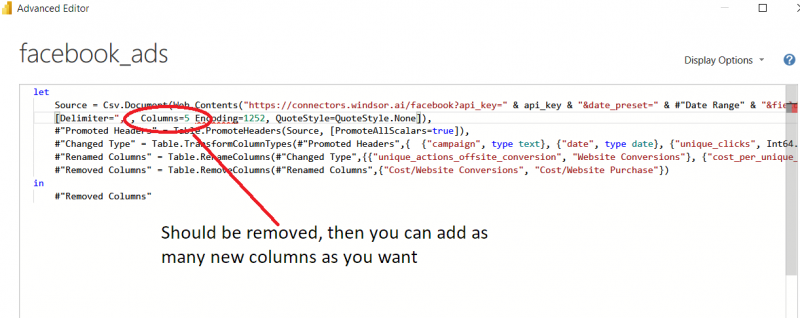
How can I add new fields to the Source statement?
To add new fields to the existing report, you must remove the parameter “Columns=nnn” from the Source statement in Advanced Editor in Power BI Desktop.
How do I work with date ranges (absolute and relative)?
Relative date ranges
When you finish building your query, you will see a URL like this:
 &date_preset=last_28d: means that you are working with a relative date range of 28 days.
Valid values for relative date ranges are:
- last_1d
- last_3d
- last_7d
- last_14d
- last_28d
- last_30d
- last_90d
- last_180d
- this_month
- last_year
You can change the values accordingly to change the relative date range.
Absolute date ranges
To work with absolute (fixed) date ranges, you can select the necessary dates in the date range picker in the right-side menu of your Windsor.ai dashboard:

In this way, the query https://connectors.windsor.ai/all?api_key=[API_KEY]&date_from=2023-01-17&date_to=2023-01-24&fields=account_name,campaign,clicks,date,spend&_renderer=powerbi
will load the date range
&date_from=2023-01-17&date_to=2023-01-24
You can now manually modify this to adjust your query.
To only set a start date and default to today’s date as the end date, you simply remove the date_to from the URL.
The query then would look like this:
https://connectors.windsor.ai/all?api_key=[API_KEY]&date_from=2023-01-17&fields=account_name,campaign,clicks,date,spend&_renderer=powerbi
How can I refresh data sources?
To enable auto-refresh, push your Power BI Desktop report to Power BI Web and then go to the Datasets -> Dataflow settings.

Click on “Edit credentials.”

Then, use the following settings and click “Sign In.”

You can also select the refresh interval.

Now, the auto-refresh should work properly.
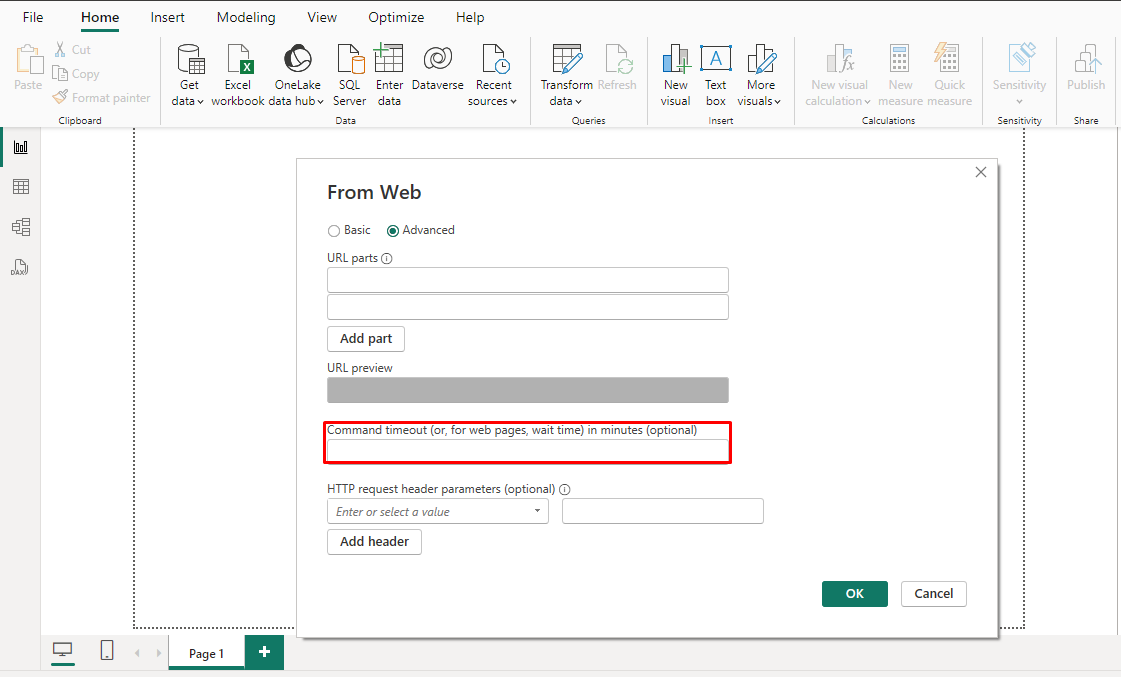
How can I increase the default timeout in Power BI?
Timeouts can cause issues with loading longer date ranges. To change the default timeout please follow the steps below:
1. In Power BI, click “Get data” from the Web and copy/paste the API URL. Then click on the Advanced tab.
2. Increase the Command timeout in the minutes setting.
Tired of manually transferring data to Power BI? Try Windsor.ai today to automate the process

