 Destinations
 Data sources
 AI insights
 About us
 Careers
 Security
 Customer reviews
 Contact us
 Affiliate program
 Solution partners
 Template gallery
 Looker Studio templates
 Power BI templates
 Excel templates
 Google Sheets templates
 Tableau templates
 Facebook Ads templates
 Google Ads templates
 Data fields & Metrics
 AI prompt library & Guides
 Product documentation
 API documentation
 Case studies
 Blog
Blog Data models
 Windsor vs Supermetrics
 Windsor vs Funnel.io
 Windsor vs Fivetran
 Windsor vs Rivery
 Windsor vs Portermetrics
 Windsor vs Coupler.io
 Last updated: 31 August 2026




This HubSpot Overview Dashboard Template for Power BI helps you to visualize your own HubSpot data in Power BI in a few clicks.
Follow the steps outlined below to get your data connected.
The template is available both as
Power BI Web Template
- Connect your HubSpot Data to Windsor.ai
Register for free or login if you already have an account.
- Choose HubSpot from the left-side menu, click on “Grant HubSpot Access” then follow the steps in the pop-up to sign-in and grant the required permissions.
- Select at least one HubSpot account from the drop-down.
- Click on Preview and Destination, choose Power BI Web, then copy your API Key. IMPORTANT: Make sure you copy just the API Key (by selecting Power BI Web as a destination) and not the entire connection string (which is visible when selecting Power BI Desktop as a destination).
- Install the Power BI Web App
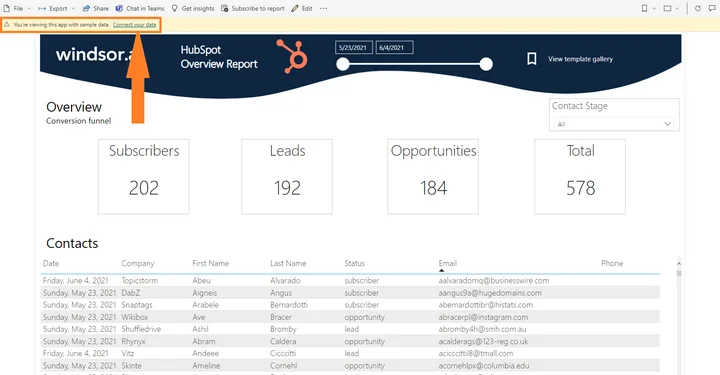
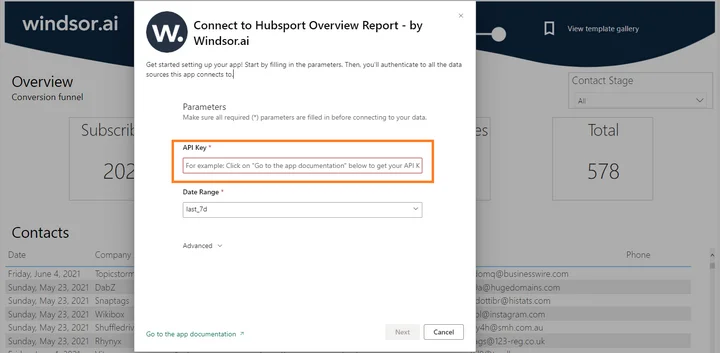
- Click on Connect in the Connect your data section

- Enter your API Key from Step 4.

- On the next screen click on Sign In
- Your data should be loading now. Depending on your data size this may take a minute or two.
Power BI Desktop
- Connect your HubSpot Data to Windsor.ai
Register for free or login if you already have an account.
- Choose HubSpot from the left-side menu, click on “Grant HubSpot Access” then follow the steps in the pop-up to sign-in and grant the required permissions.
- Select at least one HubSpot account from the drop-down.
- Click on Preview and Destination, choose Power BI Web, then copy your API Key. IMPORTANT: Make sure you copy just the API Key (by selecting Power BI Web as a destination) and not the entire connection string (which is visible when selecting Power BI Desktop as a destination).
- Download the Desktop Template
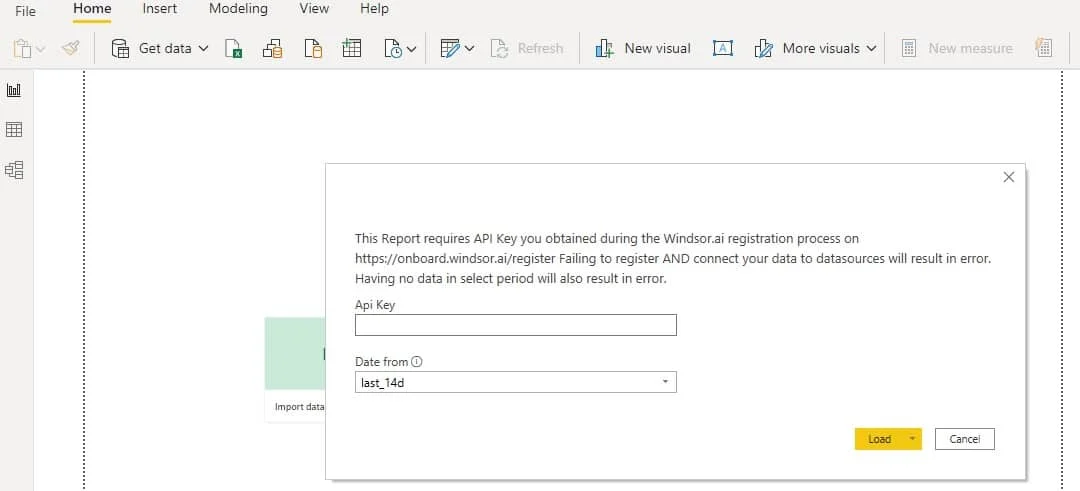
- When opening the template, on the start screen, paste your API Key from step 4:
Power BI HubSpot Overview Dashboard Template: metrics and dimensions
Below are the predefined metrics and dimensions available in the template. However, you can any other field you need in the connection string.
Dimensions:
-
- Date
- Company
- First Name
- Last Name
- Status
- Phone
- Contact Stage
Metrics:
-
- Subscribers
- Leads
- Opportunities
- Total
The Power BI HubSpot Overview dashboard template can be customized with > 500 different dimensions, breakdowns and metrics. Head here to see a complete list: available metrics and dimensions.
It queries the data through our connector and makes it available in real-time.

Get started for free
Access all your data from your favorite sources in one place.
Free forever plan, no credit card


