 Destinations
 Data sources
 AI insights
 About us
 Careers
 Security
 Customer reviews
 Contact us
 Affiliate program
 Solution partners
 Template gallery
 Looker Studio templates
 Power BI templates
 Excel templates
 Google Sheets templates
 Tableau templates
 Facebook Ads templates
 Google Ads templates
 Data fields & Metrics
 AI prompt library & Guides
 Product documentation
 API documentation
 Case studies
 Blog
Blog Data models
 Windsor vs Supermetrics
 Windsor vs Funnel.io
 Windsor vs Fivetran
 Windsor vs Rivery
 Windsor vs Portermetrics
 Windsor vs Coupler.io
 Last updated: 31 August 2026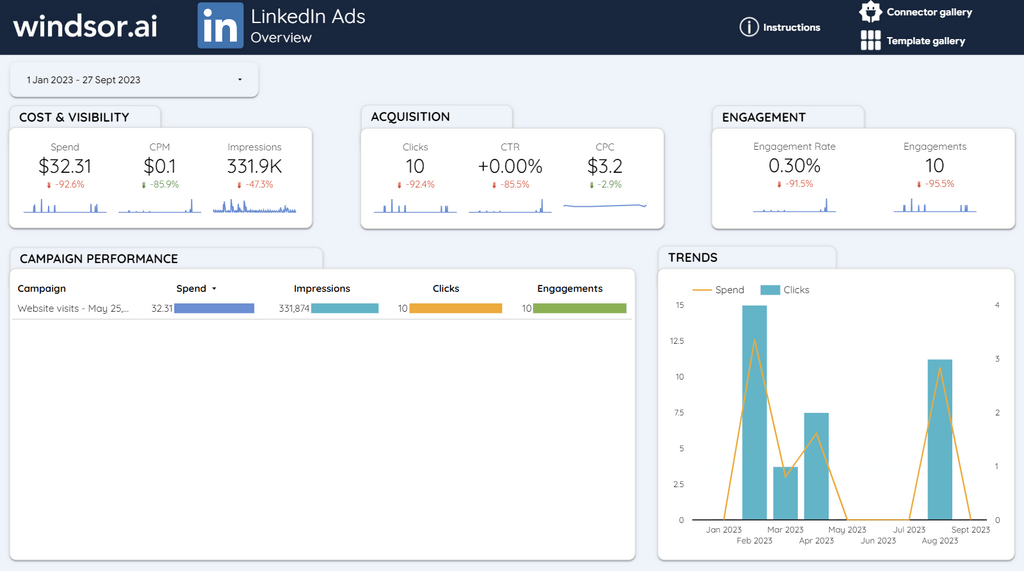




This template helps you to visualize your LinkedIn Ads performance in Looker Studio in a few clicks.
Follow the steps outlined below to get your data connected.
How to use it
- Click on this link to open the template
- Make a copy of it (File -> Make a copy)
- For the new data source select CREATE NEW DATA SOURCE
- Under COMMUNITY CONNECTORS, go to EXPLORE CONNECTORS. Search for “LinkedIn Ads by Windsor.ai” and add the connector.
Covered Topics
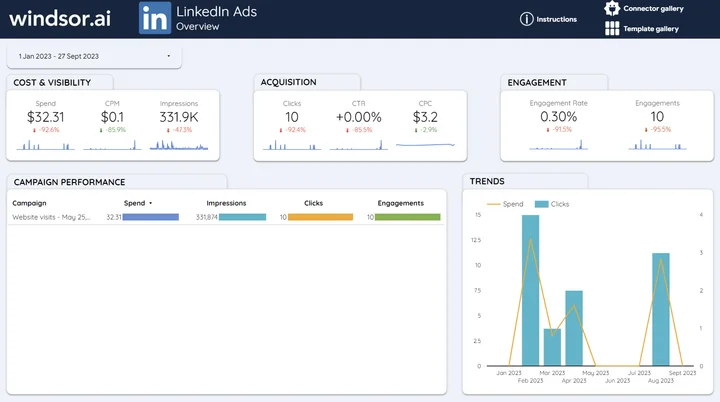
1. Overview Page
2. Campaigns Performance Page

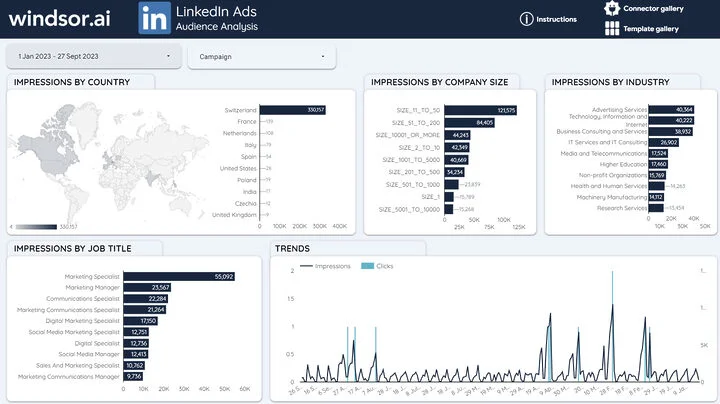
3. Audience Analysis Page
Questions that can be answered by using this template
- How much are you spending on LinkedIn Ads?
- Which are your best & worst performing LinkedIn Ads campaigns? How do they compare in terms of Spend, CPM, CTR and Engagement Rate?
- Who is your audience? Where are your viewers located, what kind of companies they work in (size and industry) and what’s their job title?
If you are interested in integrating other channels or your analytics data together with your LinkedIn Ads data, please check out our Marketing Template Gallery.

Get started for free
Access all your data from your favorite sources in one place.
Free forever plan, no credit card


