 AI insights
 About us
 Careers
 Security
 Customer reviews
 Contact us
 Affiliate program
 Solution partners
 Looker Studio templates
 Tableau templates
 Facebook Ads templates
 Google Ads templates
 Data fields & Metrics
 AI prompt library & Guides
 Product documentation
 API documentation
 Case studies
 Blog
Blog Data models
 Windsor vs Supermetrics
 Windsor vs Fivetran
 Windsor vs Portermetrics
 Last updated: 30 October 2025

Launched in 2022, Looker Studio has quickly gained popularity – and that’s for good reason. It’s free to use and lets you create powerful marketing dashboards that visualize your data exactly how you want.
What’s more, it’s extremely easy to start, especially with ready-made Looker Studio examples and no-code data connectors from Windsor.ai. Our platform allows you to sync data from various sources and build custom Looker Studio dashboards in minutes.
In this guide, we’ll share the best Looker Studio examples and walk you through the process step-by-step.
15 Top Looker Studio Dashboard Examples to Take Your Analytics to the Next Level
Looker Studio examples by category:
Multi-channel dashboard examples
Marketing channel dashboard examples
Looker Studio examples for organic insights

Try Windsor.ai today
Access all your data from your favorite sources in one place.
Get started for free with a 30 - day trial.
Multi-channel Looker Studio dashboard examples
Let’s start with multi-channel dashboards, which are powerful analytics tools. They provide a unified view of your overall business performance and help you fine-tune your marketing strategy by showing where to reallocate budgets across channels for maximum impact.
Below, you can find a few comprehensive multi-channel Looker Studio dashboards from Windsor.ai.
Multi-Channel Dashboard Example for Looker Studio (Google Ads, Facebook Ads, LinkedIn Ads, Bing Ads)

This Looker Studio dashboard helps you visualize data from all your advertising channels in an easy-to-understand format—without the need to dive deep into each channel’s details. It’s ideal for agencies reporting to clients or internal teams. The template enables you to compare campaign performance across platforms and provides a centralized attribution report of your spending.
By default, this template connects to Google Ads, Facebook Ads, LinkedIn Ads, and Microsoft/Bing Ads. You can also add other data sources in minutes using Windsor.ai’s advanced connectors.
You can adjust the level of detail in this report based on your audience. For example, if you’re presenting it to your CEO, you might want to skip information of little interest to senior leadership.
Check out this helpful video for a step-by-step guide on how to connect multiple data sources to your Looker Studio dashboard:
Google Ads & Facebook Ads Dashboard Example for Looker Studio

Google Ads and Facebook Ads are two of the most commonly used advertising platforms. This Looker Studio dashboard example will provide valuable insights into your performance on these platforms, visualizing key metrics like clicks, impressions, conversions, and revenue (where applicable).
This video tutorial will guide you through the setup of your Google Ads & Facebook Ads data reporting without the hassle.
Facebook Ads & Google Ads eCommerce Dashboard Example for Looker Studio

Designed specifically for eCommerce businesses, this Looker Studio dashboard helps you visualize data from Google Analytics, Facebook Ads, and Google Ads. If you’re a digital agency working with eCommerce clients, this template will be a valuable addition to your reporting toolkit.
Marketing Channel Looker Studio Dashboard Examples
If you want to explore the performance of some specific channels in more detail and analyze their best-performing assets, consider applying one of the following templates (we’ve selected Looker Studio dashboard examples for the most popular channels).
Google Ads Dashboard Example for Looker Studio

Click here to set up your copy
This template will give you a complete overview of all Google Ads-related metrics, including clicks and impressions, CTR, cost per click, and top campaigns. It’s pretty straightforward and simple to set up.
Facebook Ads Dashboard Example for Looker Studio

This Looker Studio dashboard example provides insights into all Facebook Ads-related data to help you analyze the performance of your paid campaigns on Facebook and Instagram.
Check out this quick guide to learn how to create a Facebook ads report in Looker Studio in a few easy steps.
Microsoft/Bing Ads Dashboard Example for Looker Studio

Click here to set up your copy
Similar to the Google Ads report, this template will help you visualize all your Microsoft Ads (formerly known as Bing Ads) data.
TikTok Ads Dashboard Example for Looker Studio

This easy-to-customize Looker Studio dashboard example will help you report on your TikTok Ads activities. It covers metrics such as impressions, costs, and conversions and ranks the top campaigns.
LinkedIn Ads Dashboard Example for Looker Studio

Install the Looker Studio Connector: LinkedIn Ad Insights
LinkedIn is the primary advertising channel for most B2B companies. So, if you use LinkedIn to run marketing campaigns, be it for boosting brand awareness, website visits, engagement, or lead generation, this Looker Studio LinkedIn Ads template will be super helpful. It covers most marketing metrics like campaigns, clicks, impressions, and post-click conversions. With some modifications, you can track more parameters based on your needs.
You can get started with this template with just a few clicks. All you need is to connect your LinkedIn Ads account and link the data to Looker Studio using our connector.
Twitter Ads Dashboard Example for Looker Studio

Configure the Looker Studio Connector on Twitter Ads Insights
This Twitter Ads template will help you connect to and visualize your Twitter Ads data in Looker Studio in less than five minutes. However, ensure you can access a Twitter Ads account before you start. During the installation, you must authenticate to Twitter Ads and select one or more accounts.
Google Display & Video 360 (DV360) Dashboard Example for Looker Studio

Configure the Looker Studio Connector: Google Display & Video 360
If you buy media using Google Display & Video 360, DV 360 (formerly known as DoubleClick Bid Manager, DBM), this Looker Studio dashboard example will help you visualize DV 360 reports really quickly. Just connect your DV360 account and get insight into how your video, display, TV, and audio advertising perform.
The default dashboard comes with a basic set of visualized data. You can easily edit it to create your customized agency or advertiser report. To authenticate template installation, you must have access to a G-Suite account linked to DV360.
AdRoll, Criteo, and AppNexus Dashboard Examples for Looker Studio
Although these channels are not commonly used, they deserve a spot in our list of top Looker Studio dashboard examples. To make a copy of these dashboards, please visit our template gallery.

Click here to set up your copy
Connect your Search Console data to start tracking and optimizing your SEO efforts with this helpful template.
CRM Attribution Dashboard Example for Looker Studio

Click here to set up your copy
Looker Studio Dashboard Examples for Organic Insights
Facebook Organic Insights Dashboard Example for Looker Studio
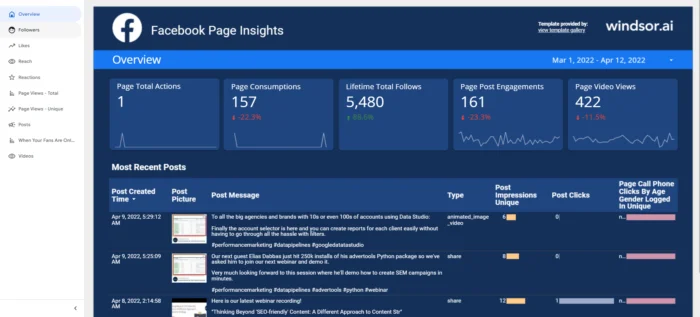
This dashboard provides a comprehensive overview of your Facebook audience and content performance, focusing on key metrics such as:
- Followers
- Likes
- Reach
- Reactions
- Page Views – Total
- Page Views – Unique
- Posts
- When Your Fans Are Online
- Videos
We’ve integrated these basic metrics to keep the dashboard intuitive and easy to use. For a deeper analysis, refer to the full list of available metrics and dimensions in this article.
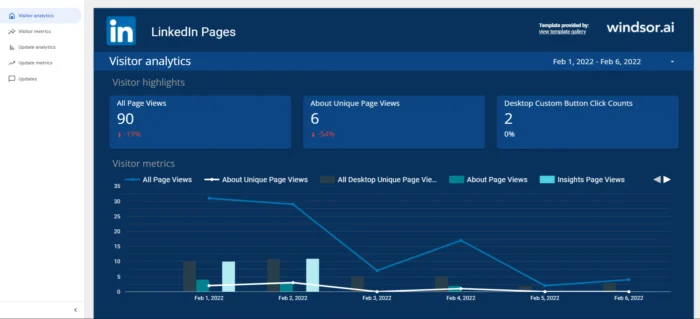
Linkedin Organic Insights Dashboard Example for Looker Studio
Click here to set up your copy
Similar to the above template, this LinkedIn organic insights dashboard will help you analyze your business performance on LinkedIn, focusing on key metrics like page views and clicks.
It comes with basic metrics by default, but you can easily extend the template with additional metrics and dimensions, as outlined in this article.
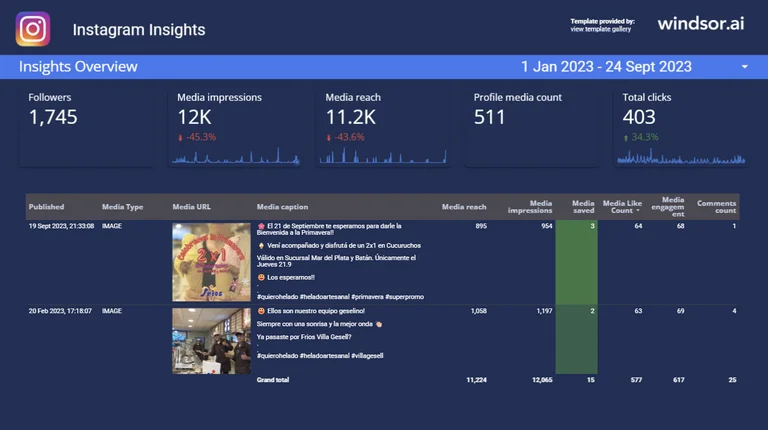
Instagram Insights Dashboard Example for Looker Studio
Click here to set up your copy
This template will help you effectively analyze your Instagram audience, content results, and event performance with key insights such as:
- Insights Overview
- Post Performance Reporting
- Activity Insights
You can easily customize the basic template using this comprehensive list of all supported metrics and dimensions in the Instagram connector.
Main Use Cases of Looker Studio Dashboards
Let’s explore some key areas and practical ways to use the best Looker Studio dashboards.
1. Sales management
- Track key sales metrics like revenue, customer acquisition, and conversion rates, which are the essential insights for refining your outbound sales strategy and targeting efforts.
- Analyze sales trends over time and identify top-performing products or services.
- Monitor the performance of sales teams or individual reps.
2. Marketing
- Evaluate the effectiveness of marketing campaigns by tracking metrics like click-through rates, conversion rates, and return on ad spend (ROAS).
- Analyze customer acquisition costs and customer lifetime value to optimize marketing strategies.
3. Customer engagement
- Monitor customer interactions across various channels like website, email, and support tickets at scale.
- Track customer satisfaction scores (CSAT) and Net Promoter Scores (NPS) to measure customer sentiment.
4. Product analytics
- Analyze product usage data, including feature adoption, user engagement, and churn rates.
- Gather feedback from user surveys and integrate it with usage data to inform product development.
5. Financial reporting
- Generate financial statements like profit and loss (P&L), balance sheet, and cash flow statements.
- Monitor key financial metrics such as revenue, expenses, profit margins, and cash flow trends.
6. Inventory and supply chain management
- Track inventory levels, turnover rates, and lead times.
- Optimize supply chain operations by identifying bottlenecks and forecasting demand.
7. HR and employee performance management
- Monitor HR metrics like employee turnover, retention rates, worktime, and diversity statistics using Looker Studio dashboards, time tracking, and employee time and attendance software.
- Evaluate individual and team performance based on key performance indicators (KPIs) and goals.
8. Website and app analytics
- Analyze website traffic, user behavior, and conversion rates using web analytics dashboards.
- Identify popular content, user demographics, and traffic sources to inform content and marketing strategies.
9. Customer support
- Track support ticket volumes, response times, and resolution rates.
- Monitor customer feedback and sentiment to identify areas for improvement.
10. Compliance and risk management
- Monitor compliance with industry regulations and internal policies.
- Identify potential risks and track mitigation efforts.
11. Geospatial analytics
- Visualize data on a map to analyze geographical trends or distribution patterns.
- Useful for businesses with multiple locations or those with a strong geographical component.
12. Social media engagement
- Monitor social media metrics like followers, likes, comments, and shares with free social media dashboards.
- Analyze sentiment analysis to gauge public sentiment towards your brand.
Key Benefits of Using Looker Studio Dashboards
Ease of use
Pre-built Looker Studio dashboards enable non-technical team members to quickly create custom reports to track KPIs relevant to their roles.
For instance, a sales manager can use a multi-channel dashboard to monitor their sales pipeline and evaluate individual performance effectively.
A high degree of customization
Our Looker Studio dashboards can be easily customized to match your company’s branding.
For example, you can align any dashboard with your unique color scheme and add the company logo for a consistent look.
Flexibility
Interactivity
Looker Studio dashboard examples enable team members to effectively explore data on their own.
For instance, a product manager can use interactive elements to delve into user behavior data to identify areas for product improvement.
Scalability
When using Looker Studio dashboards, managing large datasets for decision-making at scale becomes effortless.
Just imagine how helpful these templates can be for a logistics company to analyze and visualize extensive shipping and delivery data, optimizing routes and schedules. And that’s just one of many possibilities.
Data security
Looker Studio dashboards are a robust tool to safeguard your sensitive information.
For example, a finance team can create a dashboard to track financial performance while ensuring that only authorized personnel can access sensitive financial data.
The ultimate automation
The use of ready-made Looker Studio dashboard examples significantly automates routine data tasks and increases efficiency.
That’s how a marketing team can set up automated reports to track the performance of various marketing campaigns, saving time and ensuring consistency in reporting.
You can also leverage Looker Studio’s API to integrate with other tools and automate workflows. For example, a data operations team can use the API to automatically update and refresh data from external sources in the dashboard.
Improved collaboration
Looker Studio dashboards are an effective way to share insights with colleagues and stakeholders for collective decision-making.
For example, a project manager can create a project status dashboard and share it with the team for real-time updates on project progress.
Make the Most out of Looker Studio Dashboard Examples with Windsor.ai
You can easily utilize our Looker Studio templates and connect various data sources for comprehensive analysis via Windsor.ai connectors.
We’re committed to ensuring the best analytics experience for users by providing access to all dimensions and metrics from the most popular and widely used platforms.
We make both connecting and analyzing data really easy through the following features:
Extensive pool of connectors
We offer a vast number of connectors, allowing you to build complex data pipelines from 315+ popular sources.
Data integrity
We maintain the integrity of your data. The field names and numbers you get through Windsor.ai are identical to those found in native reporting UIs, ensuring total accuracy.
Active community and Google partnership
Our Looker Studio templates and integrations are developed in close collaboration with Google. This means you benefit from support from the active Google Data Studio community, along with fast solutions if you ever have questions about your dashboards.
The great news is that Windsor.ai offers a 30-day free trial with full access to Looker Studio integrations, no credit card required. Start creating powerful Data Studio reports today!
If you’re working on a new Looker dashboard and want to share it with a broader audience, feel free to email us, and we’ll consider adding it to our list.
Try Windsor.ai today
Access all your data from your favorite sources in one place.
Get started for free with a 30 - day trial.
Read Also:
Power BI vs Google Data Studio in 2024: Which is better?
Looker Studio Template Gallery

