 AI insights
 About us
 Careers
 Security
 Customer reviews
 Contact us
 Affiliate program
 Solution partners
 Looker Studio templates
 Tableau templates
 Facebook Ads templates
 Google Ads templates
 Data fields & Metrics
 AI prompt library & Guides
 Product documentation
 API documentation
 Case studies
 Blog
Blog Data models
 Windsor vs Supermetrics
 Windsor vs Fivetran
 Windsor vs Portermetrics
 Last updated: 21 May 2025
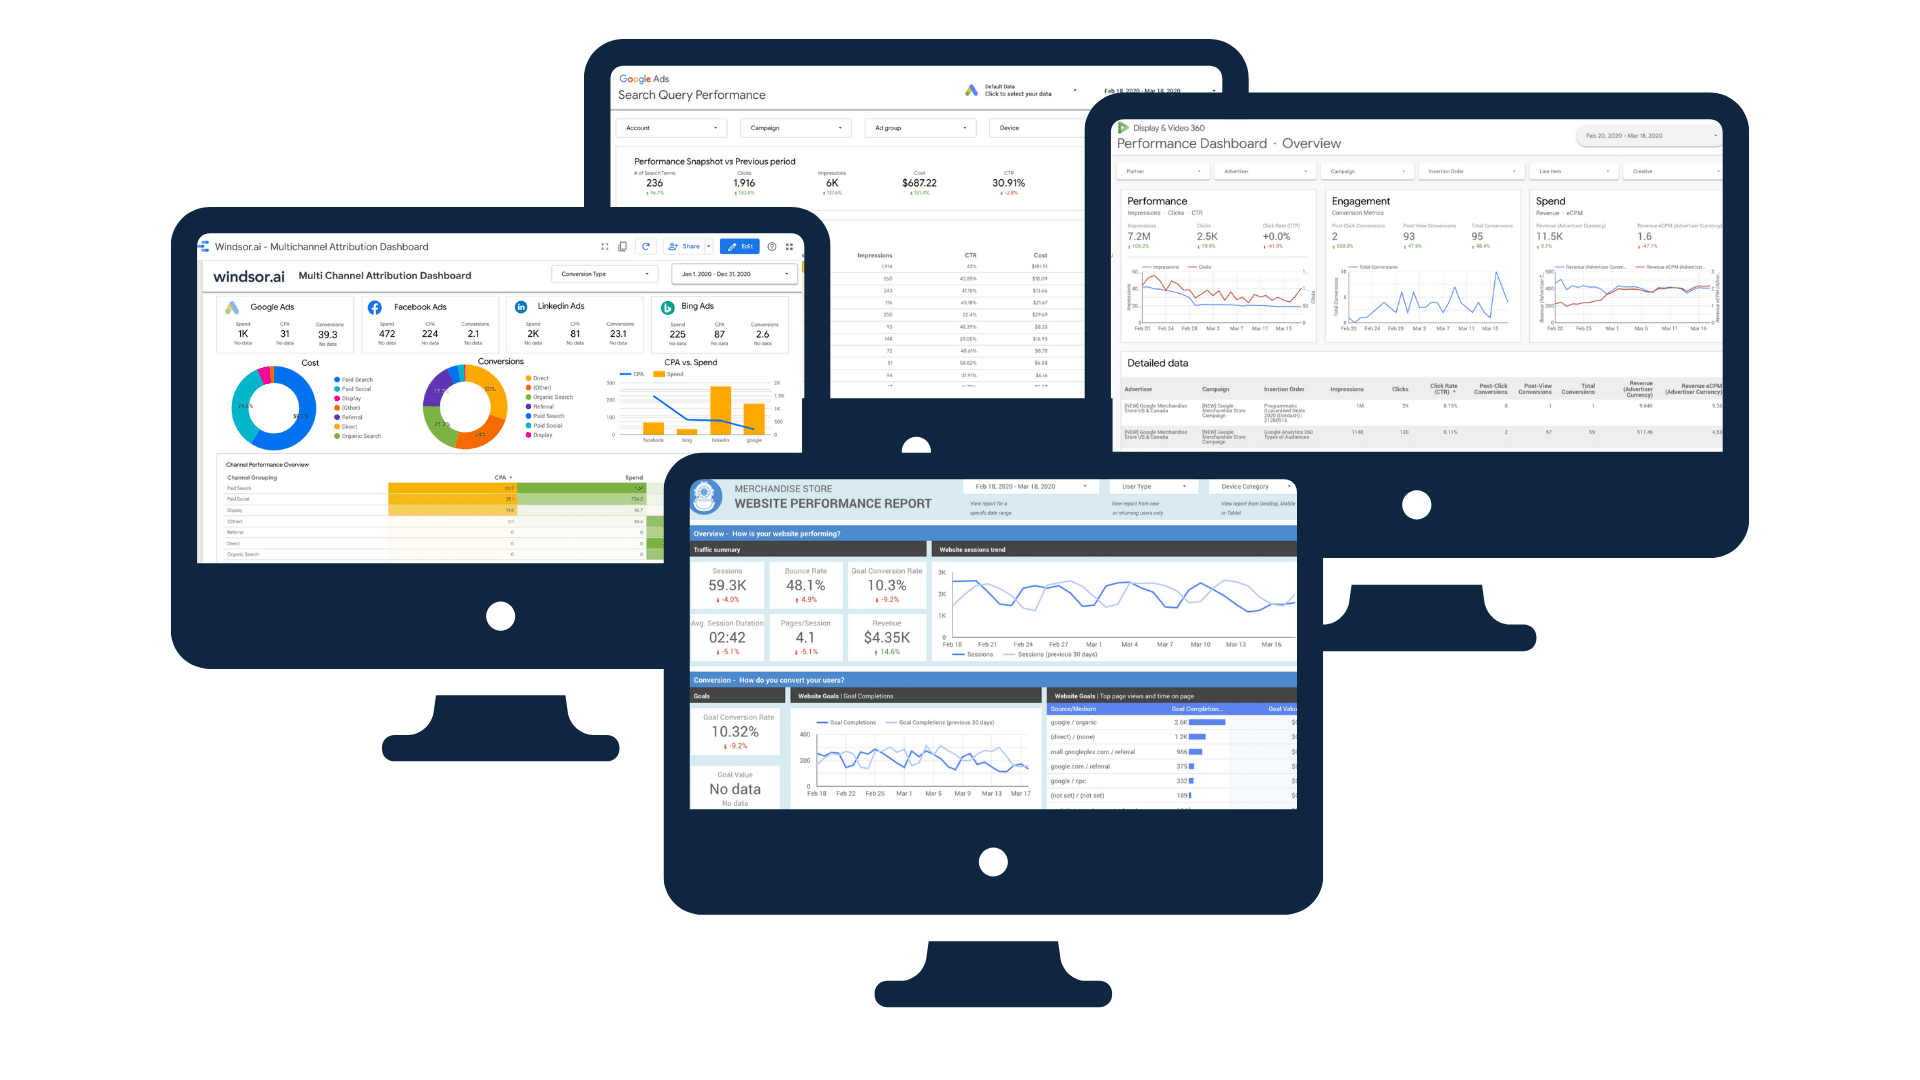

This is something any Facebook marketing agency should be using.
Google Data Studio Templates in 2023 – Report Gallery
If you’re looking at visualising your marketing data, Google Data Studio is one of the best ways to do it. It is also very easy to get started.
Digital marketing can be a tedious task in the absence of the right techniques. With Google Data Studio, one can get the upper hand on both reporting and data visualization. Besides, sharing the reports is also simplified and can be accessed by clients in no time.
The platform offers a wide range of templates and access to build connections with various data sources. It also offers widgets, maps, charts, and graphs to visualize the marketing data. The platform is a boon to the data analysts and also for the businesses that use it to the best potential.
Table of content
- Main Types of Google Data Studio Templates
- Google Data Studio Templates Library
- 10 popular reasons why we use Google Data Studio Templates
- How Google Data Studio Template work while preparing reports
- Conclusion: Best Google Data Studio Templates
Main Types of Google Data Studio Templates
We’ve provided a comprehensive list of categories for Google Data Studio templates, each tailored for specific reporting purposes.
- Paid Channel Comparison Templates
- Paid Social Reporting Templates
- E-Commerce Templates
- Organic Social Media Performance Reporting Templates
- SEO Reporting Templates
- Email Marketing Templates
- Content Marketing Templates
Each of these categories addresses specific reporting needs, allowing businesses to create customized reports that align with their goals and strategies in various aspects of digital marketing. This segmentation helps users find the most relevant templates for their specific reporting requirements.

Try Windsor.ai today
Access all your data from your favorite sources in one place.
Get started for free with a 30 - day trial.
Top 10 Google Data Studio Templates
We’re sharing an updated list below to help speed up your setup on reporting.
This selection focuses mainly on paid media, SEO and multi-touch attribution and is updated as of October 2023.
Google Data Studio Template: Multi-Channel Attribution Dashboard

Google Data Studio Multi-Channel Attribution Dashboard Template A simple one-page dashboard showing performance allows you to get all paid and non-paid channels analyzed (including their contribution to CPA performance). It can easily be changed to ROAS goals. This is something any Facebook marketing agency should be using.
The data pulling to your paid media channels and your Google Analytics data needs to be enabled to get started.
Data Sources (Google Ads, Facebook Data studio connector, Linkedin Ads, Bing Ads, Google Analytics)
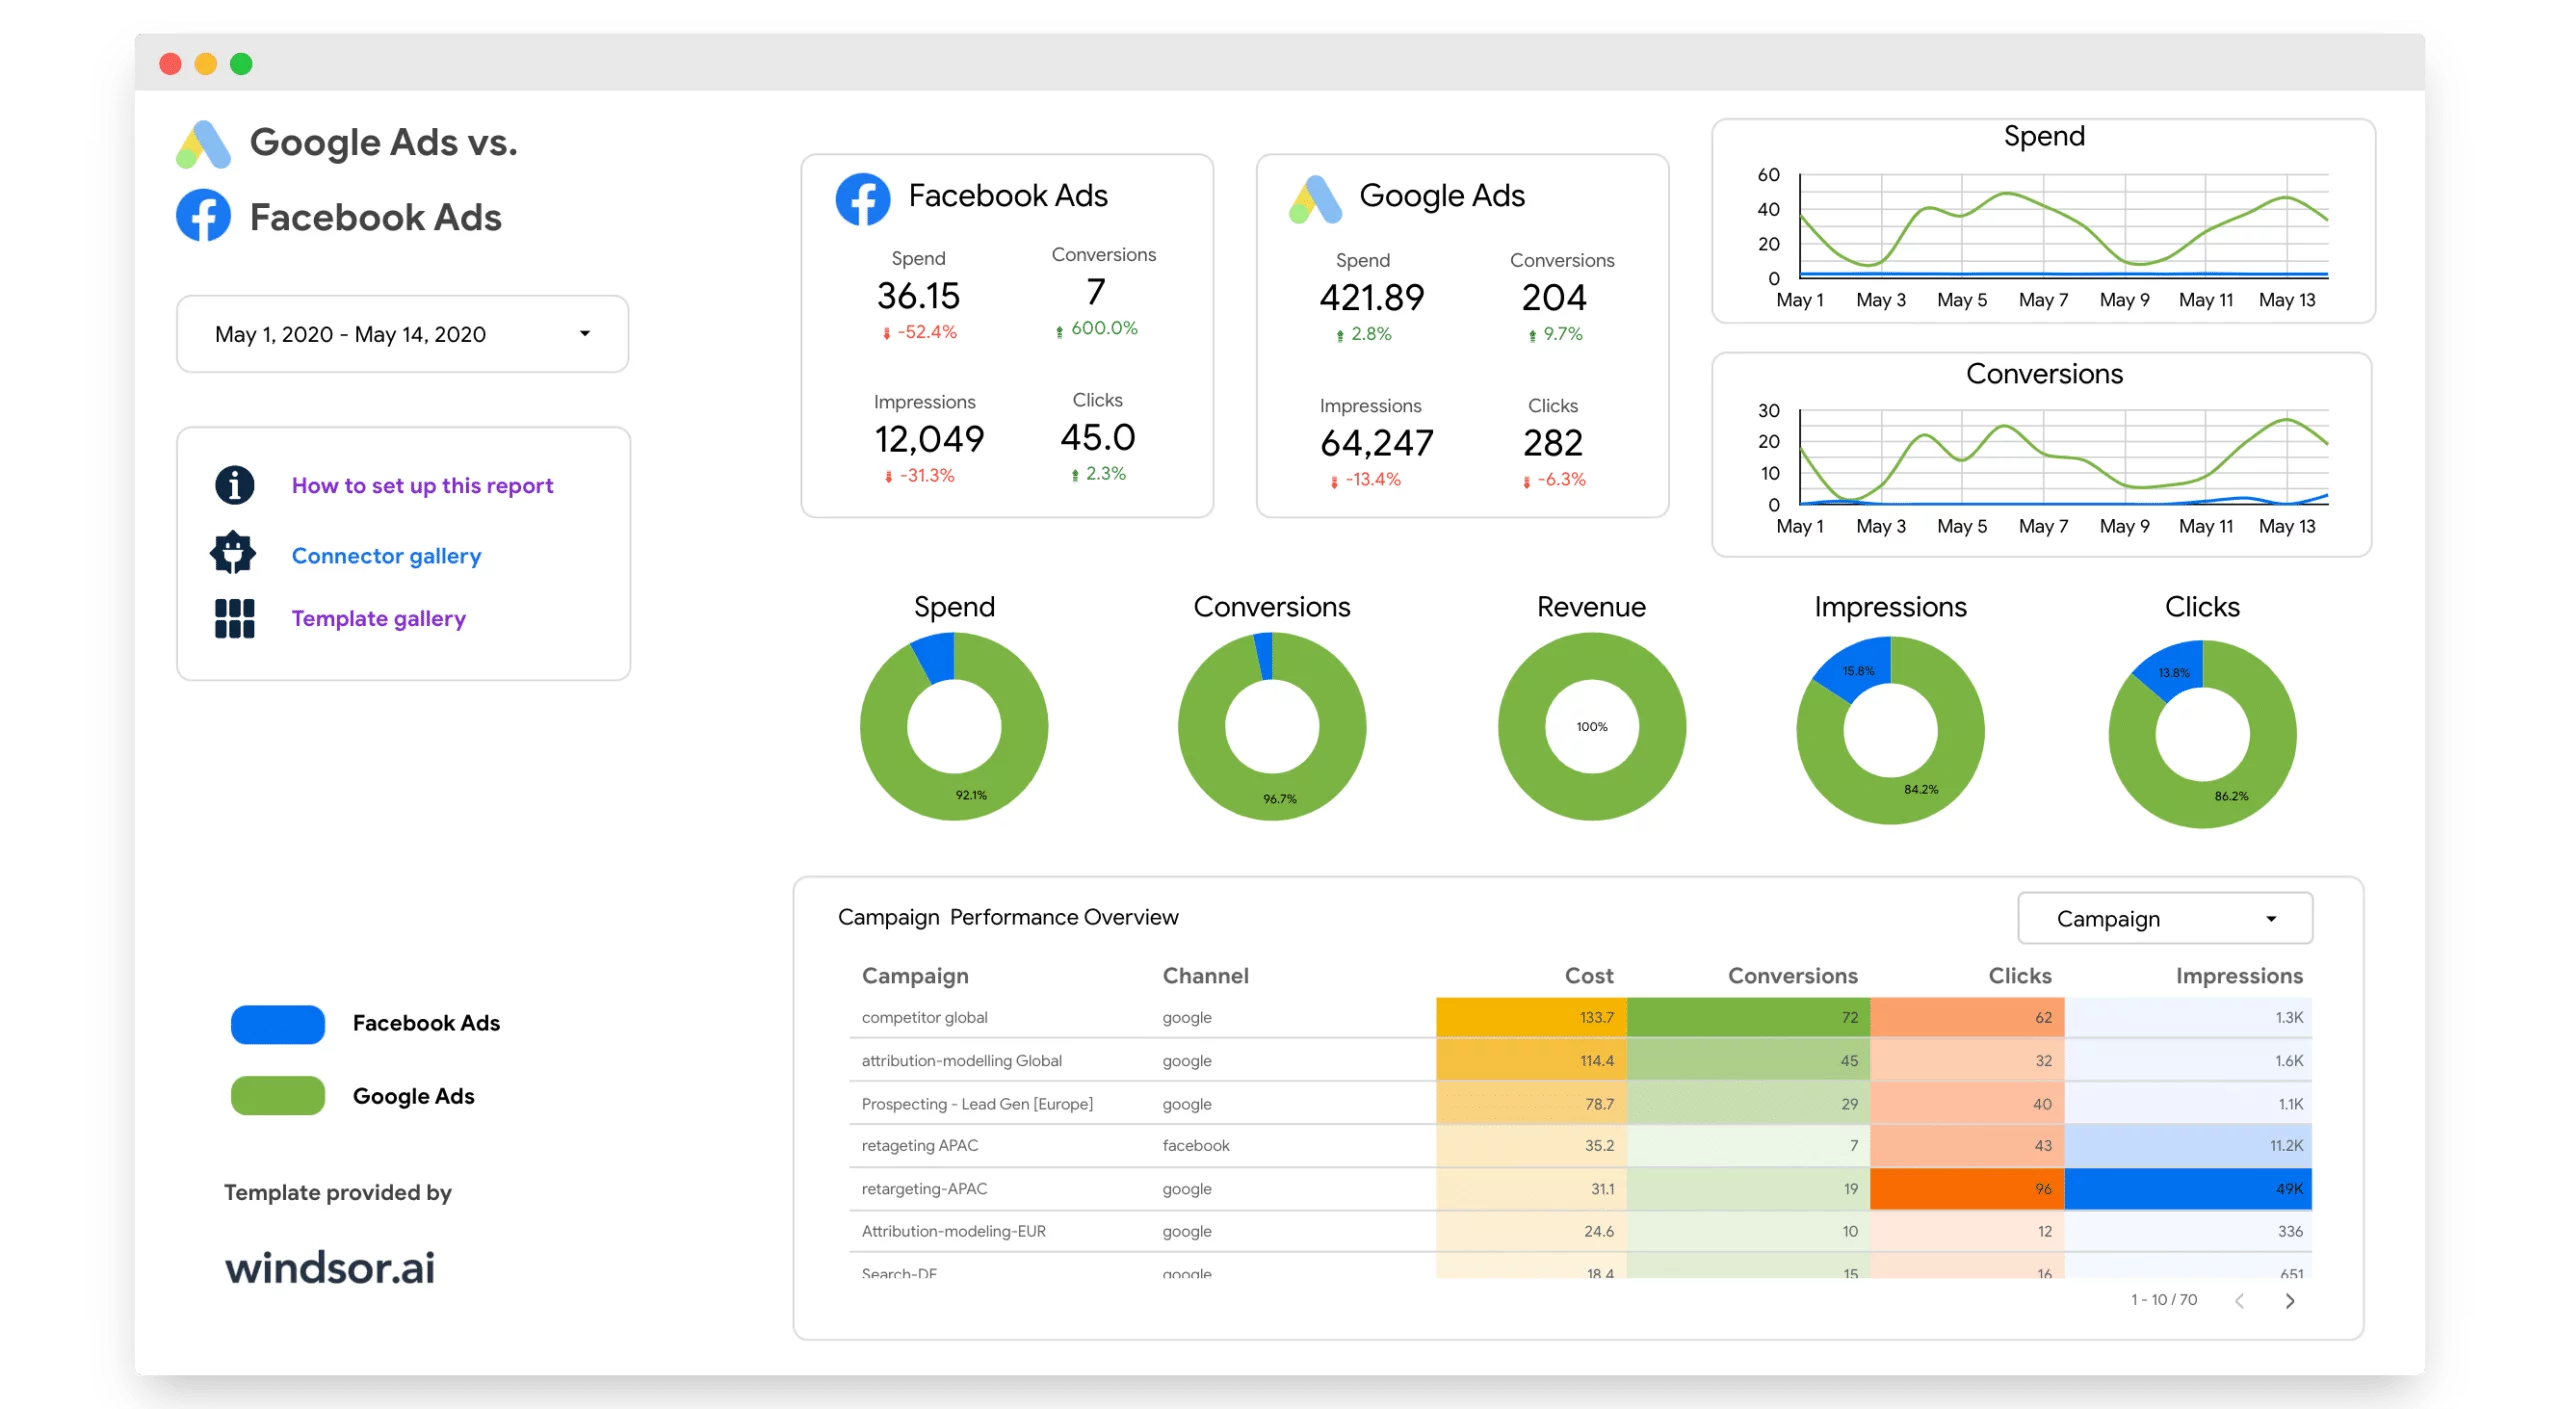
Google Data Studio Template: Google Ads vs Facebook Ads Dashboard

GSD Facebook Ads vs Google Ads Report Template The dashboard ( Data studio Templates ) lets you compare how Google Ads is performing against Facebook Ads. It contains all the necessary dimensions and metrics to dive deep into campaign and source metrics.
What makes this dashboard useful is that the costs are blended with your Google Analytics data. This avoids any double-counting of conversions.
Data Sources (Google Analytics, Google Ads, Facebook Ads)
Google Data Studio Template: Google Ads Search Query Report

GDS Google Ads Search Query Report Template This dashboard is mainly useful if you are a search marketer wanting to understand more granular details about your search query performance.
Data Sources (Google Ads)Google Data Studio Template: Data Runs Deep Website Performance Report

Google Data Studio Data Runs Deep Website Performance Report Template This dashboard most performance metrics into one place with the exception of cost data. It combines acquisition, audience, behavior, and conversion metrics into one place. Please note that all conversion-related data is based on Google’s standard last non-direct click attribution model.
Data Sources (Google Analytics)
Google Data Studio Template: Display & Video 360 Performance Dashboard

Display & Video 360 Google Data Studio Performance Dashboard Template This dashboard is mainly useful to track engagement, click, and conversion metrics for programmatic media buys. It is powered by Display & Video 360 data.
Compared to the user experience of Display & Video 360 itself, the usability of this dashboard is a great plus.
Data Sources (Display & Video 360)
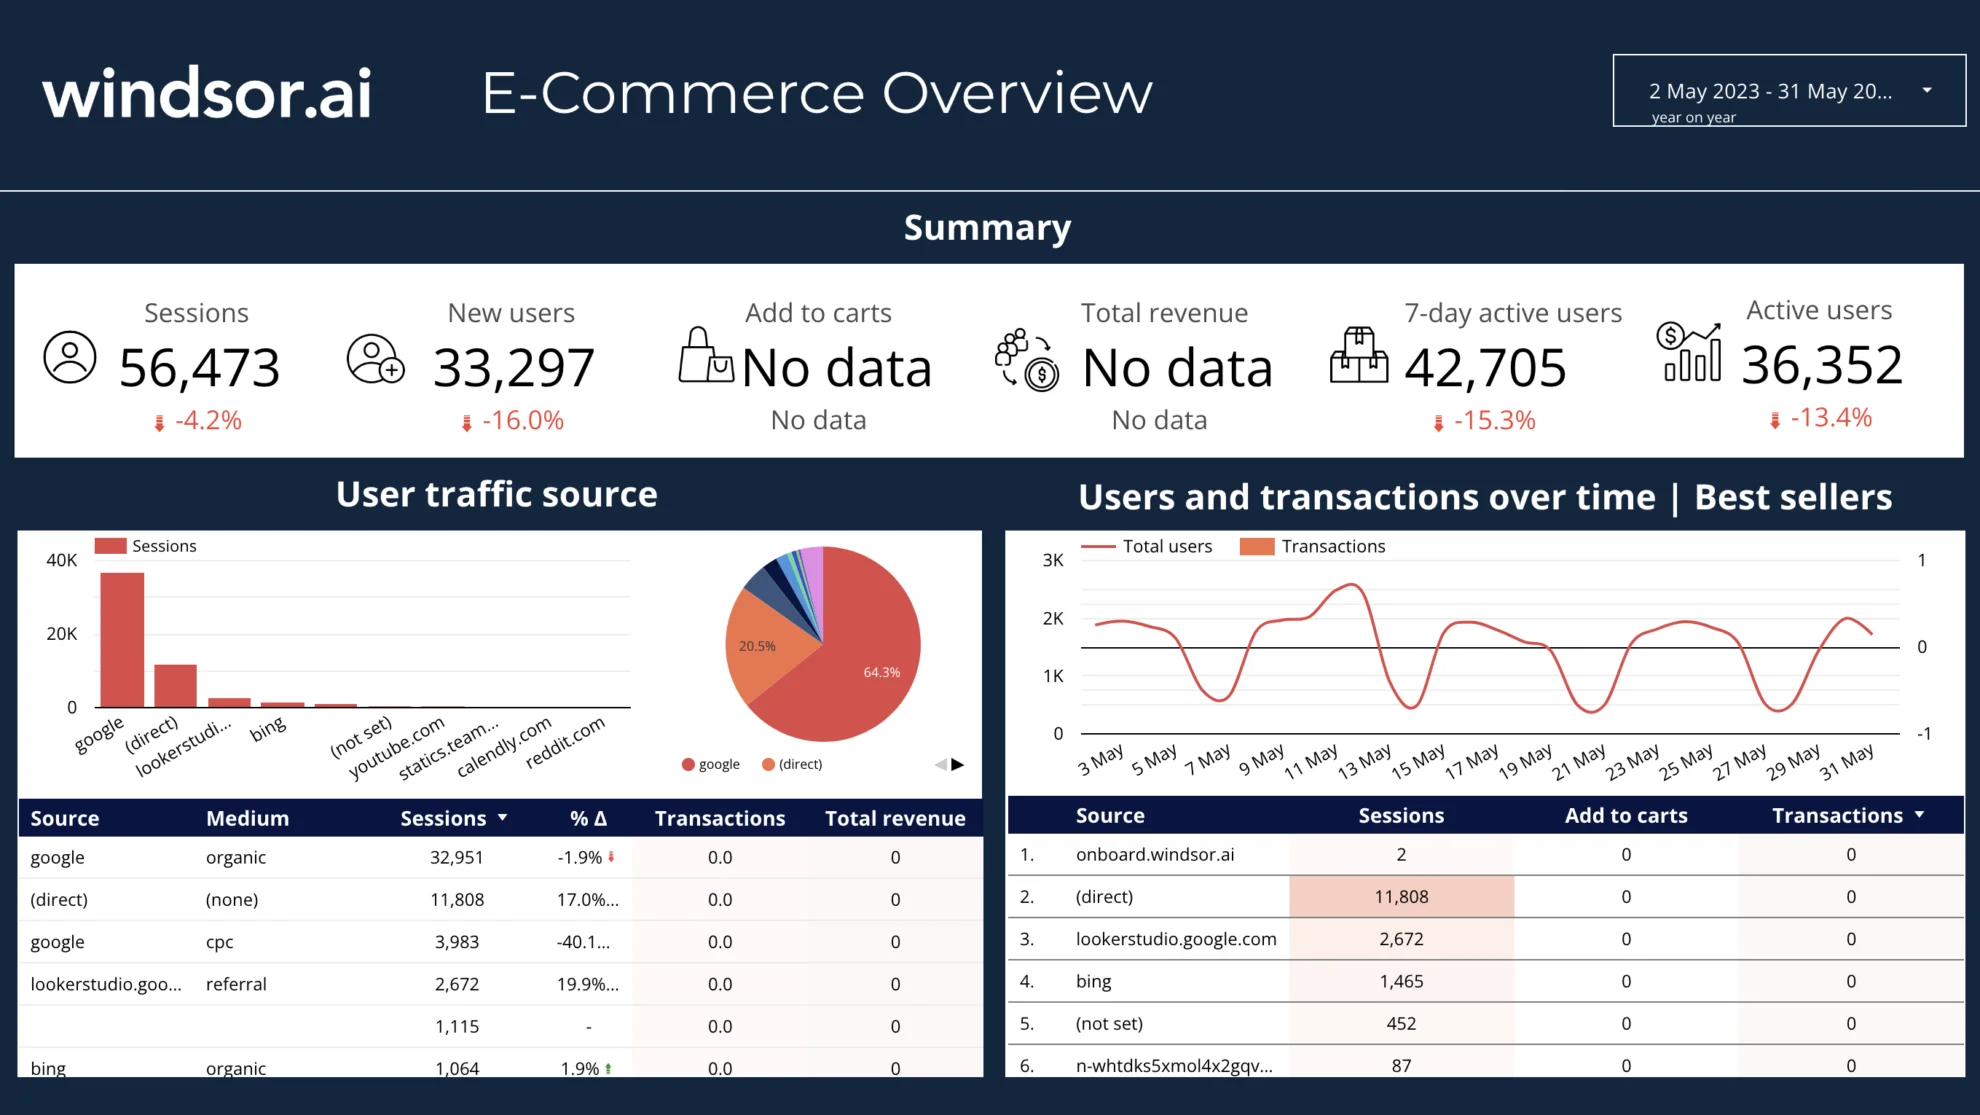
Google Data Studio Template: Ecommerce Master Dashboard

Google Data Studio e-commerce overview report This dashboard helps you to compare your sales performance quarter over quarter and identify product opportunities and trends.
Get a deep understanding of which products outperformed the previous quarter, compare current quarter performance to the previous year and improve your decision-making process.
Data Sources (Google Analytics, Google Ads, Search Console)
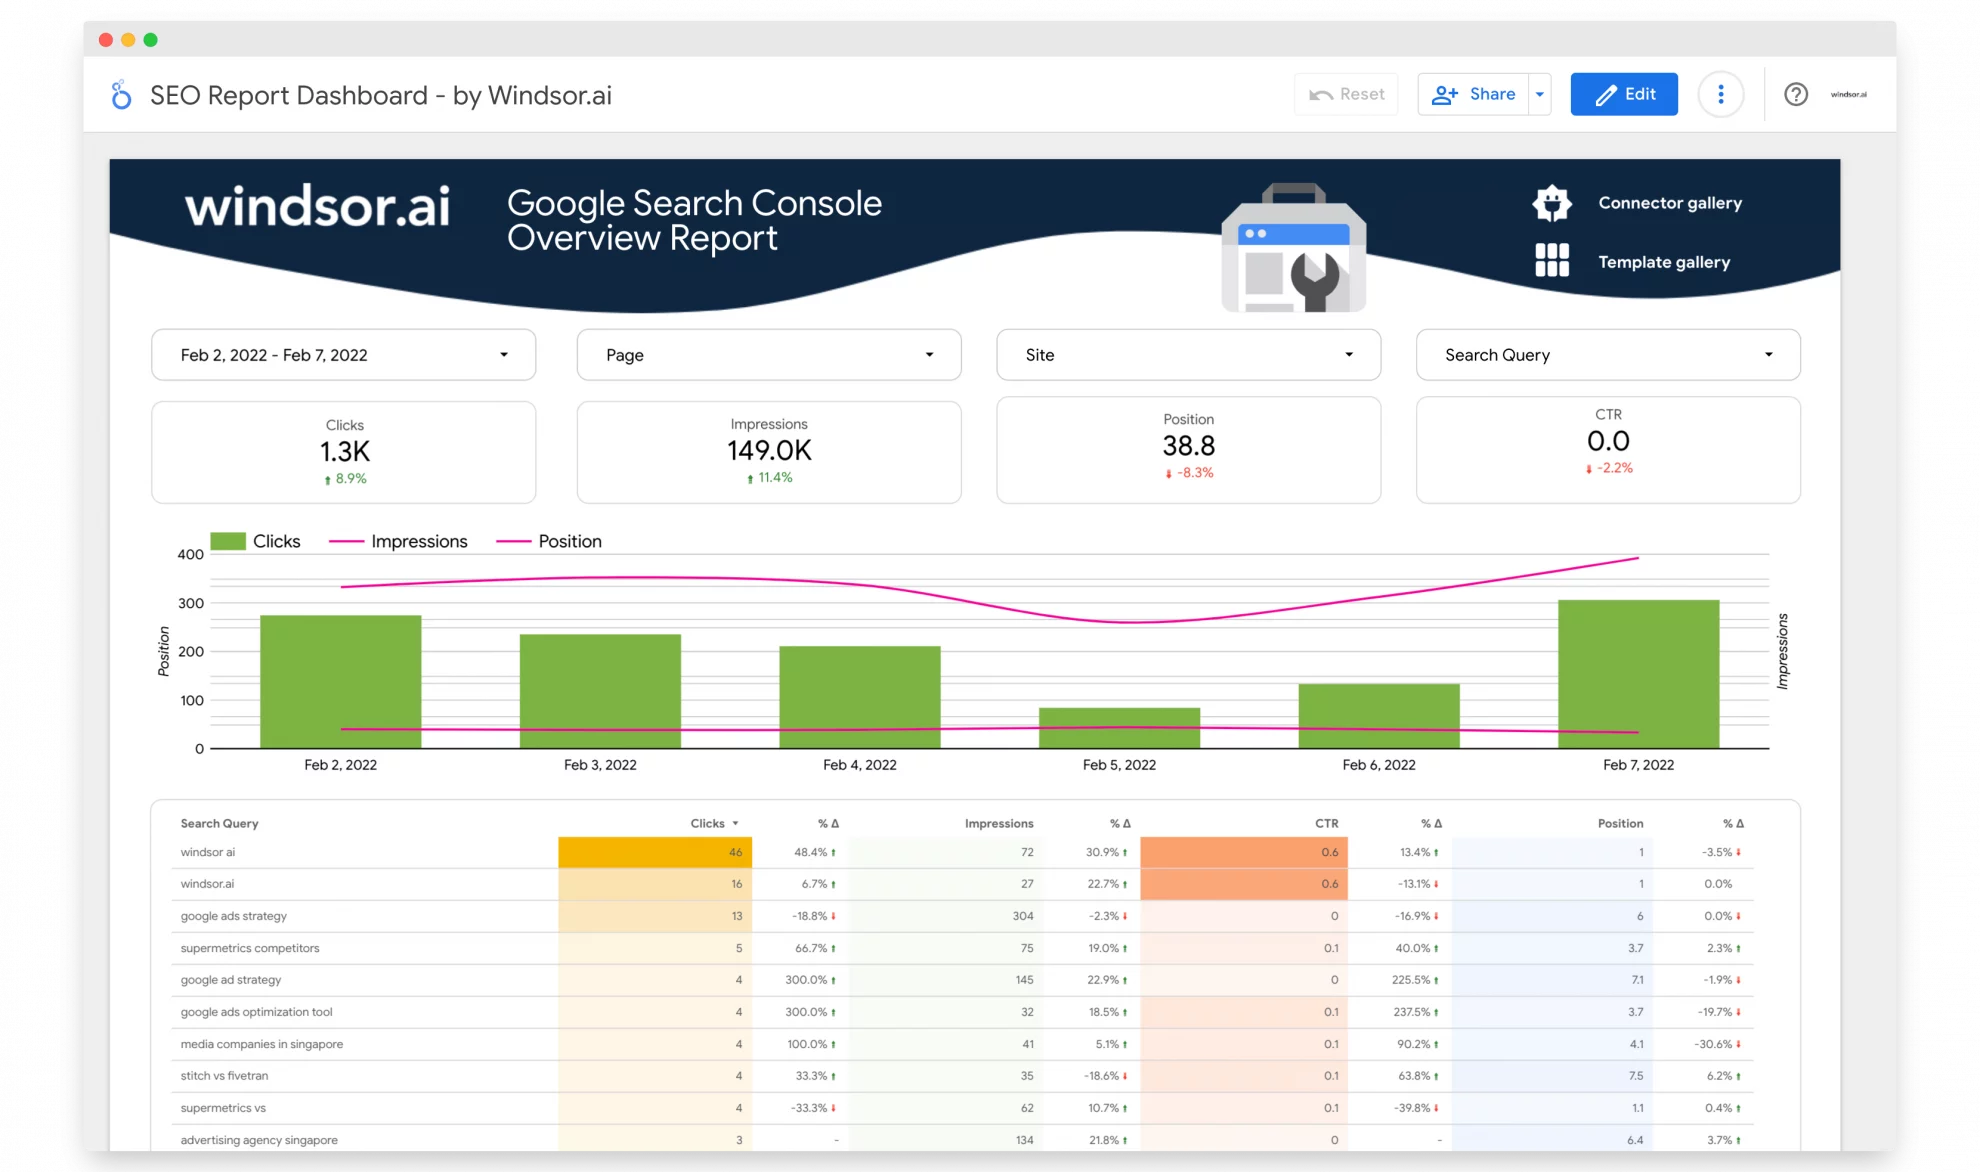
Google Data Studio Template: Google Search Console Overview Report

Google Data Studio GDS Overview Report Template This simple dashboard brings all your Search Console data into a single page.
It’s a good starting point if you want to create a custom SEO report for a customer or blend data with other sources in Looker Studio.
Data Sources (Google Search Console)
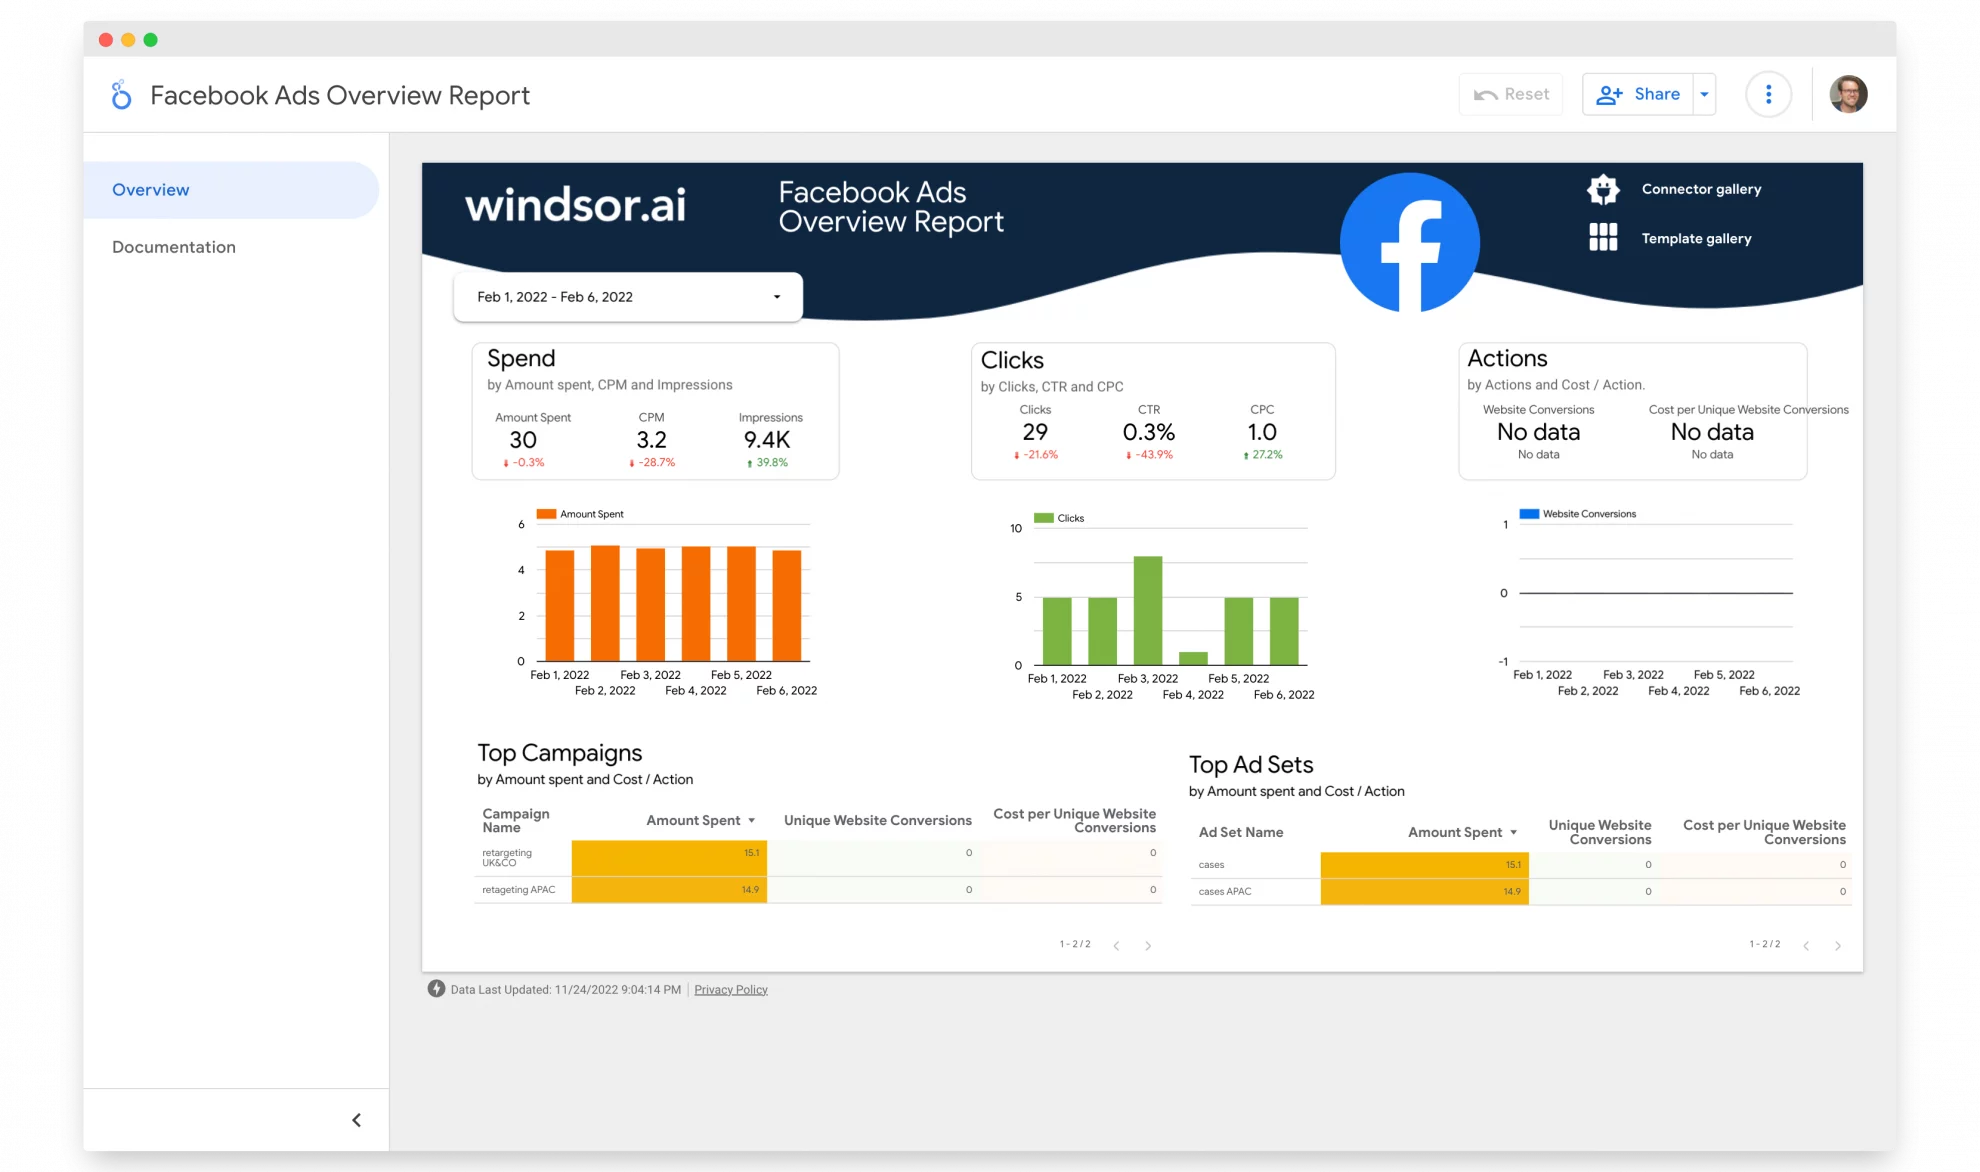
Google Data Studio Template: Facebook Ads Overview Report

Facebook Ads Google Data Studio Report Template This Facebook Ads Data Studio connector dashboard visualizes all your Facebook Ads data. It includes all the metrics and dimensions you can find in the Facebook Ads platform and makes it available in Looker Studio.
It is ideal if you want to get all performance marketing data into one dashboard. Once you install this facebook data studio connector you can customize it to your liking (with your conversion events and or other metrics). There is a selection of >300 dimensions and metrics available.
Data Sources (Facebook Ads)
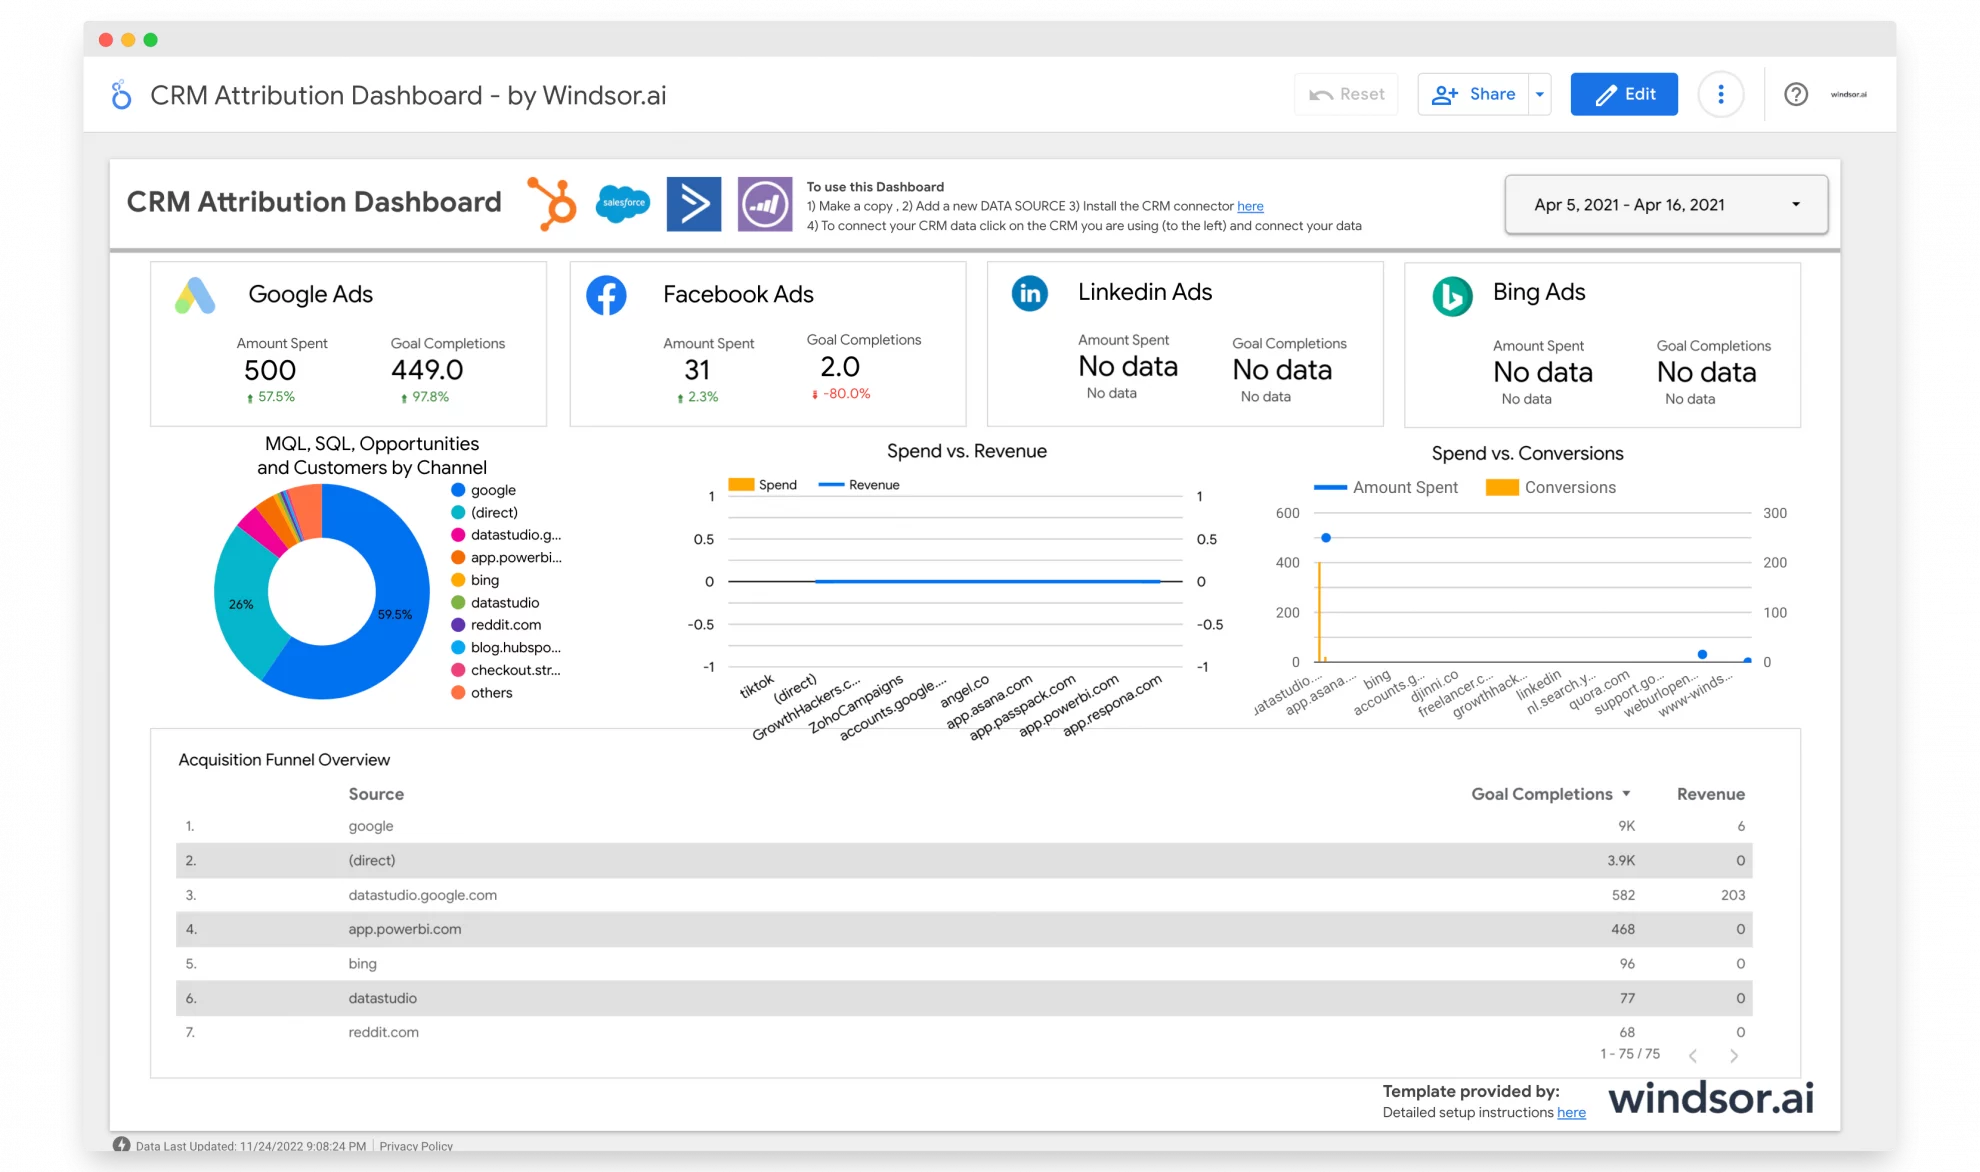
Google Data Studio Template: CRM Attribution Dashboard

CRM Attribution Google Data Studio Dashboard Template This dashboard helps marketers to understand customer journeys all the way to their CRM system. Connecting CRM and analytics data allow you to optimize your marketing to go beyond form fills. In this example, a B2B data set (ours) is connected with analytics data. This allows us to optimize marketing on CRM events.
Data Sources (Google Ads, Facebook Ads, LinkedIn Ads, Bing Ads, Google Analytics, Hubspot CRM)
Google Data Studio Template: E-Commerce Performance Overview Report


Are you an e-commerce company looking for a simple performance management report? If the answer is yes, then I suggest having a look at this dashboard. It reports on revenue and conversion numbers from both Google Ads and Facebook Ads and joins in the data from Google Analytics.
Data Sources (Google Ads, Facebook Ads, Google Analytics)
10 popular reasons why we use Google Data Studio Templates
- It is easy to exchange reports
Just as in Google Docs, by giving you a link, you can conveniently share your Google Data Studio Studio report with anyone. You can set browsing and editing authorizations for individuals as in Google Docs. No local software is required for you to visualize and edit or share GDS reports.
- No limits on GA reporting
Finally, the Google Analytics API limitations can be avoided, restricting you to 10 metrics and 7 measurements in one API application. As Google Data Studio Studio is not using the API, certain limitations are not available. You can view all GA data at once after connecting to your GA property.
- Calculated fields are easily used
Google Data Studio will clean up and eliminate “noise” from your page information such as URL parameters and login tokens using measured fields. Calculated fields are also helpful in the remedial parameter incoherence’s. An example would be if both the high and low-case shapes of a medium were to appear.
- Filter Checks Applied
A Filter Control provides the user with control to limit the data seen in the report’s charts. By clicking the icon, and dragging the appropriate form from your report, filter controls will be applied the same as the Date Filter.
- Report-level v Page-level elements
Any item in the report can be prepared as report-level or page-level with several pages. Elements of reporting levels are duplicated in the same place on every page of your paper. Google Data Studio may therefore be used for headers or footers or a KPI scorecard that is necessary for you to view on any screen.
- Creating calculated fields
The most advanced tip, finally. New fields that can be used in the diagrams and Looker Studio Templates can be described. You are able to add new fields to the dataset and build them with existing data fields through a custom calculation.
- It’s easy to use
In comparison with other business intelligence software on the market, Google Data Studio reports are quickly installed and produced. The report is easy to attach to and learn how to use. The development of reports is fun and simple: you only have to select the display tool, drag and drop it in the report area and choose your display measurements.
- It’s Free
Google Data Studio is a modern platform for anyone free of charge. You can only build five different categories of reports in previous versions, but now you can create and upload as many resources as you want for free. In contrast with most other business intelligence resources this more than reflects its weaknesses.
- The dashboards and reports are easy to customize
Google’s visualization of data was never more adaptable than with Google Data Studio, which lets you build your report on a blank canvas. One-page dashboards or several report pages may be developed, for example. Fast, since no set widget areas or column sizes are available, because you can drag and drop any object where it’s on the canvas.
- You Can Pull From Multiple Data Sources
The biggest drawback of past Google data visualization software was that data from separate assets or views could not be merged on a single dashboard. You can set individual data sources for each map by using the Google Analytics 4 data sources in Google Data Studio. In this way data can be fused into one dashboard from many perspectives.
How Google Data Studio Template work while preparing reports
You know the job of delivering the correct measurements in a straightforward, succinct and visually pleasing manner if you deal with details in your organization. If you merge multiple data sources with one view, reports can be much more complex. Do you want to evaluate the Facebook and Google advertisements side-by-side? Would you like to track the growth of digital fundraising in many sources? It’s not sliced by a tablet.
Google knows also how well it will function. For that reason, data studio templates, a data visualization platform, have been created to produce stunning, sharp, and easy reports. In personalized reports, Google Data Studio facilitates the loading, displaying, and distribution of data. Bar maps, pie maps, and time series are used in the visualizations. See all the stuff! You can also personalize fonts, colors, and labels for brand use.
Right now, as a sample, we’re using Google default details. However, as you can see, in this article we have a few items. Here you are able to add your logo. We have networks by which we can filter all the various traffic channels, hence social comparison.
GDS is a free dashboard and monitoring platform for creating, displaying and sharing the data. data studio template lets you create maps and diagrams, merge multiple data sources into a single centralized study, and cooperate on a business plan with coworkers or customers.
Try Windsor.ai today
Access all your data from your favorite sources in one place.
Get started for free with a 30 - day trial.
Conclusion: Best Google Data Studio Templates
For a broad variety of empirical reasons, the group has produced report templates: Google Data Studio SEO templates, promotion, revenue, advertisement… It is simple, useful, and appealing to start to use these models and modify them for your own company or customers.
Apart from the opportunity to take data from two entirely separate sources and blend it into the same article, the data studio template is appealing for its rich features and clear user interface.
If you’re interested in this we recommend having a look at our own Marketing Template Gallery which contains dashboards for other less-used data sources for Looker Studio (like TikTok Ads, Criteo, AdRoll, and many more). We also cover Google Sheets, Excel, and Power BI templates.
You might also want to check our Looker Studio examples page and article about difference between Power BI and Google Data Studio.
If you’re interested to have your dashboard listed here, please contact us via chat (you can also write to us at [email protected].)
Try Windsor.ai today
Access all your data from your favorite sources in one place.
Get started for free with a 30 - day trial.

