 AI insights
 About us
 Careers
 Security
 Customer reviews
 Contact us
 Affiliate program
 Solution partners
 Looker Studio templates
 Tableau templates
 Facebook Ads templates
 Google Ads templates
 Data fields & Metrics
 AI prompt library & Guides
 Product documentation
 API documentation
 Case studies
 Blog
Blog Data models
 Windsor vs Supermetrics
 Windsor vs Fivetran
 Windsor vs Portermetrics
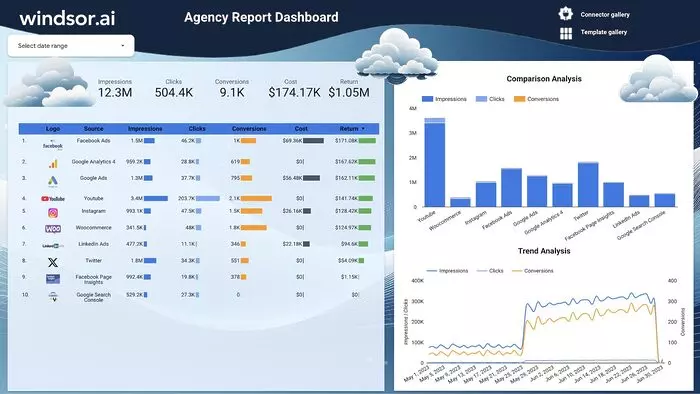
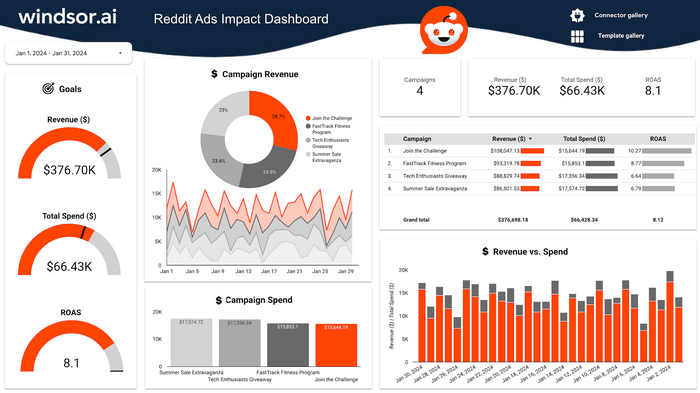
Best Marketing Dashboards For E-commerce Data
At Windsor.ai, we strive to make e-commerce marketing reporting as effortless as possible for our users.
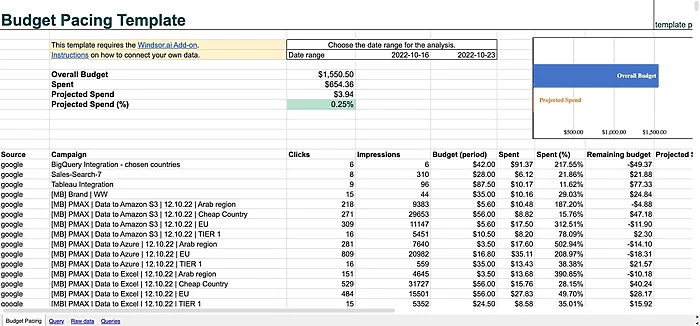
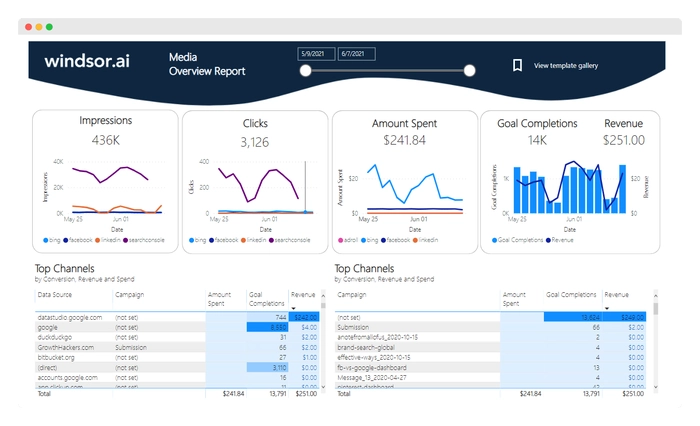
These e-commerce report templates will help you optimize your marketing spending and investments.
Free E-commerce Dashboard Templates with easy-to-follow instructions for connecting your own data.
Find the right template from E-commerce’s library and start using them to save time, effort and increase productivity.


Power up your marketing performance with Windsor.ai
What is an Ecommerce Dashboard?
An eCommerce dashboard is a visual representation of key metrics and data related to an eCommerce business. It provides a centralized view of important performance indicators, allowing business owners, marketers, and analysts to monitor and analyze various aspects of their online store’s operations and make informed decisions.
The purpose of an eCommerce dashboard is to provide real-time or near-real-time insights into the performance of the business across different areas. It enables users to track key metrics, identify trends, measure progress towards goals, and spot any issues or opportunities that require attention.
What should you be tracking on your eCommerce Marketing Dashboard?
Analyzing your e-commerce data helps you make more informed business decisions to drive sales.
When setting up an eCommerce marketing dashboard, it’s important to track key performance indicators (KPIs) that provide insights into the effectiveness of your marketing efforts and help you make data-driven decisions. Here are some essential metrics and areas to consider tracking on your eCommerce marketing dashboard:
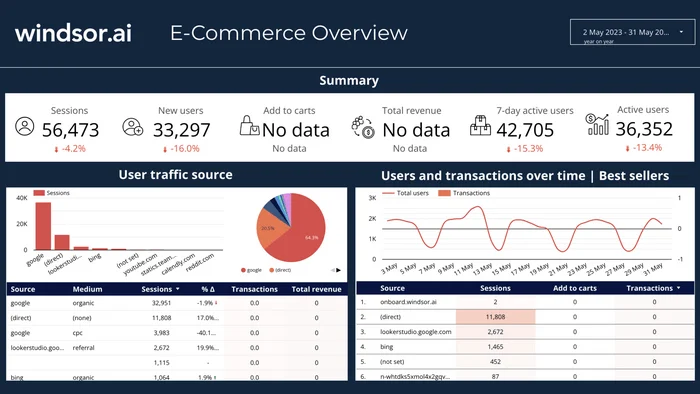
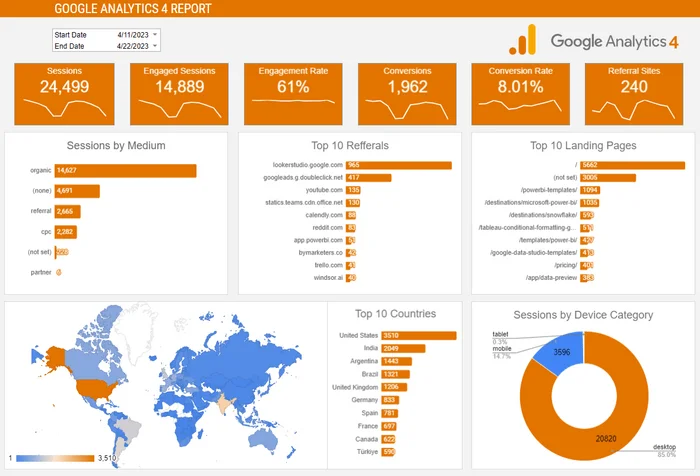
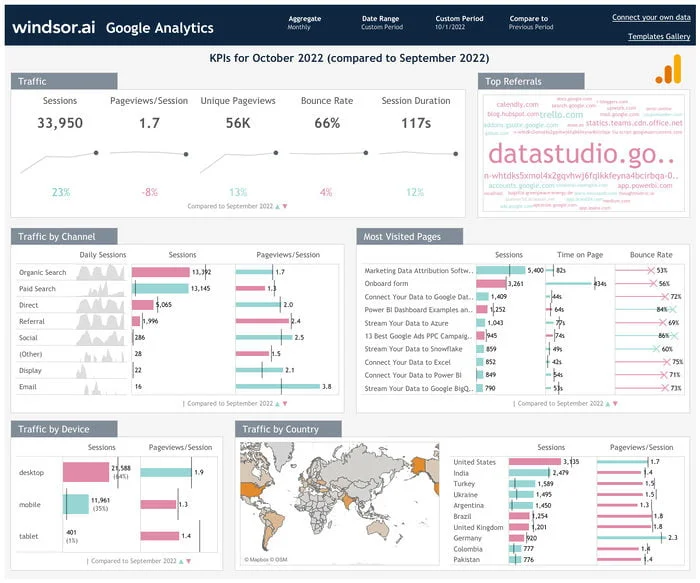
Website Traffic
- Total visits: The number of unique visitors to your website.
- New vs. returning visitors: Differentiating between new and returning visitors can help gauge the effectiveness of your marketing campaigns in attracting new customers and retaining existing ones.
- Traffic sources: Identify the channels driving traffic to your site, such as organic search, paid advertising, social media, referrals, etc.
Conversion Metrics
- Conversion rate: The percentage of visitors who complete a desired action, such as making a purchase or signing up for a newsletter.
- Average order value (AOV): The average amount spent per transaction.
- Sales revenue: The total revenue generated from your eCommerce store.

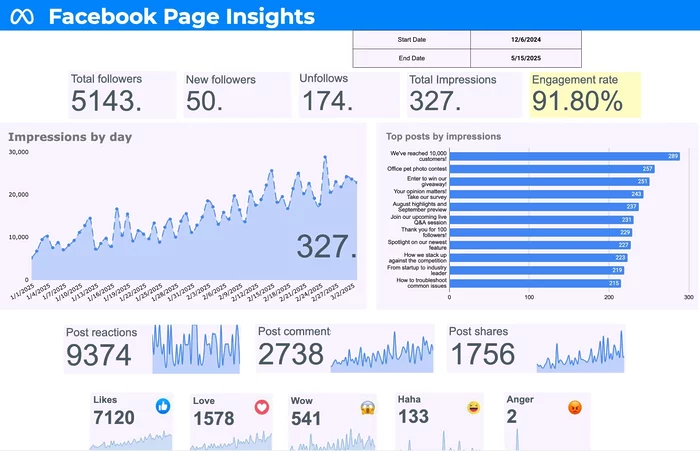
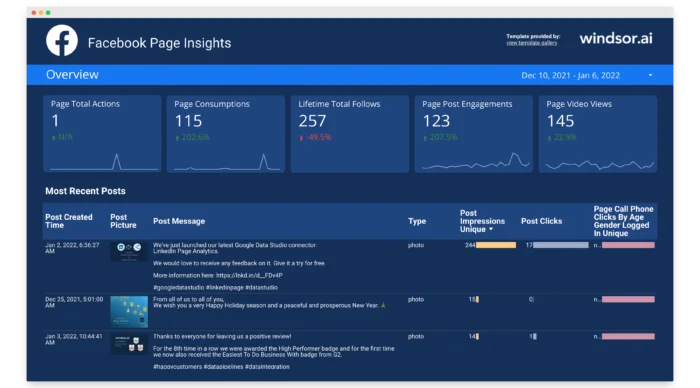
Customer Engagement
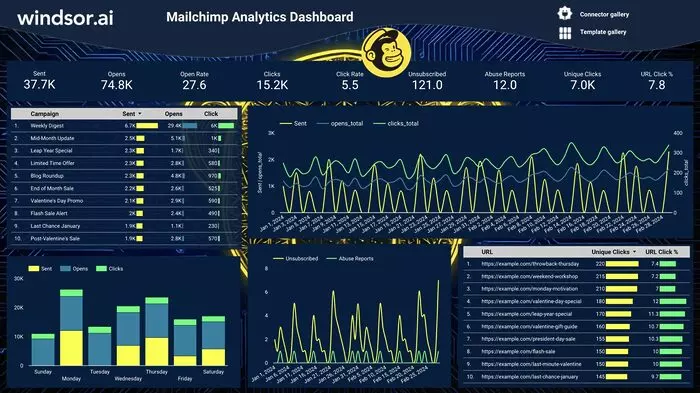
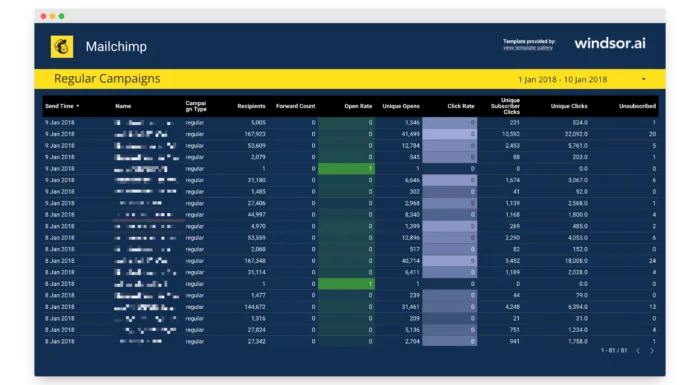
- Email marketing metrics: Track email open rates, click-through rates, and conversion rates for email campaigns.
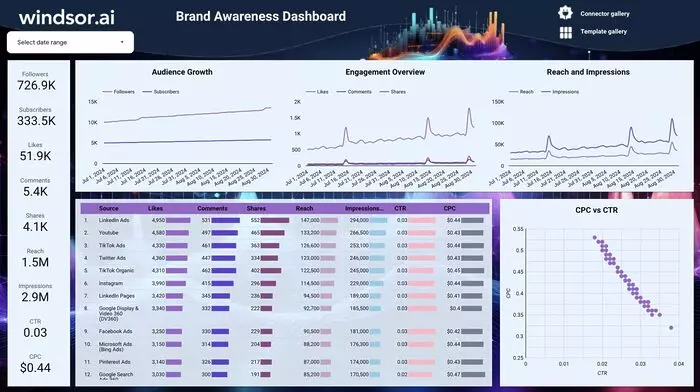
- Social media engagement: Measure likes, shares, comments, and followers across your social media platforms.
- Customer reviews and ratings: Monitor customer feedback and ratings to assess overall satisfaction and identify areas for improvement.
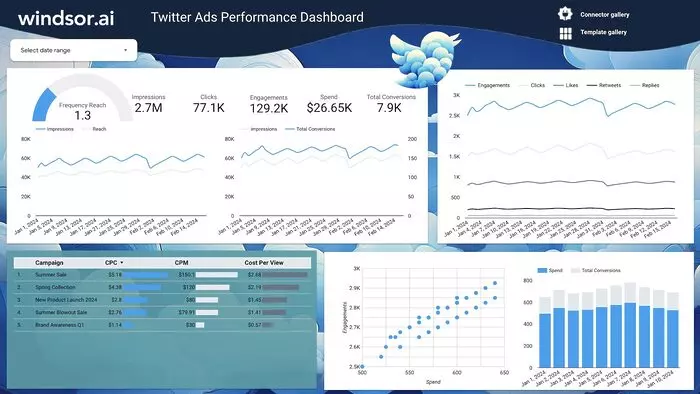
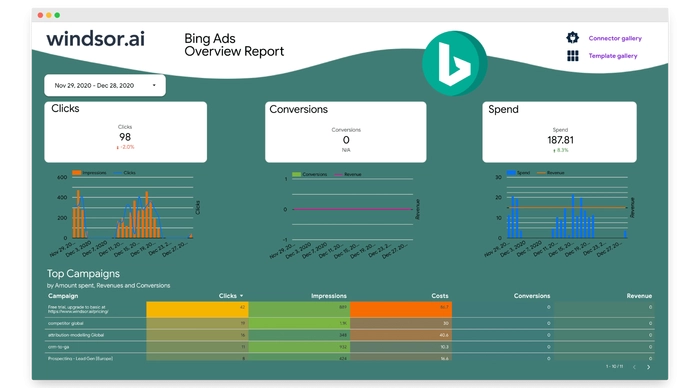
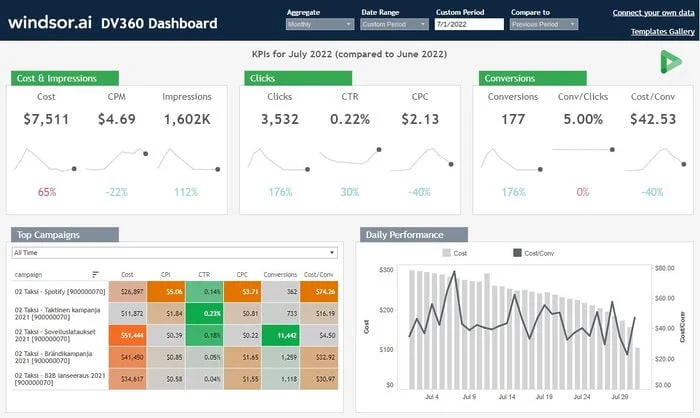
Advertising Performance
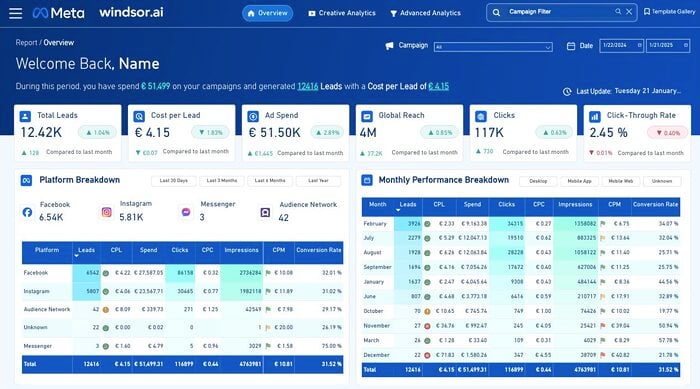
- Cost per acquisition (CPA): The average cost incurred to acquire a customer through your marketing campaigns.
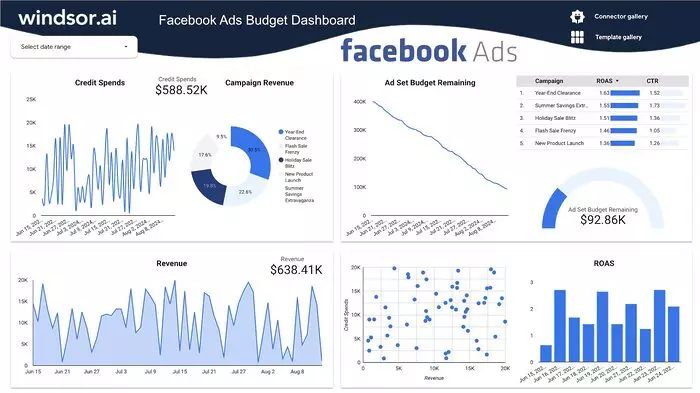
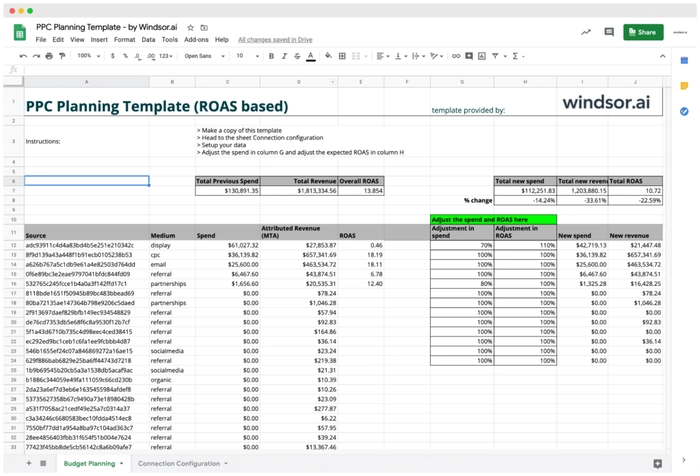
- Return on ad spend (ROAS): Measure the effectiveness of your advertising campaigns by comparing the revenue generated to the amount spent on ads.
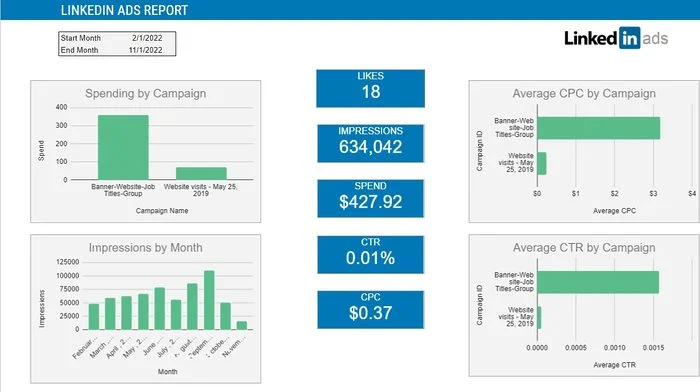
- Click-through rate (CTR): The percentage of users who clicked on an ad compared to the number of impressions it received.
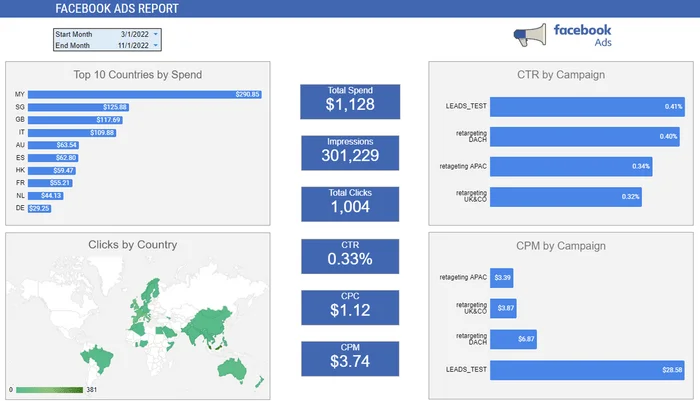
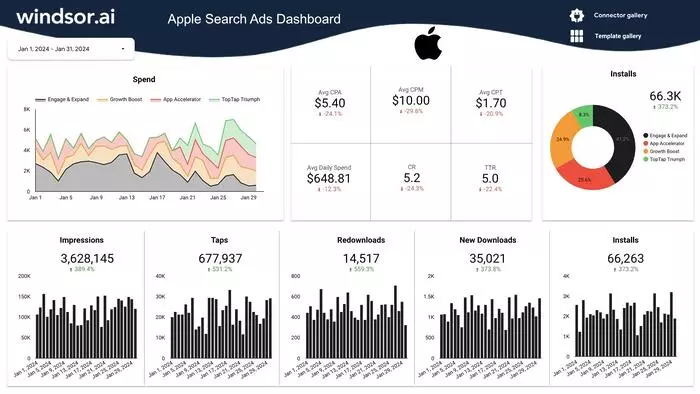
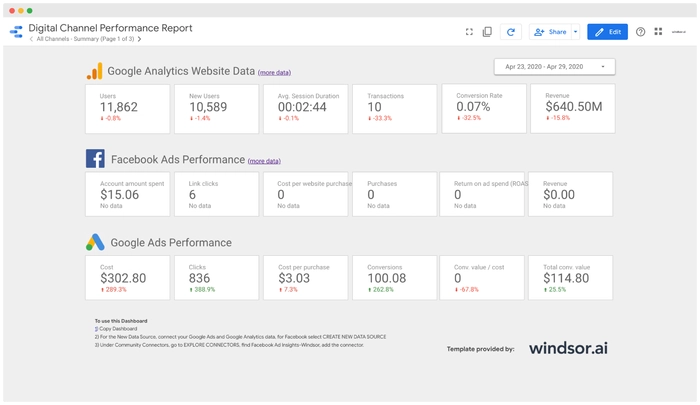
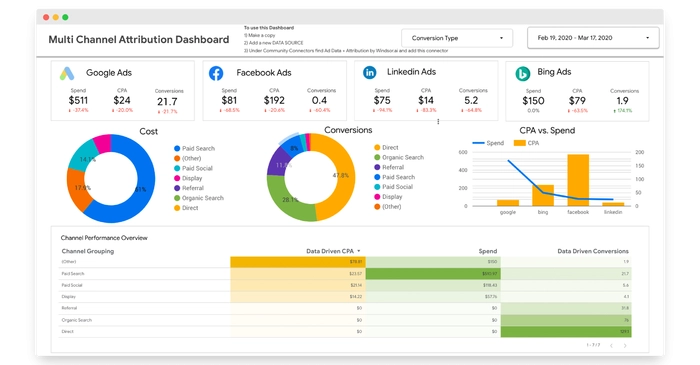
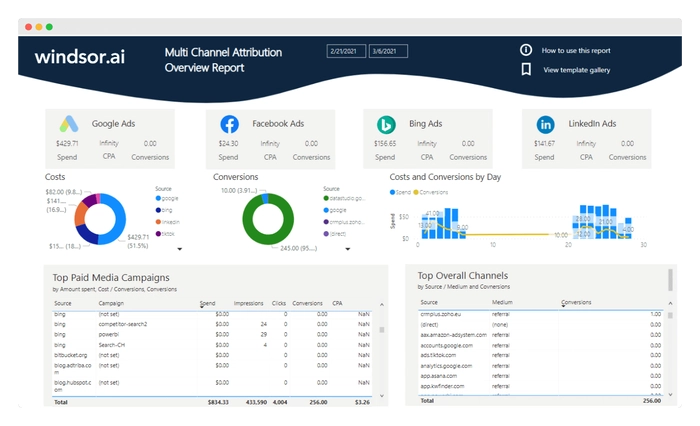
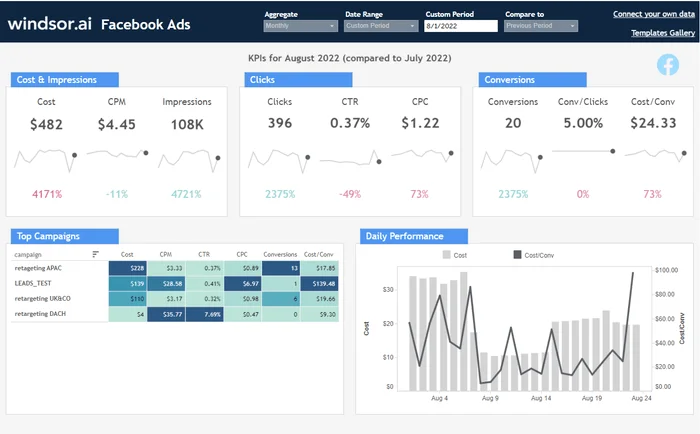
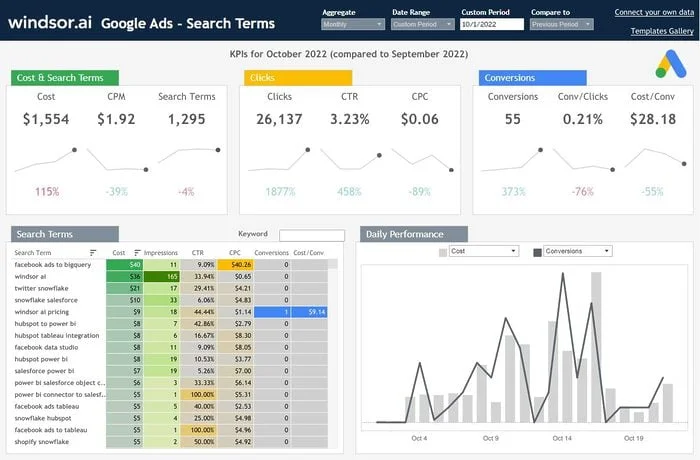
Knowing exactly where your conversions came from and at what cost can bring the success of your advertising campaigns to a whole new level. The metrics we’ve included in this section include:
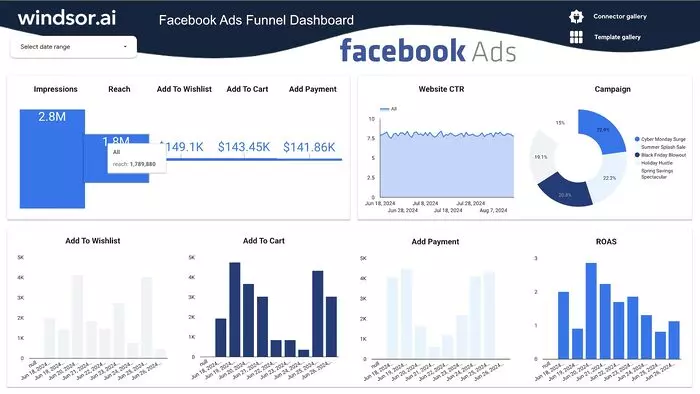
- FB Ads Cost Per Purchase
- FB Ads Purchases
- Google Shopping Cost
- Google Shopping Conversions
- Snapchat Ads Purchases
- Snapchat Ads Purchases Value
- Snapchat Ads
Customer Lifetime Value
- CLV: Evaluate the long-term value of a customer by estimating the revenue they are likely to generate over their lifetime as your customer.
- Repeat purchase rate: Measure the percentage of customers who make multiple purchases.
Fulfillment and Customer Service
- Order fulfillment status: Track the progress of orders from placement to delivery.
- Customer service metrics: Monitor customer support response times, ticket status, and customer satisfaction ratings.
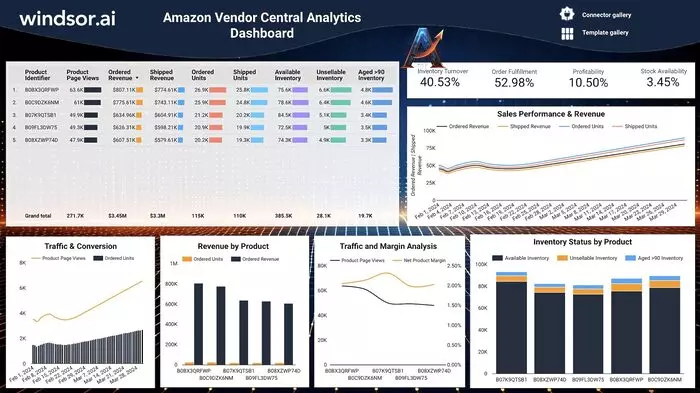
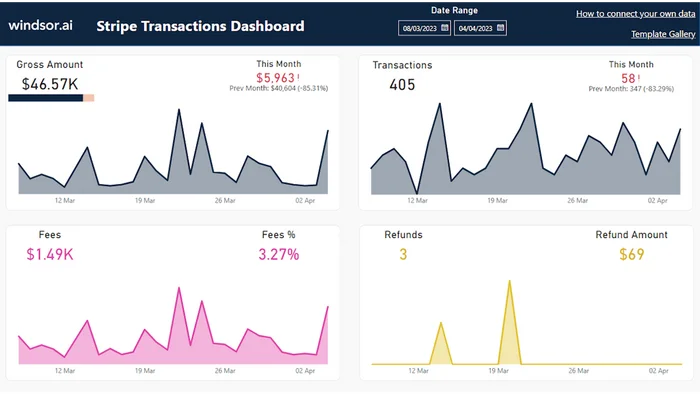
Financial Metrics
- Profit margin: Assess the profitability of your eCommerce business.
- Return on investment (ROI): Measure the effectiveness of your marketing and advertising efforts.
- Cost of goods sold (COGS): Calculate the cost of producing or acquiring the products you sell.
How do businesses benefit from E-Commerce Dashboard Templates?
As eCommerce continues its steady growth, marketers are beginning to pay more attention to the analytics features on their sales platform.
Businesses can benefit from eCommerce dashboards in several ways:
Performance Monitoring
E-Commerce dashboards provide real-time or near-real-time insights into the performance of your online store. By tracking key metrics such as sales revenue, conversion rates, website traffic, and customer behavior, you can monitor how your business is performing and identify areas of strength and improvement. By monitoring key metrics like conversion rates, cart abandonment rates, and customer feedback, you can identify bottlenecks, areas of improvement, and opportunities to enhance customer satisfaction and increase sales. To ensure the accuracy and reliability of these insights, secure eCommerce hosting plays a crucial role in protecting your data while maintaining consistent store performance.
Data Consolidation and Visualization
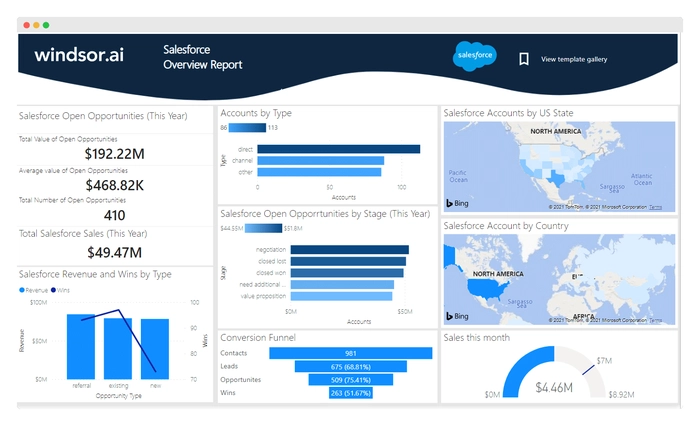
E-Commerce dashboards bring together data from various sources, such as website analytics tools, sales platforms, marketing campaigns, and customer databases. By consolidating this data into a single interface, businesses can gain a comprehensive view of their eCommerce operations. The visual representation of data through charts, graphs, and tables makes it easier to understand and interpret complex information, facilitating quicker analysis and decision-making.
Goal Tracking and Measurement
E-Commerce dashboards allow businesses to set and track goals related to sales, customer acquisition, marketing campaigns, and other performance indicators. By comparing actual results against these goals, you can assess your progress and determine whether you’re on track to meet your targets. This helps you stay focused on your objectives, identify any deviations, and take necessary actions to course-correct if needed.
Identifying Trends and Patterns
E-Commerce dashboards enable businesses to identify trends, patterns, and correlations within their data. By analyzing historical and real-time data, you can spot changes in customer behavior, seasonal trends, popular products, and other insights that can inform your decision-making. This helps you identify opportunities for growth, anticipate customer needs, and adjust your strategies accordingly.
Decision-Making and Strategy Alignment
E-Commerce dashboards provide actionable data that supports informed decision-making. By having access to accurate and up-to-date information, you can make strategic choices regarding inventory management, marketing budget allocation, pricing strategies, and more. Dashboards help align your business strategies with actual performance, ensuring that you make decisions based on data and insights rather than assumptions or guesswork.
What to include in a Looker Studio eCommerce Dashboard?
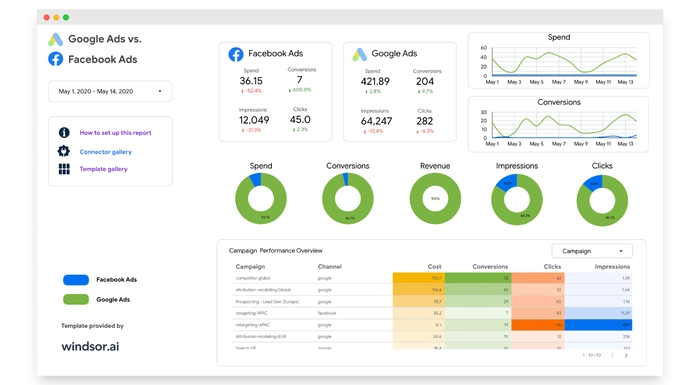
Creating a comprehensive Google Data Studio eCommerce Dashboard involves focusing on key areas and including meaningful metrics. The customization of the dashboard allows businesses to track metrics that are relevant to their specific goals.
Here’s a breakdown of essential areas and associated metrics:
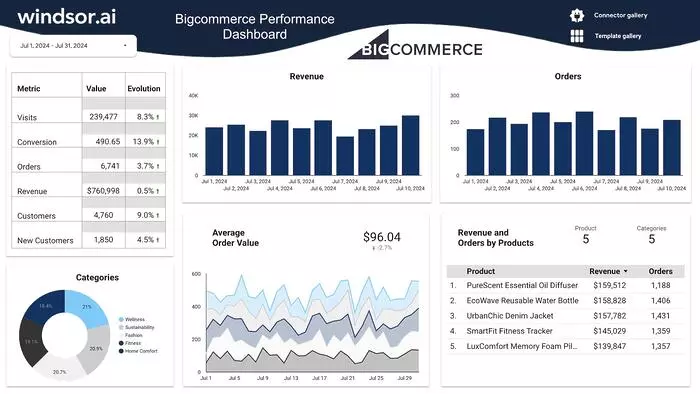
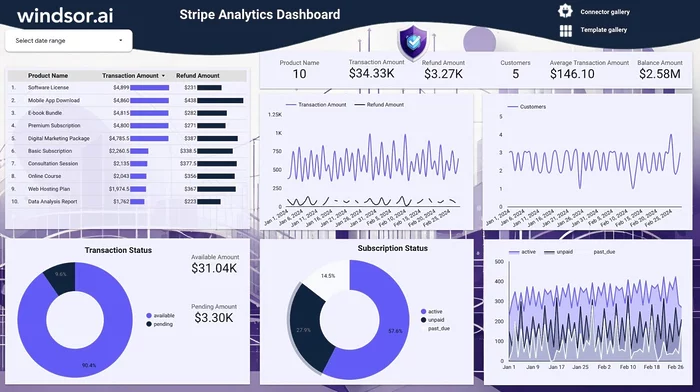
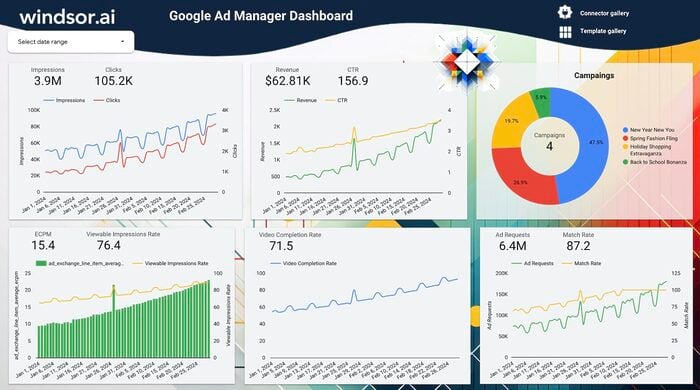
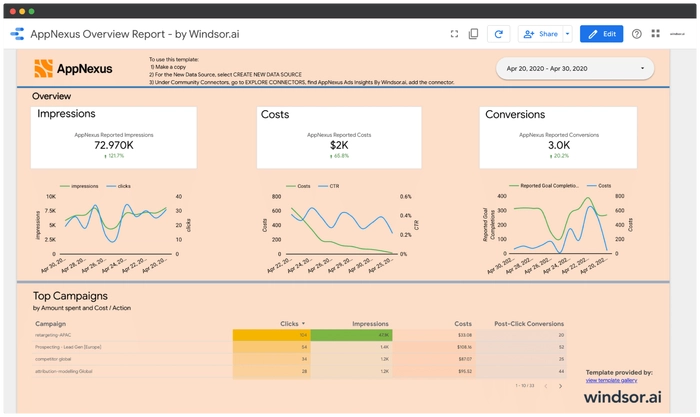
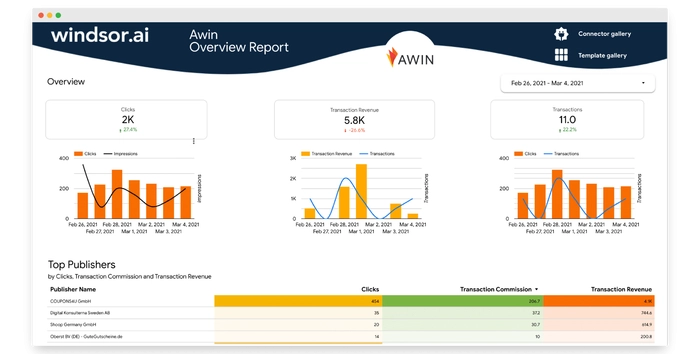
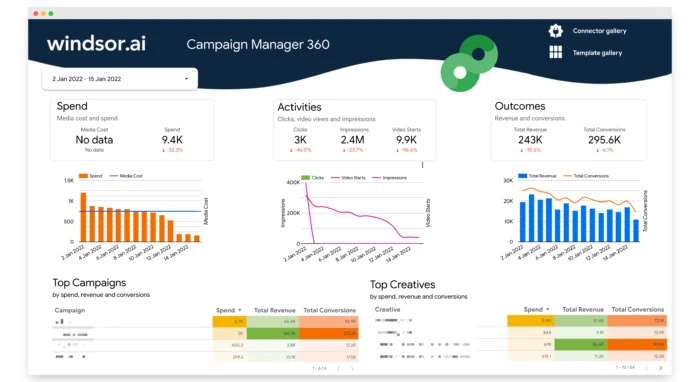
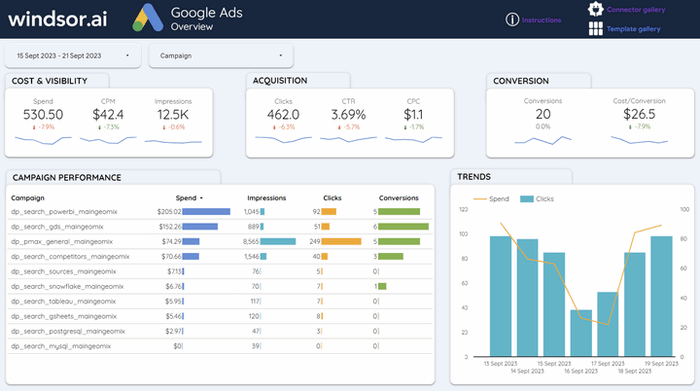
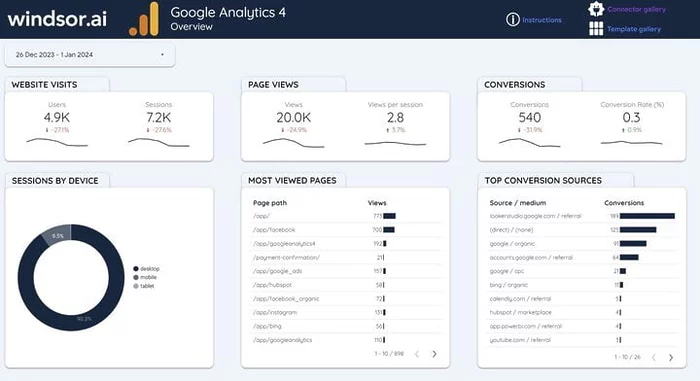
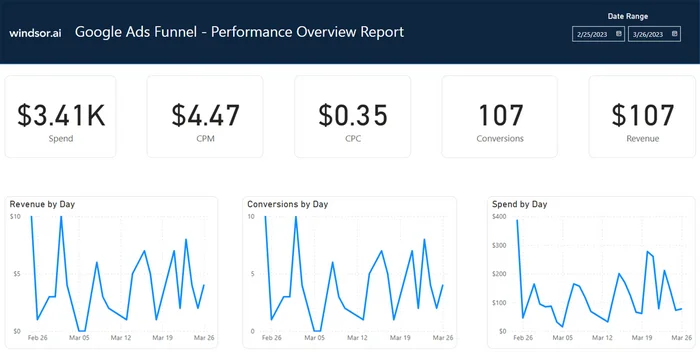
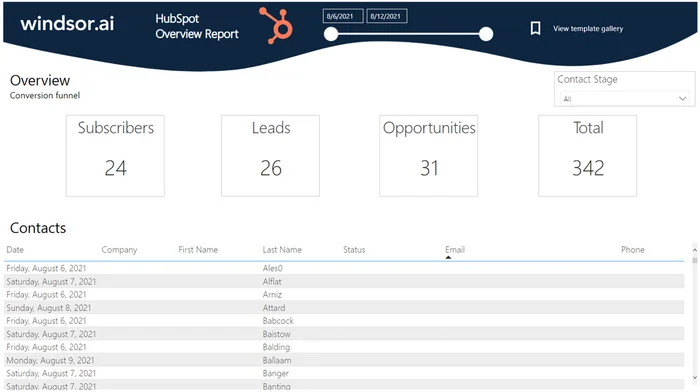
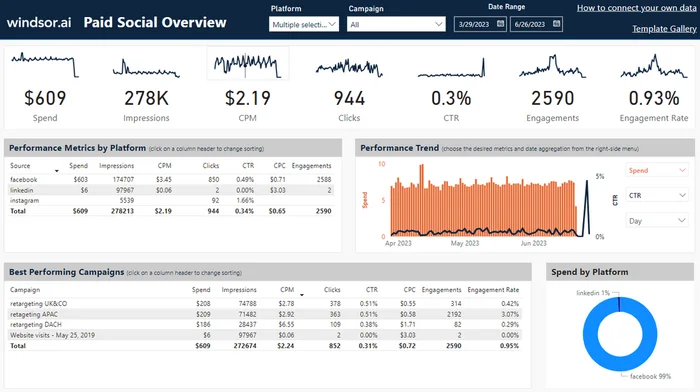
1. Performance Overview
– Clicks: Provides insight into the number of clicks on ads.
– Transactions: Tracks the complete orders processed by the eCommerce store.
– Transaction Revenue: Total revenue generated or revenue breakdown by customers or products.
– Unique Purchases: Indicates the number of times a product was purchased.
– Average Order Value: Average amount spent per customer in a transaction.
– eCommerce Conversion Rate: Percentage of visitors who become customers.
– Return on Ad Spend: Assesses the effectiveness of paid ads.
– Top Cities by Revenue: Tracks cities generating the most revenue.
– Cost: Amount spent on running ads.
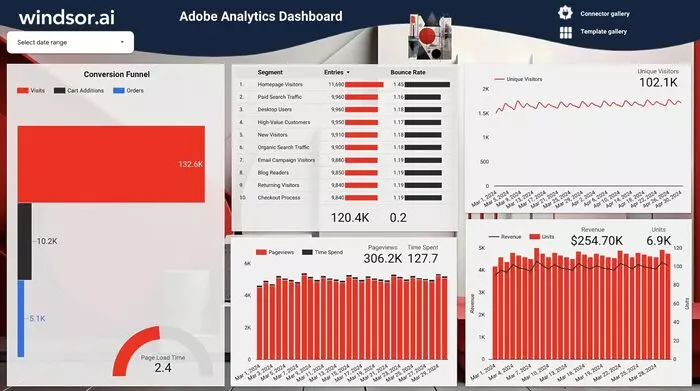
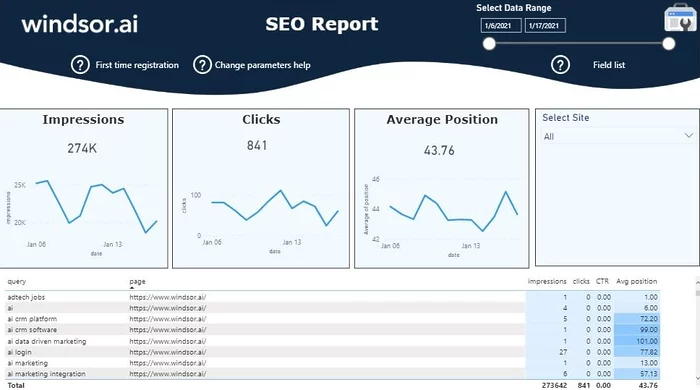
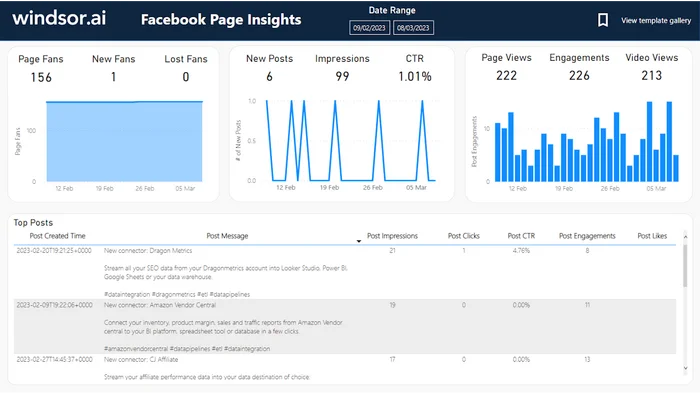
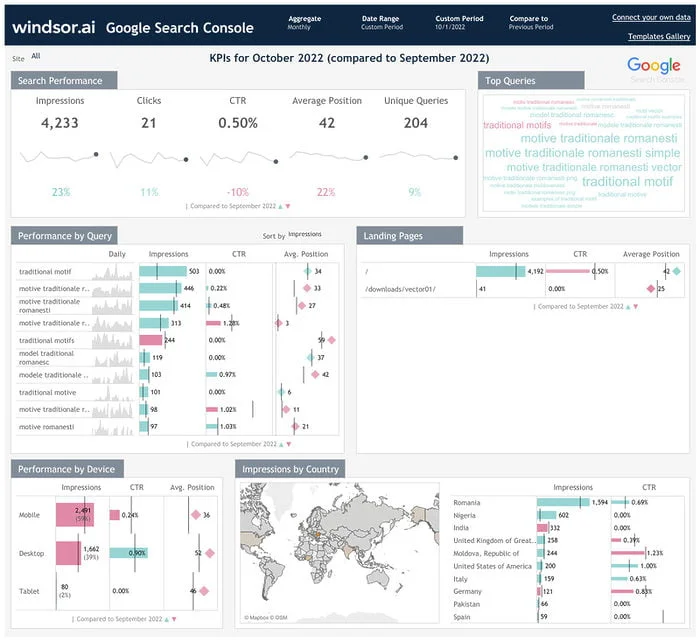
2. Visitor Behavior Analysis
– Users: Number of people visiting the online store.
– Exit Rate: Percentage of visits that reach the end of a session.
– Unique Pageviews: Records pageviews when a unique visitor views the site.
– Product Adds to Cart: Number of times a product is added to the shopping cart.
– Product Checkouts: Number of times a product reaches the checkout stage.
– Product List Views: Number of times a product is viewed in the product list.
– Product Details Views: Number of times a specific product page is viewed.
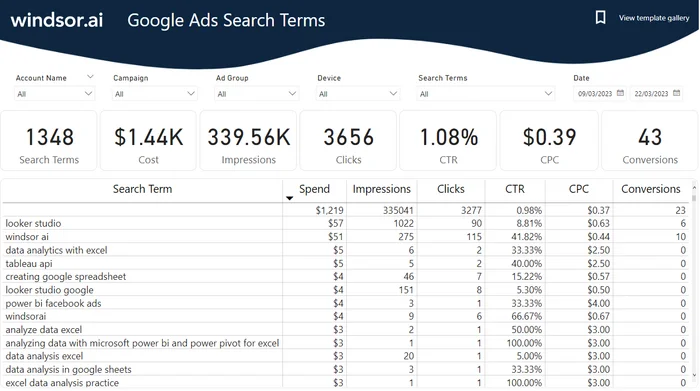
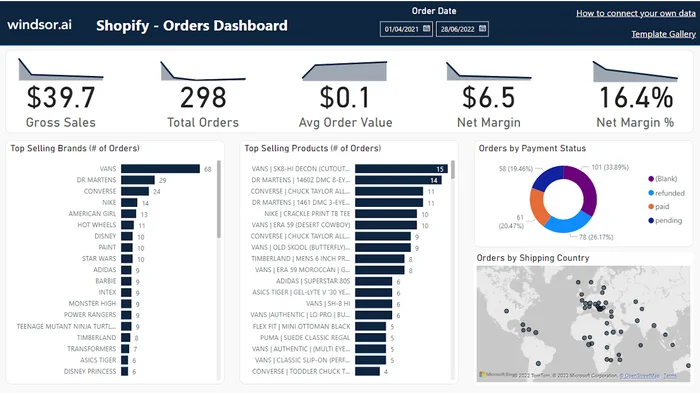
3. Order Details
– Country: Details of the country where the order or sale originates.
– Source/Marketing Channel: Identifies the channel driving the order/sale.
– Product: Details of the products sold.
What limitations does the Looker Studio eCommerce Dashboard have?
When constructing an eCommerce dashboard on Data Studio and attempting to extract data from your eCommerce store, you can face challenges. This difficulty arises because Google Data Studio has limitations on the connectors available for pulling in data from various sources.
This poses a significant challenge, particularly if you lack access to third-party connectors that would enable you to import your data into Data Studio.
Need help building your eCommerce dashboard? Get help from Windsor.ai.
The specific elements and sections included in an eCommerce report template can vary depending on the needs of the business, the audience of the report, and the scope of the analysis. It’s important to customize the template and adapt it to suit your specific requirements and goals.
Using an eCommerce report template can save time and effort in report creation, ensure consistency in reporting practices, and provide a structured framework for analyzing and presenting data.

Try Windsor.ai today
Access all your data from your favorite sources in one place.
Get started for free with a 30 - day trial.