Power BI Web Media & SEO Overview Report Dashboard Template
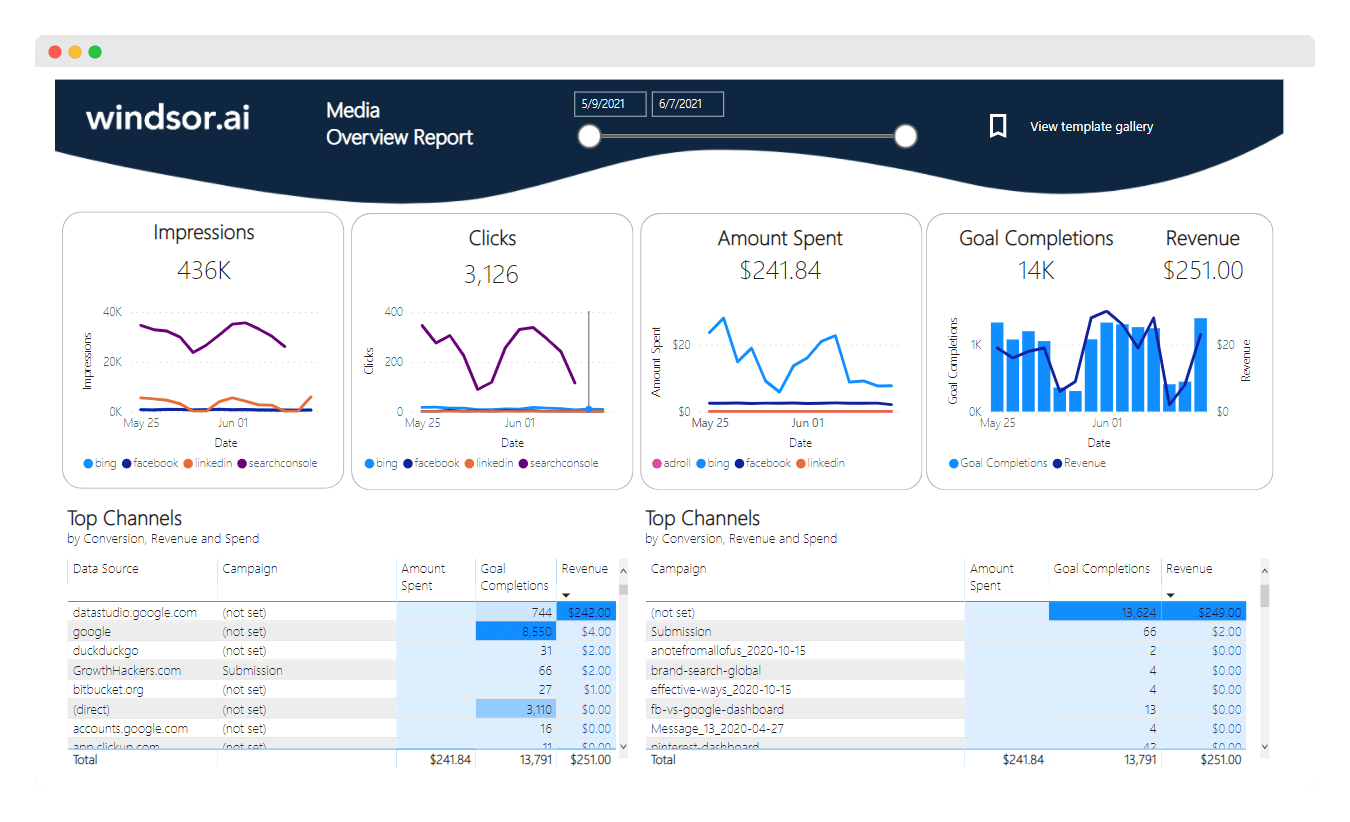
This Media and SEO Overview Report dashboard template fetches all of your advertising data and then visualizes it in a single view. It has two pages, one with the Media Overview, which helps you to integrate all your performance marketing data into one place. By default, it connects to your analytics data set (Google Analytics 4) and connects them with your media data.
The second page, SEO Overview, uses the connection to Google Search Console.
Once it’s all connected you can then get an understanding of how many clicks, impressions, and spendings you have on each channel. of each touchpoint in your customer journeys. To make it simple to understand for the purpose of client and management reporting it is kept at a high level. Metrics are provided on a media platform and campaign level.
Microsoft Power BI Web Media Dashboard connects to the following data sources:
- Meta / Facebook Ads
- Google Ads
- LinkedIn Ads
- Twitter Ads
- Microsoft/Bing Ads
- Google Campaign Manager
- Google Display & Video 360
- Google Search Ads 360
- Adform
- AppNexus
- The Trade Desk
- AdRoll
- Criteo
- TikTok Ads
- Taboola
- Outbrain
- and many more…
SEO Overview report helps you to visualize your Search Console (formerly known as Google Webmaster Tools) into Power BI in a few clicks. Dimensions and metrics available are:
- Date
- Site
- Page
- Query
- Impressions
- Clicks
- CTR
- Average position
How to setup Microsoft Power BI Web Media Overview Report Dashboard
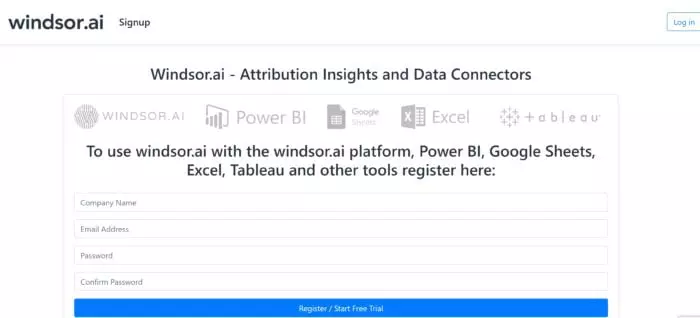
- Register or login if you already have an account.
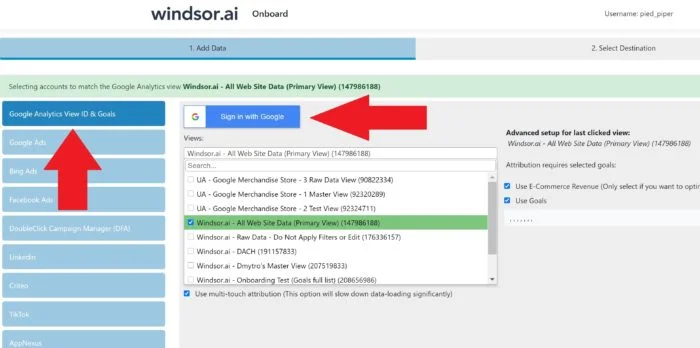
- Select at least a Google Analytics account from the dropdown and remember to grant access.
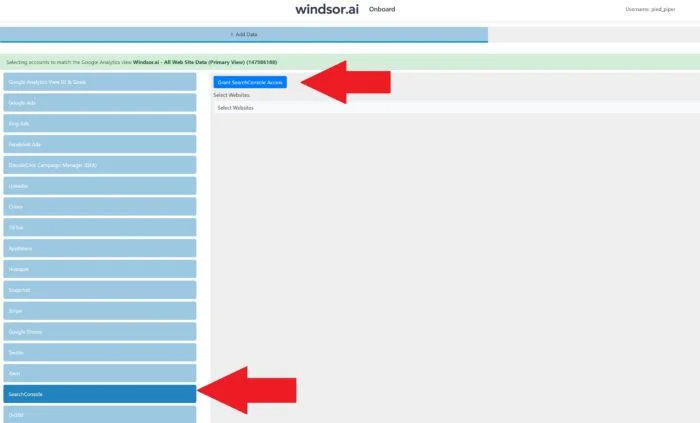
- Then Grant Access to Google Search Console (optional)
- Copy your API Key from the “Select Destination” tab
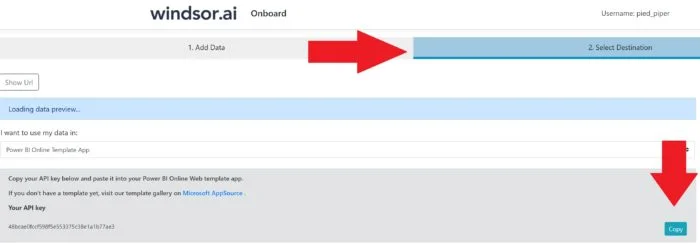
The template is available both as
Power BI Web Template
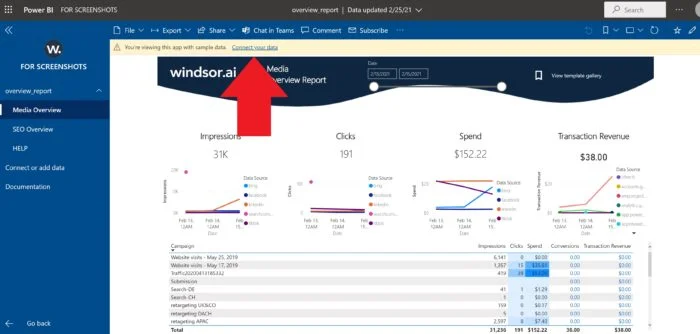
- Click on Connect your data on the App Screen
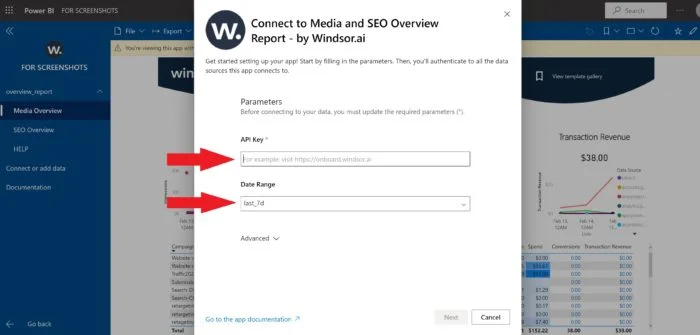
- Enter your API key from Step 1. You can also change the date range
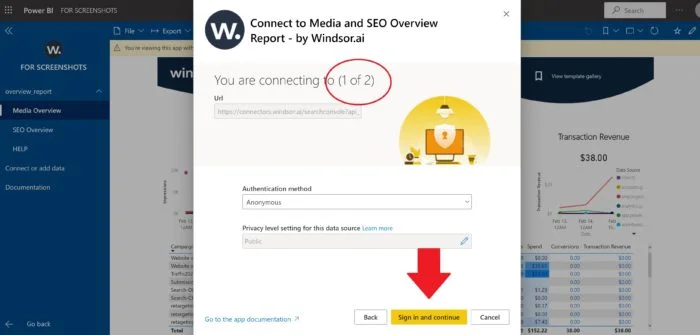
- Click on the Sign In button FOR EACH source (for Media and for SEO)
Now your dashboard is loading the data. Depending on the size of your data set this can take a few minutes. Next, the data should appear and you can start exploring your data.
Power BI Desktop
If you would like to explore how the template is built on the Power BI desktop you can also download the latest version of the dashboard template in .PBIT format.
After completing the process of registering and connecting your data from Step 1
2b. Download Power BI Desktop Template Media and SEO overview Report
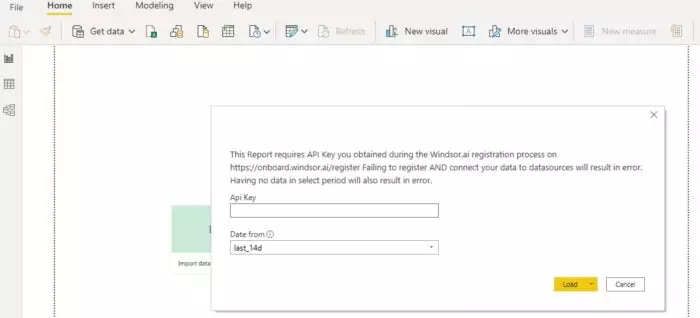
In the template on the start screen, paste your API Key from Step 1 like here

Try Windsor.ai today
Access all your data from your favorite sources in one place.
Get started for free with a 30 - day trial.
Please note that the source data are in US regional settings format (1234.56 and 2020-12-16), and if you are using the different locale settings, you might need to transform numerical and date data. This will allow you to change the visuals and join the data with other data sets you might already have in your data setup.
You May Be Also Interested in:
Free Power BI Templates in 2024
Guide to Power BI for Marketing Analytics
Free Adroll Dashboard Templates
Free Bing Ads Dashboard Templates
Free DV360 Dashboard Templates
Free Meta / Facebook Ads Dashboard Templates
Free Google Ads Dashboard Templates
Free Linkedin Ads Report Templates
Free Pinterest Ads Report Templates
Free Snapchat Ads Report Templates
Free TikTok Ads Report Templates
Free Twitter Ads Report Templates
Free Web Analytics Report Templates
Free Content Marketing Report Templates
Free Client Report Report Templates
Free SEM Report Templates
Power BI Data Sources: Different Types & How to Connect Them
Free Paid Media Report Templates
