 AI insights
 About us
 Careers
 Security
 Customer reviews
 Contact us
 Affiliate program
 Solution partners
 Looker Studio templates
 Tableau templates
 Facebook Ads templates
 Google Ads templates
 Data fields & Metrics
 AI prompt library & Guides
 Product documentation
 API documentation
 Case studies
 Blog
Blog Data models
 Windsor vs Supermetrics
 Windsor vs Fivetran
 Windsor vs Portermetrics
Free SEO Report Templates
At Windsor.ai, we strive to simplify SEO reporting and enhance your organic marketing strategies by delivering quick structured insights into key performance metrics.
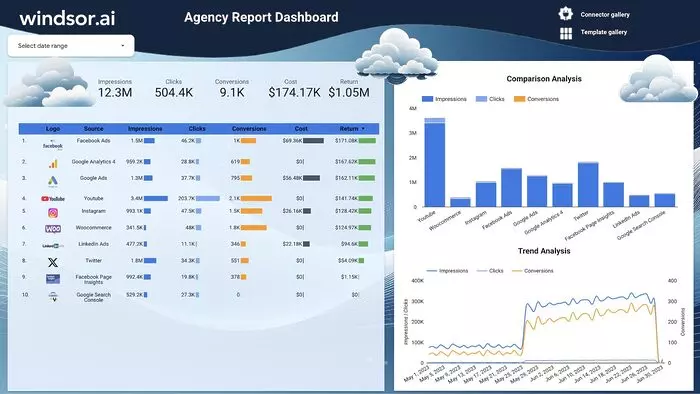
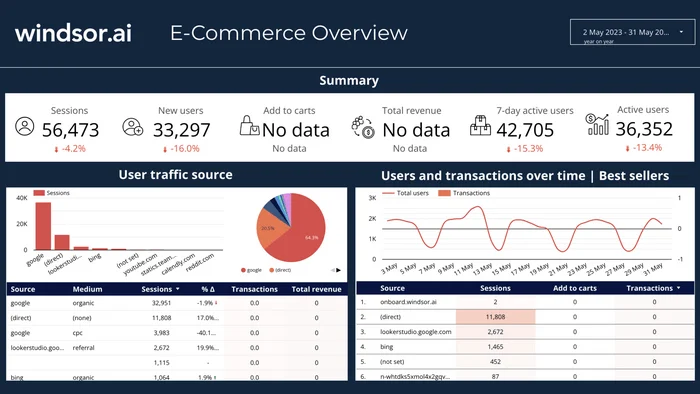
Our free SEO report templates automate web performance tracking for individual marketers, agencies, and businesses, helping you monitor progress, measure campaign effectiveness, and make data-driven decisions.
Explore our vast library of free SEO dashboards, select the most suitable template aligned with your reporting needs, and set it up in just a few clicks—no technical and coding skills are required.


Try Windsor.ai today
Access all your data from your favorite sources in one place.
Get started for free with a 30 - day trial.
What is an SEO report dashboard?
Let’s start with the basics: search engine optimization (SEO) is the process of improving website visibility in organic search engine results. The optimization of content and site structure, as well as link building, leads to higher website ranking in SERPs, meaning that more people can see it on the web. Thus, the core SEO objective is to attract as many website visitors as possible and turn them into paying customers.
But how can you determine which tactics have the greatest impact on your web ranking, identify high-priority keywords, compare your rankings with competitors, and uncover potential gaps on your website?
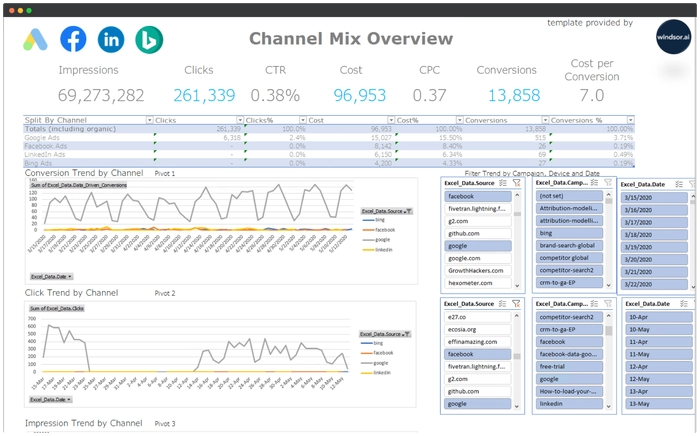
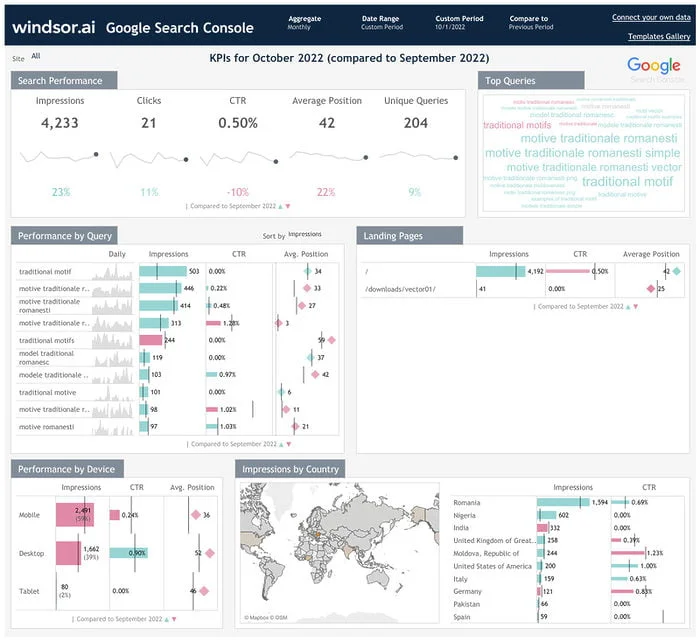
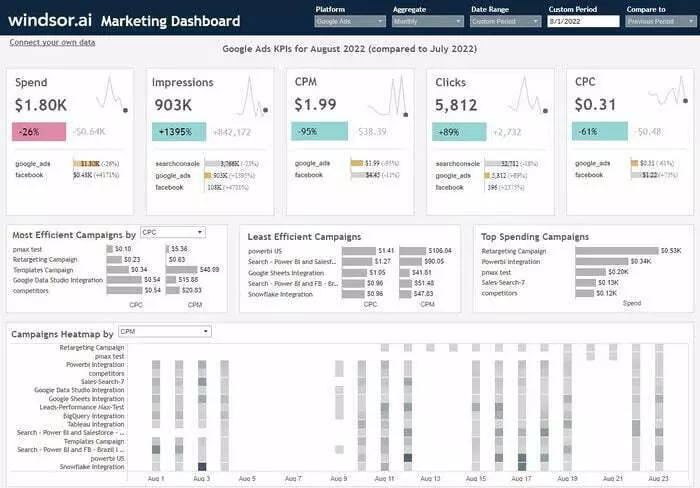
That’s where Windsor.ai’s free SEO report dashboards come in. Our pre-built templates automatically aggregate massive datasets from various SEO aspects, allowing you to track key performance indicators in one place. With structured data visualization, these marketing dashboards for SEO simplify website analytics, making it far more efficient than manual reporting.
Implementing SEO report dashboards lets businesses track their keyword performance, ranking placements, count visitor sources, and track various other essential metrics.
Components of a good SEO report template
1. Conversions
A website records conversions through the actions users complete successfully, such as purchases, sign-ups, downloads, and so on. This metric lets businesses check whether their SEO strategies lead users to perform target actions.
2. Rank improvements
An effective SEO report dashboard should highlight ranking changes and assess whether optimization efforts are improving website visibility.
3. Keyword performance
This metric estimates how effectively targeted keywords generate organic traffic. Businesses that review keyword data can use this information to refine their content creation and attract more visitors to their sites.
4. Landing page (LP) performance
Not all pages perform equally. The engagement metrics on different LPs such as bounce rate, time on page, and conversion rates help to identify the most successful and underperforming landing pages.
5. Top-performing content
Understanding which content generates the most traffic and target actions drives better decisions for future content planning. SEO report templates can highlight pages with the most views, shares, and conversions.
6. Increase in organic traffic
Organic traffic growth serves as the main indicator of SEO success. This metric tracks the number of visitors coming from search engines and other channels to assess web performance optimization progress.
7. Improvements made to content
This metric provides an overview of on-page modifications such as meta tags, content updates, and technical enhancements and how they’ve impacted rankings.
8. Technical errors
Businesses must identify and resolve technical issues on sites to ensure search engines can properly crawl and index them.
9. Backlinks
Domain authority (DA) is strongly influenced by the number of backlinks coming to your website. An effective SEO report dashboard template should track new backlinks and their correlation with the DA growth, providing insights into the effectiveness of link building efforts.
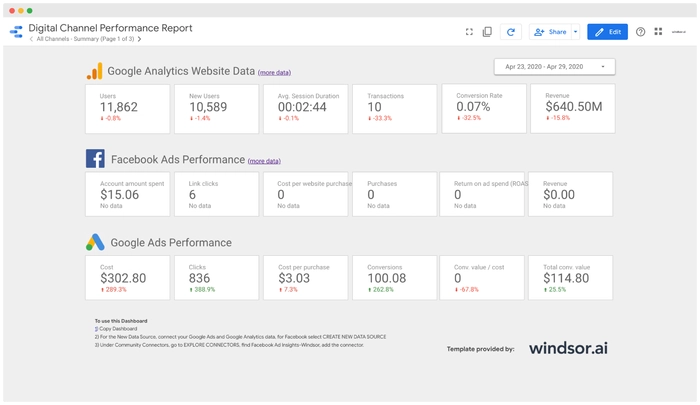
10. Inbound traffic
This metric breaks down traffic sources, showing whether visitors come from organic search, referral links, social media, paid ads, or other sources.
Benefits of using Windsor.ai’s SEO report templates
SEO report templates provide an organized structure for monitoring your KPIs, thus streamlining web performance evaluation. By using the pre-made templates from Windsor.ai, you can get the following benefits:
1. Time efficiency
The primary advantage of SEO report templates is their ability to save time. Windsor.ai provides instant report generation features that free users from manual data compilation in multiple sources; no need to create reports from scratch. This allows marketers and agencies to dedicate more efforts toward marketing strategies while reducing time spent on report generation.
2. Data visualization
Raw data tends to be overwhelming for humans because it’s difficult to interpret. Using SEO templates allows users to convert unstructured information into accurate data visualization in the form of graphs, tables, and charts, which enables easier identification of market and audience patterns. The properly arranged visuals allow businesses to evaluate their search engine performance more readily and effectively.
3. Data consistency
The standardized approach to reporting creates a consistent format within the organization. When using free SEO report templates, each stakeholder group receives structured documents that maintain professional consistency, making it easier for all parties to understand and analyze the data.
4. Extensive customization
Windsor.ai’s SEO reporting templates are fully customizable, allowing you to tailor dashboard elements to fit your specific reporting needs and align with your unique branding. Focus only on the metrics that matter—whether it’s keyword rankings, organic traffic, target actions, backlink performance, conversions, or a combination of them.
5. Improved accuracy
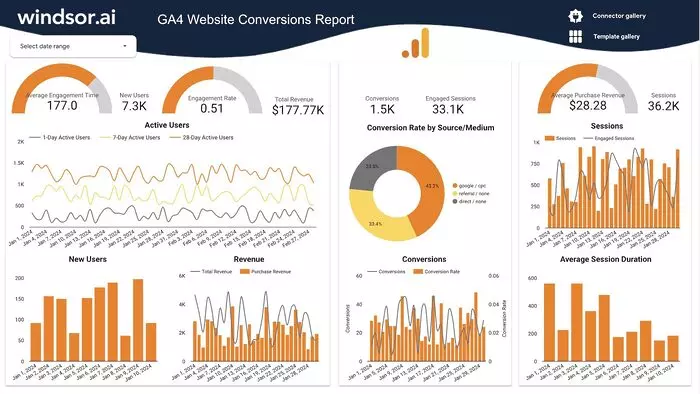
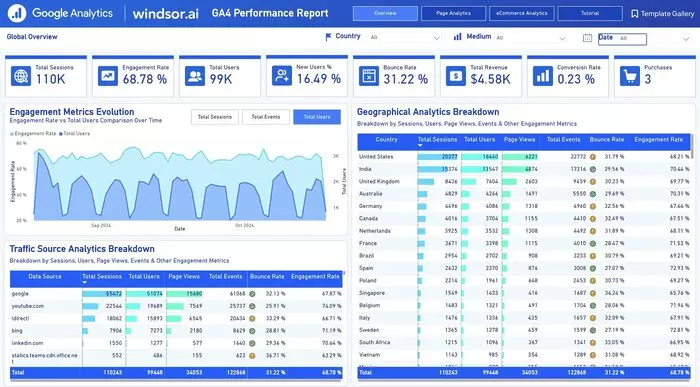
The automation of data collection minimizes human errors during the process. The integration of data from Google Analytics and Search Console into Windsor.ai’s SEO templates for Looker Studio allows you to extract accurate data directly from these platforms in just a few minutes.
How to determine your KPIs in an SEO reporting template
SEO key performance indicators (KPIs) help evaluate the effectiveness of SEO strategies. Businesses that monitor appropriate KPIs can discover their strengths and weaknesses to obtain optimized results.
Choosing specific SEO KPIs depends on your business objectives.
For example, you can select the KPIs based on your services and SEO goals:
- International SEO campaigns: Monitor organic traffic metrics from different countries.
- Local SEO campaigns: Identify your search visibility within a specific geographic area.
- Partnership Performance: Measure how inbound links and referring domains impact your organization.
A good SEO dashboard usually contains the following essential KPIs:
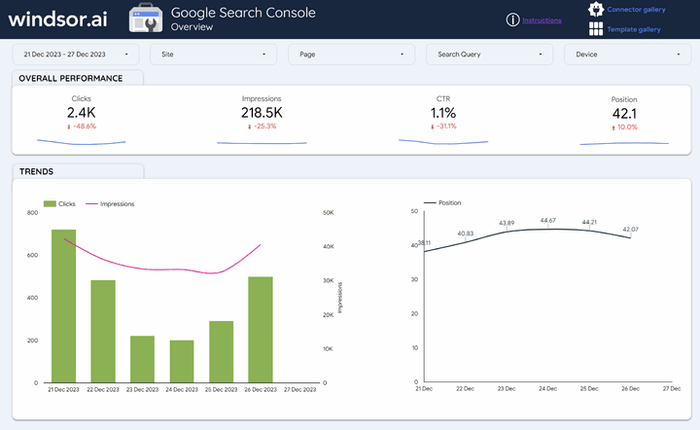
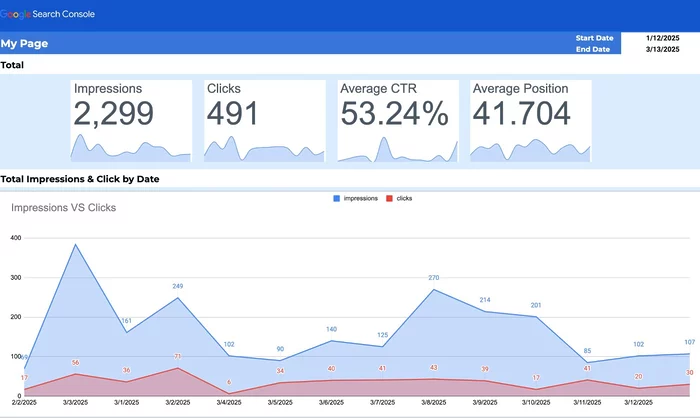
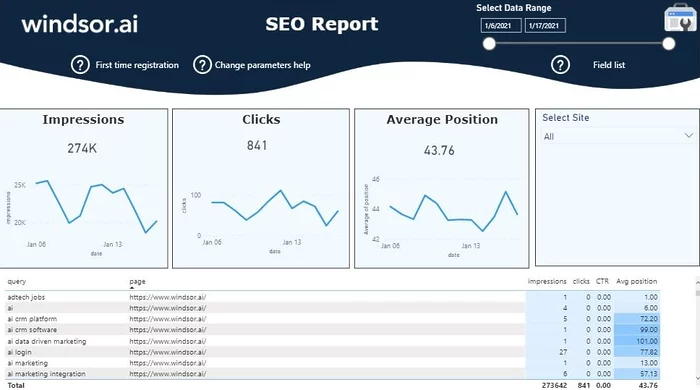
Impressions
Impressions indicate how often a website appears in search results. While they reflect visibility, they do not guarantee clicks. A high number of impressions suggests good exposure, but a low CTR may signal the need for improved meta descriptions and titles to attract more users.
Keywords
The essential component of search engine optimization is using appropriate keywords. Tracking keyword performance gives businesses valuable insights about the search terms that bring traffic along with those that need optimization efforts. Consider using our free keyword rank tracking template to see your keyword position, search terms, and CTR.
Average position
The average position measures how a website ranks for each monitored keyword. Higher keyword rankings lead to increased traffic and better visibility. Since most users don’t go beyond the first search results page, achieving a top position is crucial for engagement.
Total clicks
A website gains visitor clicks when users select its pages from search engine results. Total clicks are the number of times people using search engines click on your website from SERPs. Tracking total clicks helps you understand bottlenecks in your SEO campaign.
If the above metrics (impressions, keywords, and average position) show improvement, then total clicks should have the same positive tendency. But if it doesn’t, it indicates you should make some tweaks to your web page titles or meta descriptions to generate more interest in your pages.
Click-through rate (CTR)
The CTR metric measures how often users click on a website or ad after seeing it. A low CTR may indicate the need to improve title tags or meta descriptions. This metric is crucial for assessing how relevant and compelling users find a web page appearance in SERPs.
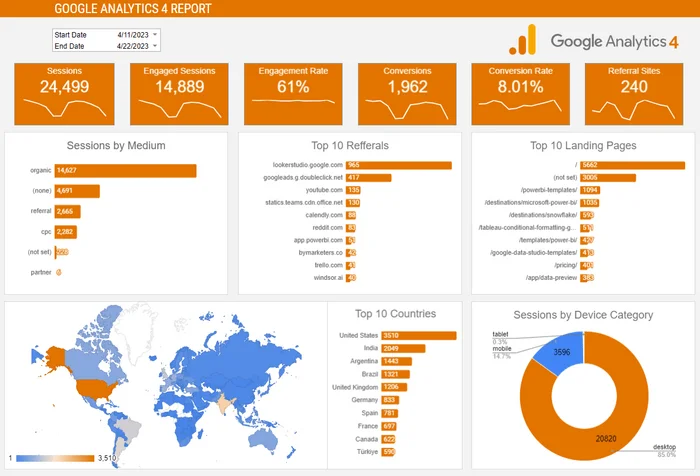
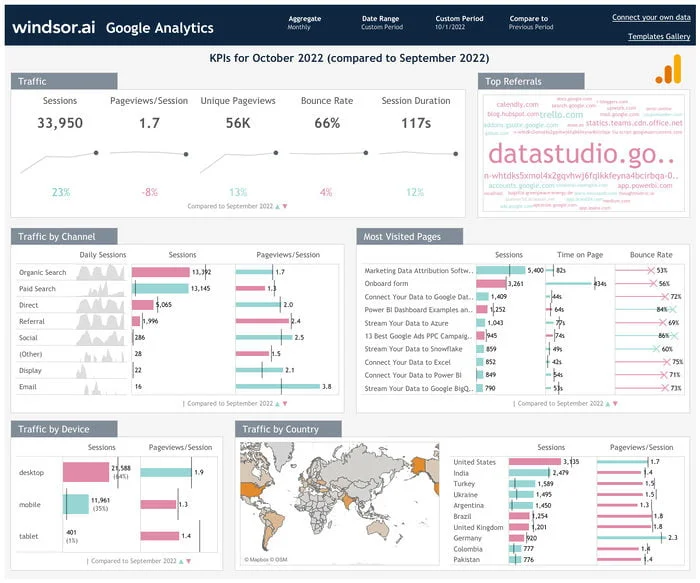
Country
International SEO requires businesses to track traffic across different countries because it helps them understand audience location while monitoring site performance in each region.
Different practices are used in international SEO, including dedicated URLs for each localized content variant, country-specific keywords, language-targeted web pages, the hreflang attribute, etc. To know the effectiveness of these international SEO practices, you need to track the number of visitors per country.
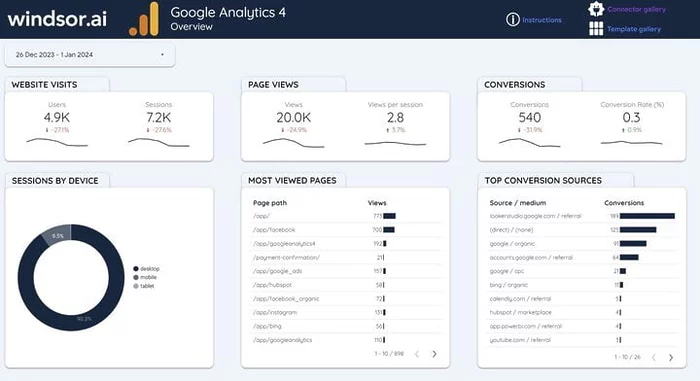
Device type
The device type metric helps you visualize the devices that your site visitors use so that you can optimize your site to maximize traffic and conversions. Knowing this matters as it gives valuable insights into the optimization of your site’s responsiveness and technical state.
For example, more web traffic now comes from mobile devices than other devices. The current web traffic stats show that 59.77% of web traffic comes from mobile devices as opposed to 37.96% from desktops and 2.27% from tablets. Thus, meager mobile traffic may signal that your website is not optimized for mobile devices.
Another important metric related to device type is “conversions per device type.” Tracking this metric shows you the effectiveness of your CTAs and action buttons relative to the different devices. It can help you optimize these elements for more conversions.
10 essential components for your local SEO report template
- The cover page – Introduces brand elements together and reports specifications.
- Report summary – Provides key findings together and essential performance trends that capture the reader’s attention.
- Local SEO overview – Offers a snapshot of local search visibility.
- Local SEO keyword rankings – Shows current keyword positions compared to their initial ranking.
- Local SEO audit – Identifies potential technical SEO issues.
- Backlinks summary – Monitors link building results.
- Google Business profile reviews – Analyzes customer feedback on Google My Business.
- Google Analytics organic search (goals) – Tracks organic traffic and conversions on the website.
- Call tracking – Tracks local search-based calls to the business.
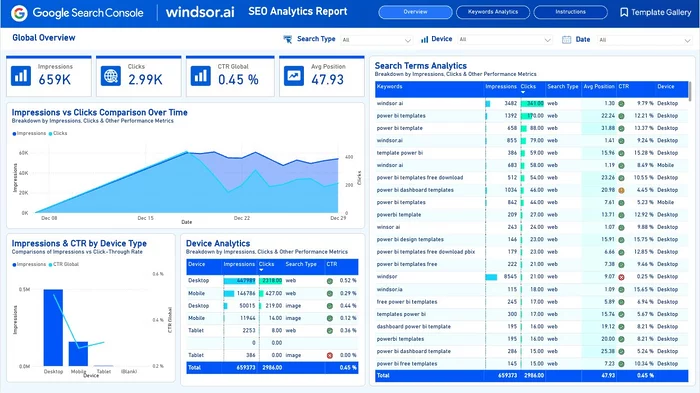
- Google Search Console top pages – Identifies best-performing pages on the website.
Windsor.ai helps your organization improve SEO reporting by centralizing all data related to your organic marketing results in a single dashboard. Streamline your analysis and make data-driven decisions with our pre-built marketing templates for SEO. Start your free 30-day trial today!
Try Windsor.ai today
Access all your data from your favorite sources in one place.
Get started for free with a 30 - day trial.