 Destinations
 Data sources
 AI insights
 About us
 Careers
 Security
 Customer reviews
 Contact us
 Affiliate program
 Solution partners
 Template gallery
 Looker Studio templates
 Power BI templates
 Excel templates
 Google Sheets templates
 Tableau templates
 Facebook Ads templates
 Google Ads templates
 Data fields & Metrics
 AI prompt library & Guides
 Product documentation
 API documentation
 Case studies
 Blog
Blog Data models
 Windsor vs Supermetrics
 Windsor vs Funnel.io
 Windsor vs Fivetran
 Windsor vs Rivery
 Windsor vs Portermetrics
 Windsor vs Coupler.io
Free Data Analytics Report Templates
The Windsor.ai data analytics templates gallery has more than seventy pre-built dashboards to help you automate your visualizations and reporting. The templates encompass all key applications, such as marketing analytics, customer insights, finance and accounting. You will find pre-built data analytics dashboard templates for any applications you can think of, including Salesforce Marketing Cloud, Yahoo Finance, Quickbooks, CoinMarketCap and any customer data platform.
To use the free data analytics templates, begin by determining your data analytics needs and identifying your data source. You then identify the business intelligence tool in which you want to be producing the automated reports. Lastly, select the template, connect the data source, and instantly build your first data analytics report.
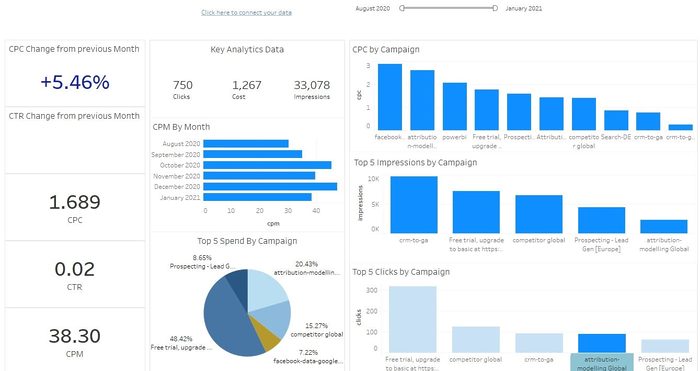
Tableau Bing Ads Overview Dashboard Template


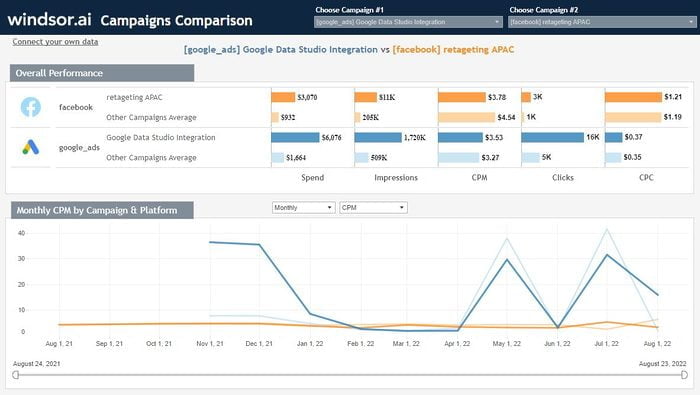
Tableau Compare Campaigns Performance Dashboard Template







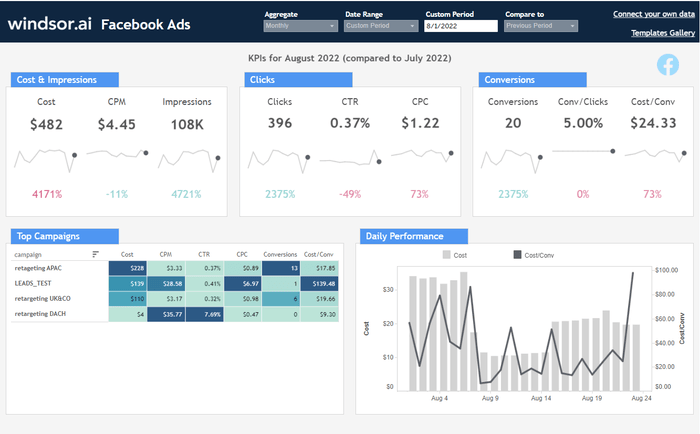
Tableau Facebook Ads Report Dashboard Template
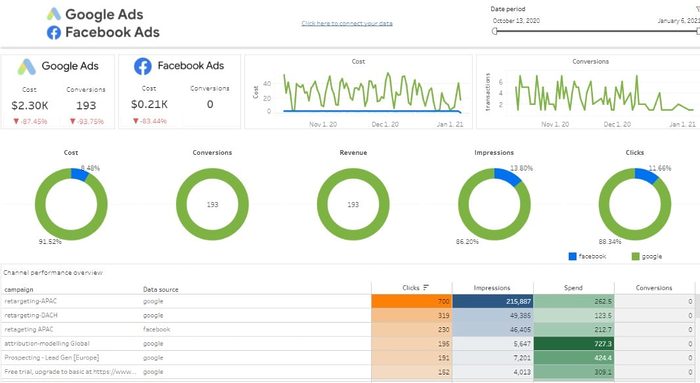
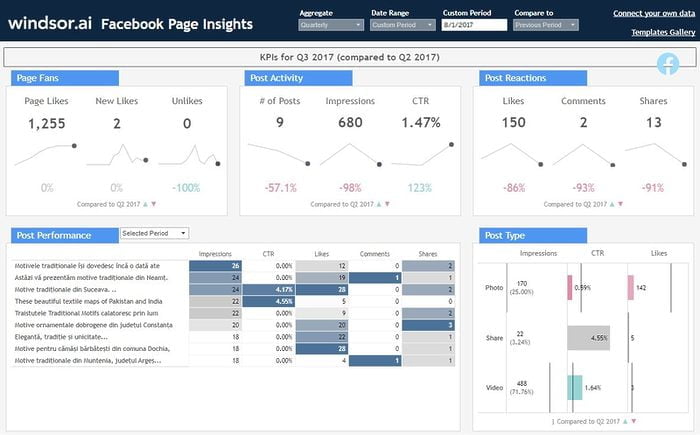
Tableau Facebook Page Insights Dashboard Template
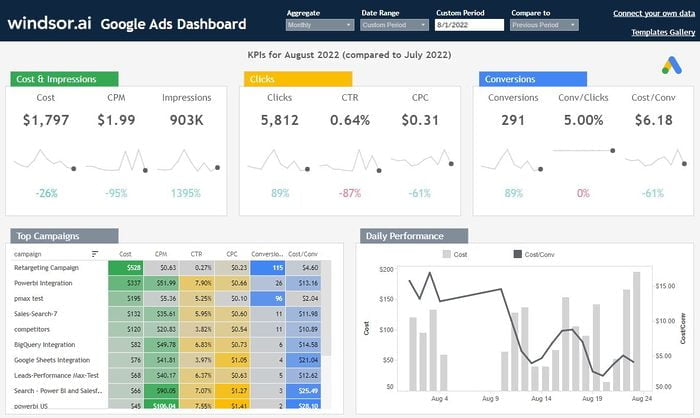
Tableau Google Ads Dashboard Template
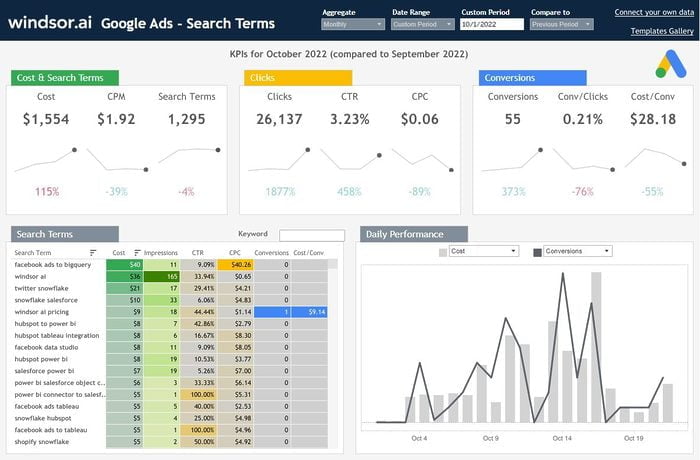
Tableau Google Ads Search Queries Dashboard Template
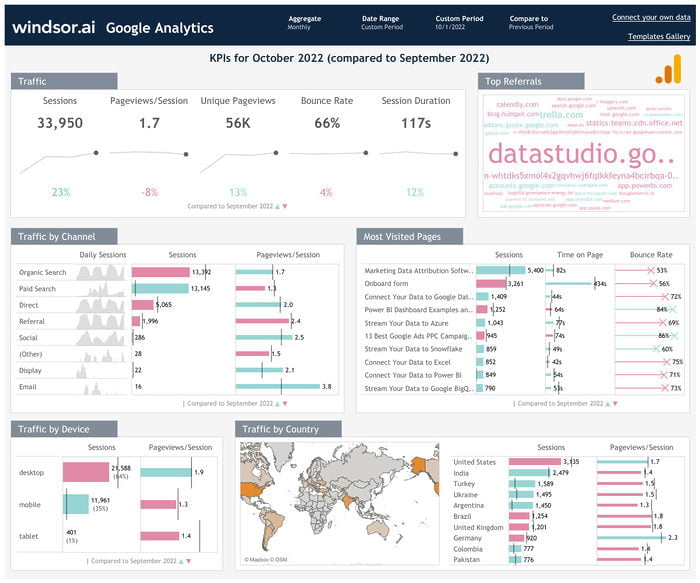
Tableau Google Analytics Dashboard Template

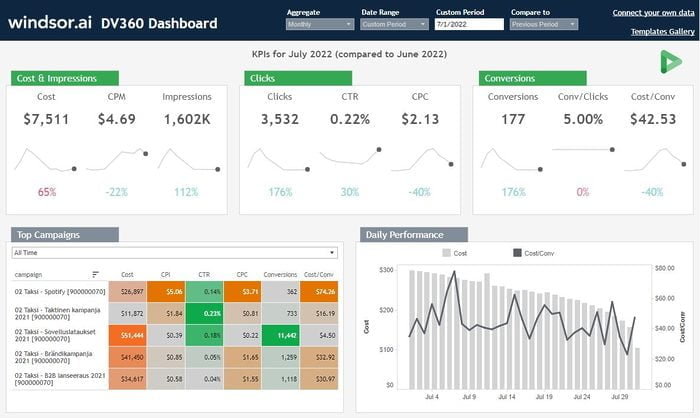
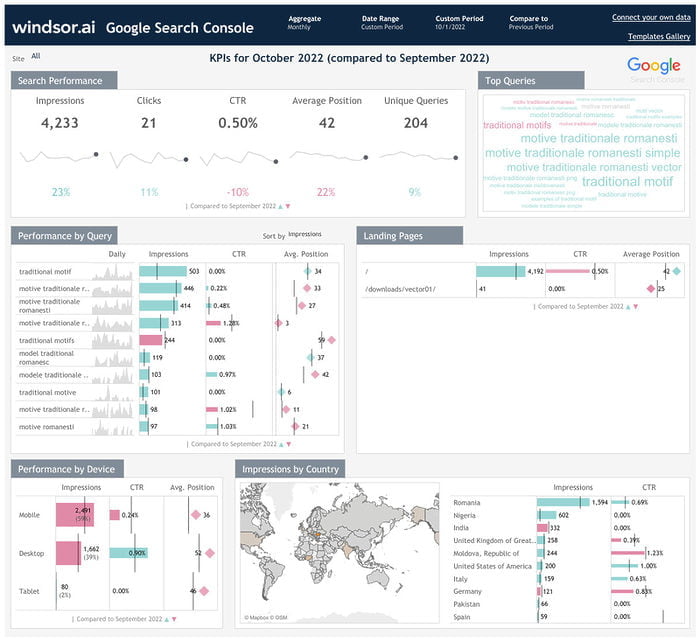
Tableau Google Search Console Dashboard Template

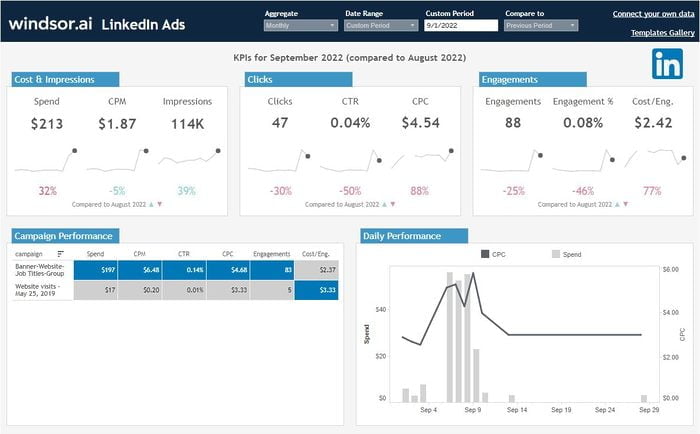
Tableau LinkedIn Ads Dashboard Template
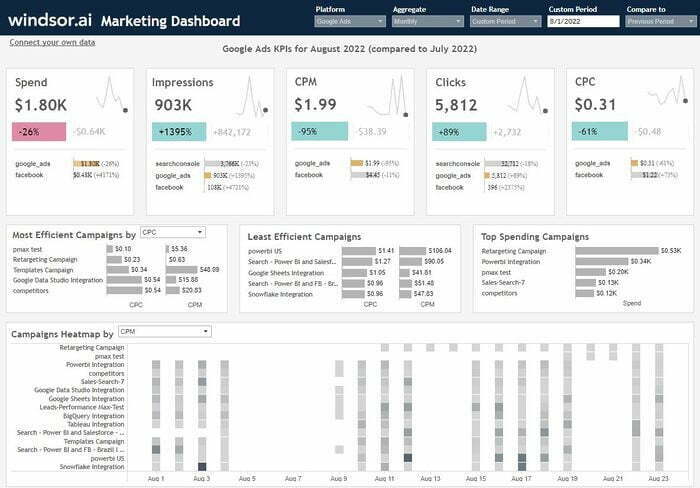
Tableau Multichannel Attribution Dashboard Template
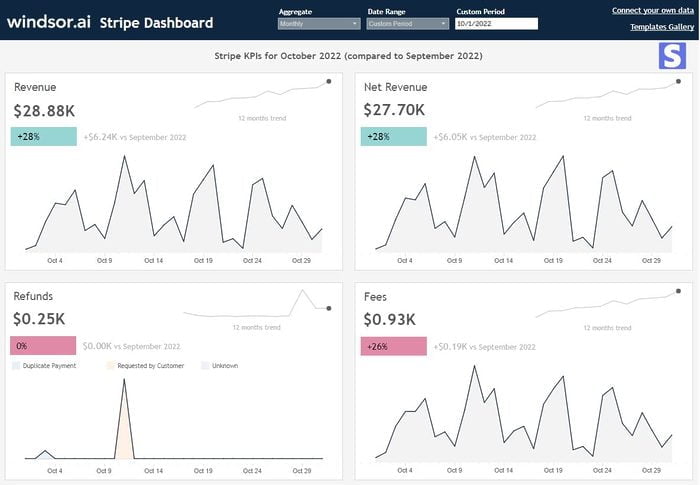
Tableau Stripe Dashboard Template

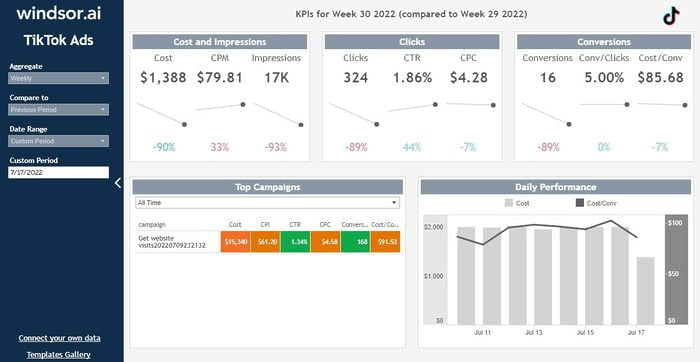
Tableau TikTok Ads Dashboard Template
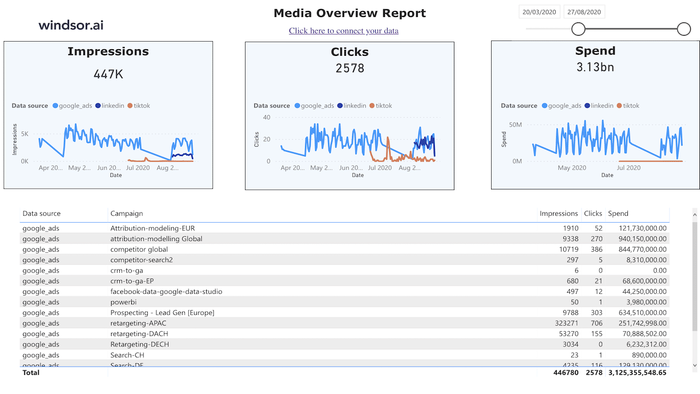
Tableau Web Media Overview Dashboard Template




What is Data Analytics Reporting Dashboard?
A data analytics reporting dashboard is a template that you can use to build, customize, and automate your business reports. The data analytics templates match your data sources to the business intelligence tool to ensure concurrent metrics and dimensions from the data. For instance, if you need a data analytics template for Google Ads in Power BI, you search our data analytics templates gallery for that specific dashboard using the name of the app.
Why is Data Analytics Reporting Important?
Data analytics reporting is important for every business. The analytics breaks down data into information for decision-making. The data analyst conducts various analyses, including predictive analytics and trend analysis, to project the future direction of business performance. As such, the business can forecast future events and prepare operational and strategic plans.
Benefits of Using Data Analytics Reporting Dashboards
Data analytics reporting dashboard templates simplify the work of the data analyst by enabling efficient data mapping and automation of reports. With a high level of automation, the time for data analysis and reporting can be reduced from days to minutes. Here are more benefits of using the data analytics reporting dashboards:

Measure and track all your key performance indicators
The data analytics are designed to track all metrics. Whether it is sales, conversion rates, marketing campaign performance metrics like ad views and clicks, or customer engagement metrics, you will find a suitable express dashboard for your data analytics. You can also track the performance of your sales and campaigns using real-time dashboard features.

Grow sales and attain your return on investment targets
The data analytics dashboard templates also help you attain sales growth and ROI targets. Using the dashboard templates, you get data insights that show you areas where your investments would increase sales growth and at the same time create the best ROI.

Enhance customer experience and lifetime values
Using data analytics, you can determine cause-and-effect associations between the factors influencing customer experience, engagement, and lifetime values. You can then take action to enhance the metrics, creating happier and more engaged customers.
FAQs
What is data analytics used for?
Data analytics is used for decision-making. It is used to transform data to insights and information that can be processed to inform business decisions, operations, and strategies.
How much is data analytics dashboard templates?
The data analytics reporting dashboard templates are free. You only need to integrate your data sources, such as marketing or accounting apps.
Turn your data into a strategic asset. Get instant insights across all your platforms with Windsor.ai


