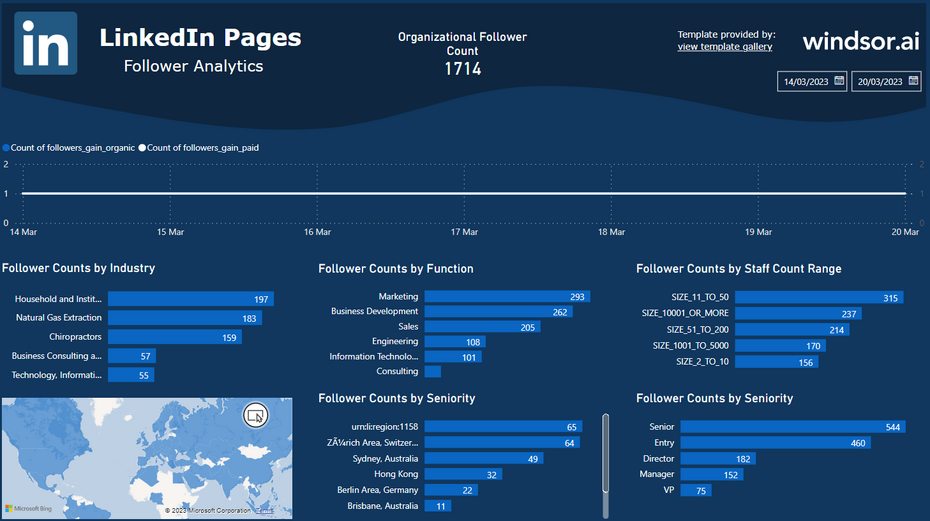
This LinkedIn Page Insights Dashboard Report Template for Power BI helps you to visualize your own LinkedIn organic data in Power BI in a few clicks.
Follow the steps outlined below to get your data connected.
The template is available both as
Power BI Web Template
- Connect your LinkedIn Organic Data to Windsor.ai
Register for free or login if you already have an account.
- Choose LinkedIn Organic from the left-side menu, click on “Grant LinkedIn Organic Access” then follow the steps in the pop-up window.
- Select your LinkedIn Page from the drop-down.
- Click on Preview and Destination, choose Power BI Web, then copy your API Key.
- Install the Power BI Web App
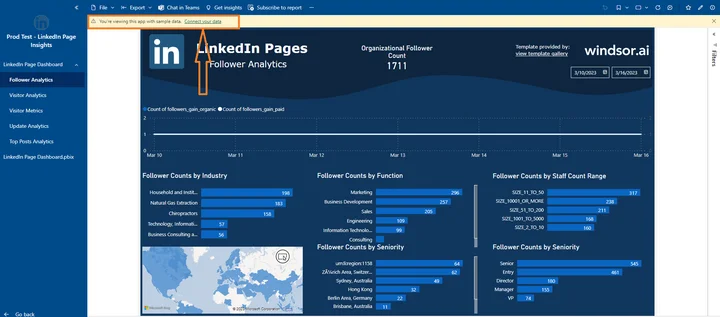
- Click on Connect your data in the upper section of the dashboard.

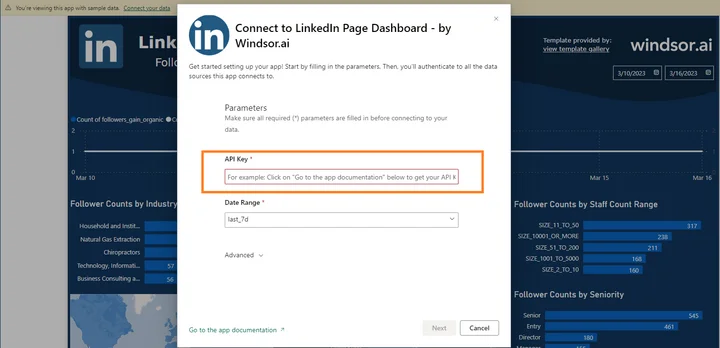
- Enter your API Key from Step 4.

- On the next screen click on Sign In
- Your data should be loading now. Depending on your data size this may take a minute or two.
- Connect your LinkedIn Organic Data to Windsor.ai
Power BI Desktop
- Connect your LinkedIn Organic Data to Windsor.ai
Register for free or login if you already have an account.
- Choose LinkedIn Organic from the left-side menu, click on “Grant LinkedIn Organic Access” then follow the steps in the pop-up window.
- Select your LinkedIn Page from the drop-down.
- Click on Preview and Destination, choose Power BI Web, then copy your API Key.
- Download the Desktop Template
Download Power BI Desktop Template: LinkedIn Page Insights Report
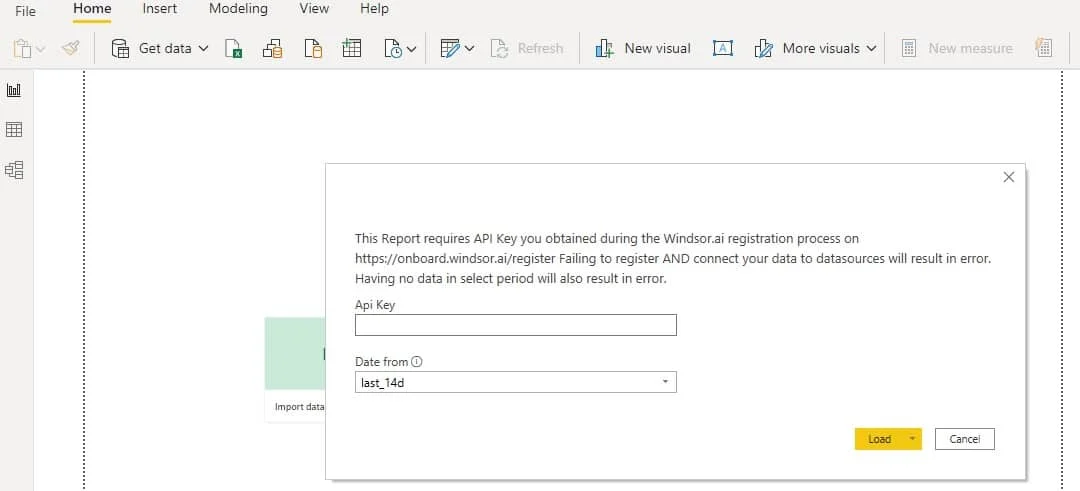
- When opening the template, on the start screen, paste your API Key from step 4:

Power BI LinkedIn Insights Dashboard Template: metrics and dimensions
Below are the predefined metrics and dimensions available in the template. However, you can any other field you need in the connection string.
Dimensions:
- Date
- Followers Industry
- Followers Function
- Followers Staff Count Range
- Followers Seniority
- Followers Country
- Followers City
- Post Title
- Metrics:
- # of Followers
- # of Visitors
- Page Views
- About Unique Page Views
- Careers Unique Page Views
- Shares
- Comments
- Likes
- Likes on Shares
- Impressions
- Clicks
The Power BI LinkedIn Page dashboard template can be customized with > 50 different dimensions, breakdowns and metrics. Head here to see a complete list: available metrics and dimensions.
It queries the data through our connector and makes it available in real-time.
You might also be interested in…
- Best Linkedin Pages report templates for 2023
- How to connect Linkedin Ads to Power BI
Best Social Media Dashboarr Reports Best E-Commerce Dashboard Templates Best Client Report Templates Best Lead Generation Dashboard Templates Best Web Analytics Report Templates Best Data Analyst Report Templates Best Marketing Automation Report Templates Best Small Business Report Templates Best Content Marketing Dashboar Templates

