 Destinations
 Data sources
 AI insights
 About us
 Careers
 Security
 Customer reviews
 Contact us
 Affiliate program
 Solution partners
 Template gallery
 Looker Studio templates
 Power BI templates
 Excel templates
 Google Sheets templates
 Tableau templates
 Facebook Ads templates
 Google Ads templates
 Data fields & Metrics
 AI prompt library & Guides
 Product documentation
 API documentation
 Case studies
 Blog
 Data models
 Windsor vs Supermetrics
 Windsor vs Funnel.io
 Windsor vs Fivetran
 Windsor vs Rivery
 Windsor vs Portermetrics
 Windsor vs Coupler.io
7 Free Small Business Dashboard Templates (Data Studio, Google Sheets)
Choose a free small business dashboard template for Data Studio (Looker Studio) or Google Sheets.
Track store sales from WooCommerce, BigCommerce, and Square. Monitor profit and expenses from QuickBooks. Measure calls, direction requests, and reviews from Google Business Profile.
Each template includes setup instructions to connect your accounts through Windsor.ai.
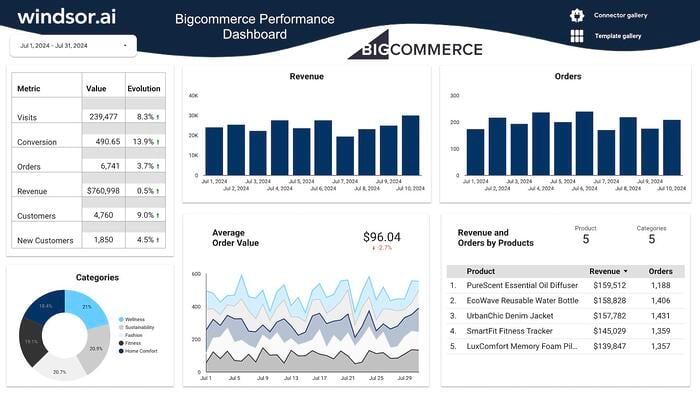
Free Looker Studio BigCommerce Dashboard Template


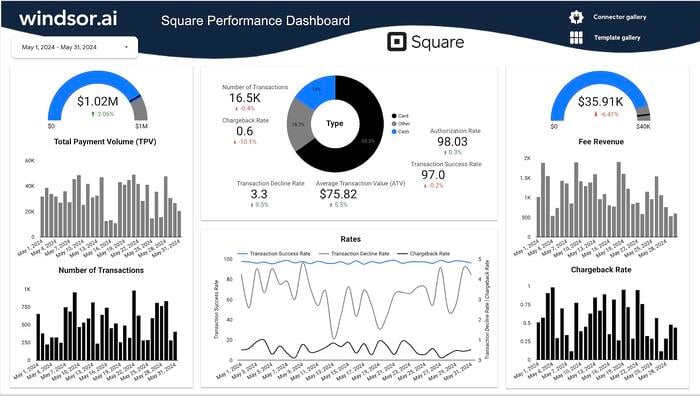
Free Looker Studio Square Dashboard Template

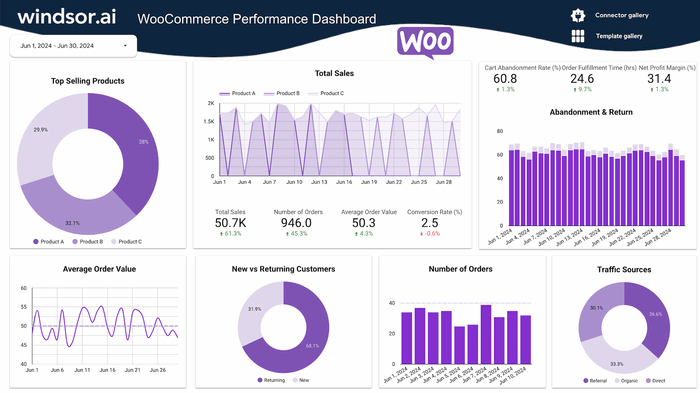
Free Looker Studio WooCommerce Dashboard Template


Google Business Profile Google Sheets Template


Looker Studio Google My Business Dashboard Template
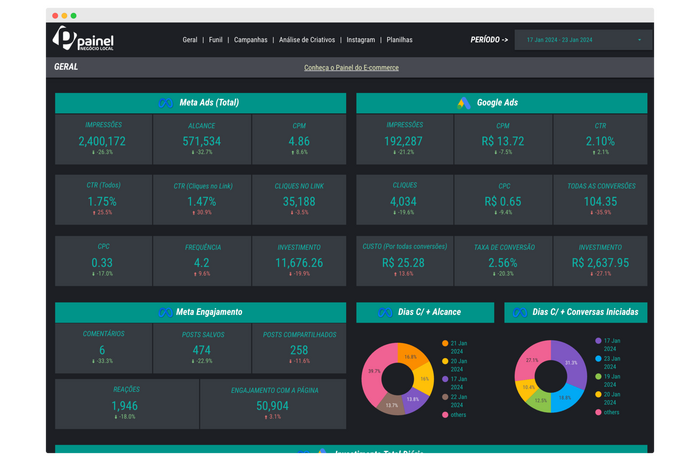
Looker Studio Painel Para Negócios Locais




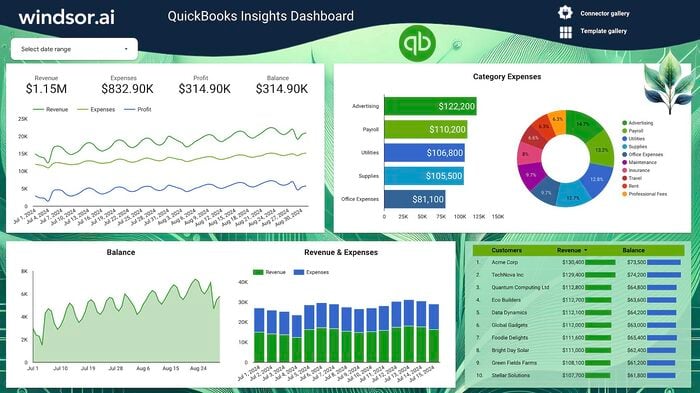
Quickbooks Insights Dashboard Templates on Looker Studio

What is a small business dashboard?
A small business dashboard shows what you sold, what you spent, and where your customers came from. It brings together store sales, accounting data, and customer activity from Google Business Profile. Measuring your Google Business Profile activity can be difficult: in the example below, GA4 can’t identify the source of two-thirds of Windsor.ai’s sign-ups.
Build your dashboard in Data Studio or Google Sheets. Windsor.ai connects data from WooCommerce, QuickBooks, Google Business Profile, and other sources, so you don’t need manual CSV exports. Owners can check performance each week, while bookkeepers and agencies can use the same data to report to them.
Which small business dashboard template to pick
The table lists all 7 free templates in this gallery. Some template titles still mention Looker Studio, Data Studio’s previous name.
| Template | Tool | Platforms | Best for | Key metrics |
|---|---|---|---|---|
| Data Studio WooCommerce | Data Studio | WooCommerce | Store sales by product, order channel and customer type | total sales, orders, average order value, top-selling products, orders by channel, new vs. returning customers, tax, shipping, discounts, refunds |
| Data Studio BigCommerce | Data Studio | BigCommerce | Revenue and orders by product and category | revenue, orders, average order value, product views, conversion rate, customers, revenue by product and category |
| Data Studio Square | Data Studio | Square | Card and cash payments for a shop, café or salon | total payment volume, fee revenue, average transaction value, transactions, success and decline rates, payments by source (card, cash, other), refunds |
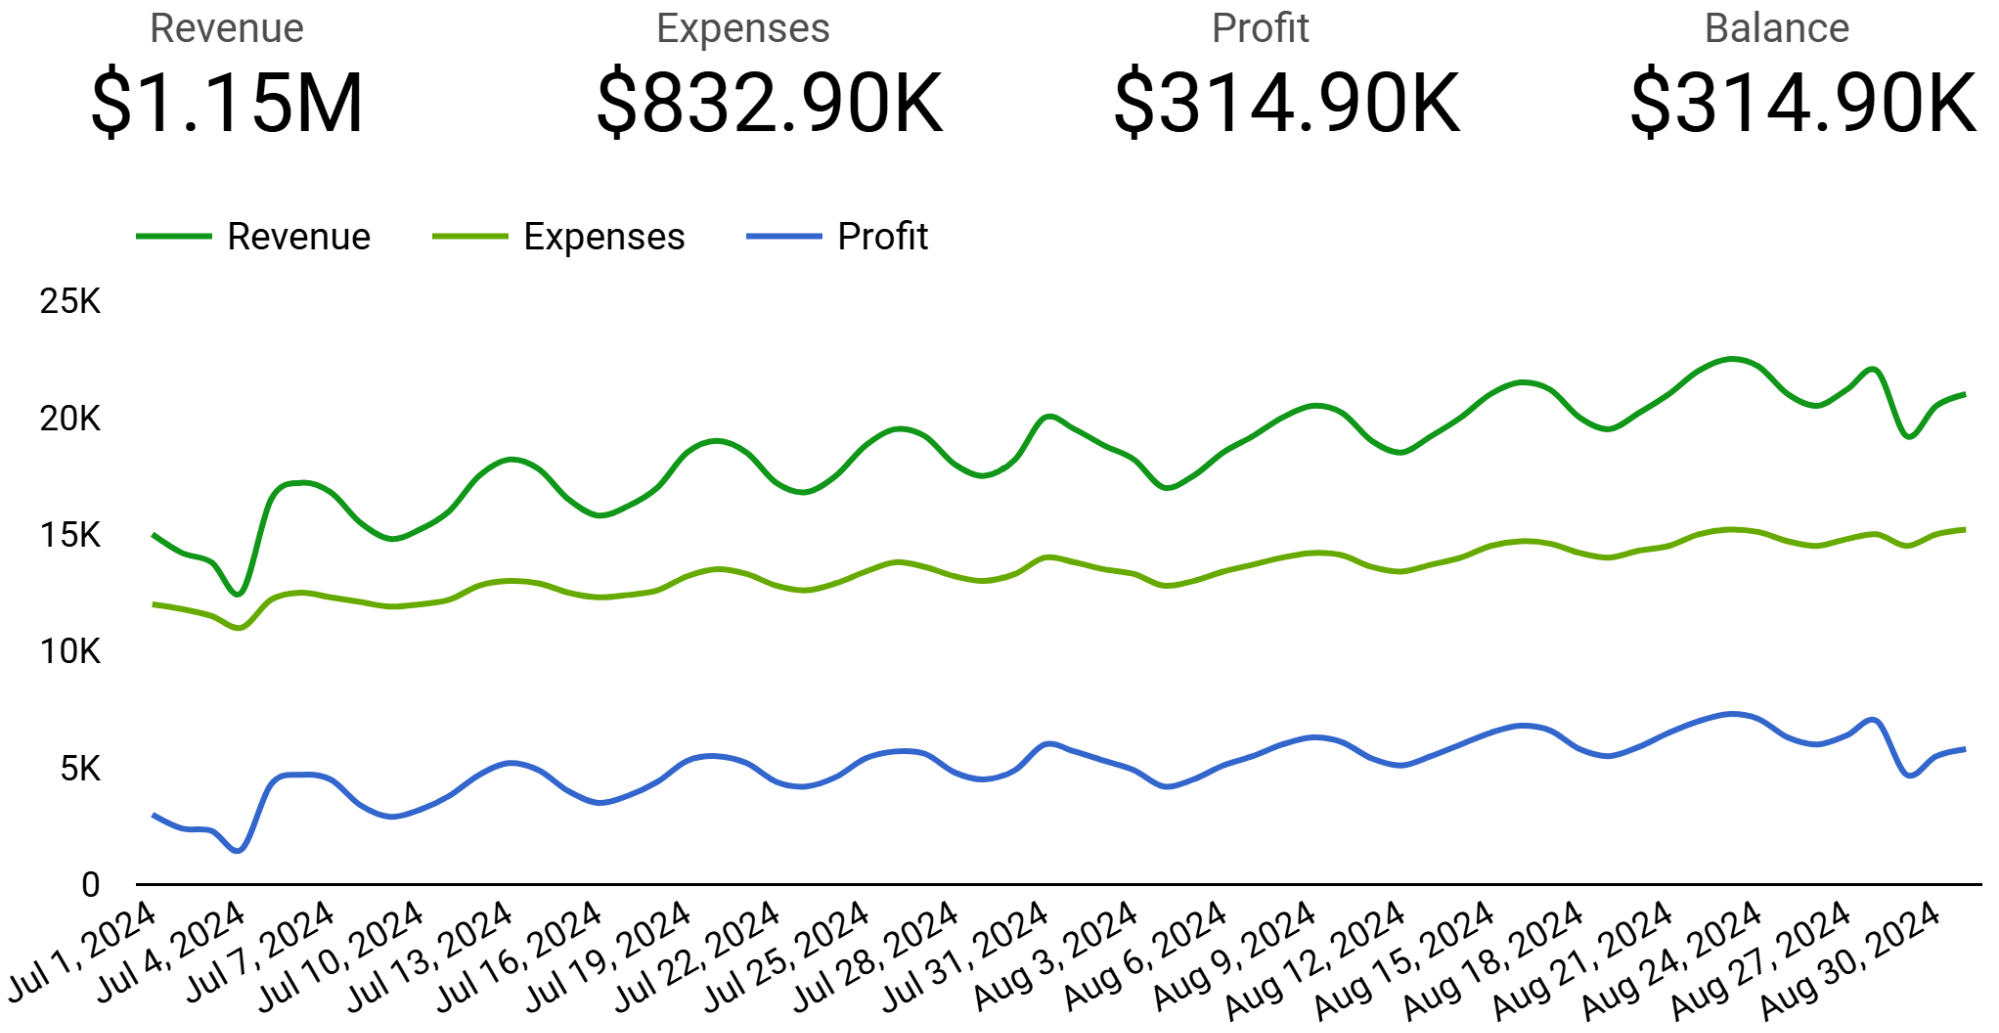
| Data Studio QuickBooks Insights | Data Studio | QuickBooks | Profit and expenses on one page | revenue, expenses, profit, balance, expenses by category, revenue and expenses over time, revenue by customer |
| Data Studio Google Business Profile | Data Studio | Google Business Profile | Calls, messages, bookings and directions by location | calls, messages, bookings, direction requests, website clicks, by location |
| Google Sheets Google Business Profile | Google Sheets | Google Business Profile | A shareable spreadsheet with reviews and ratings | search views, map views, website clicks, direction requests, phone calls, review count, average rating, post impressions and clicks |
| Painel Para Negócios Locais | Data Studio | Meta Ads, Google Ads | Local businesses, in Portuguese | impressions, reach, CTR, CPC, cost per lead, engagements |
Small business dashboard example: which channels bring active users
This example uses Windsor.ai’s own GA4 property for Q3 2026 (1 July to 30 September). It shows where customers come from, for two steps: signing up and adding a first data source, Windsor.ai’s equivalent of a first order or booking.
Step 1: Connect GA4. Sign in at onboard.windsor.ai, choose the GA4 connector, and authorize your property.
Step 2: Pull the channel fields. In the data preview, set the date range to the quarter and select the fields in the table.
| Source | Windsor.ai fields | Used for |
|---|---|---|
| GA4 | session_default_channel_group, sessions, engaged_sessions, event_name, conversions | Shares of sessions and key events by channel, and engagement rate |
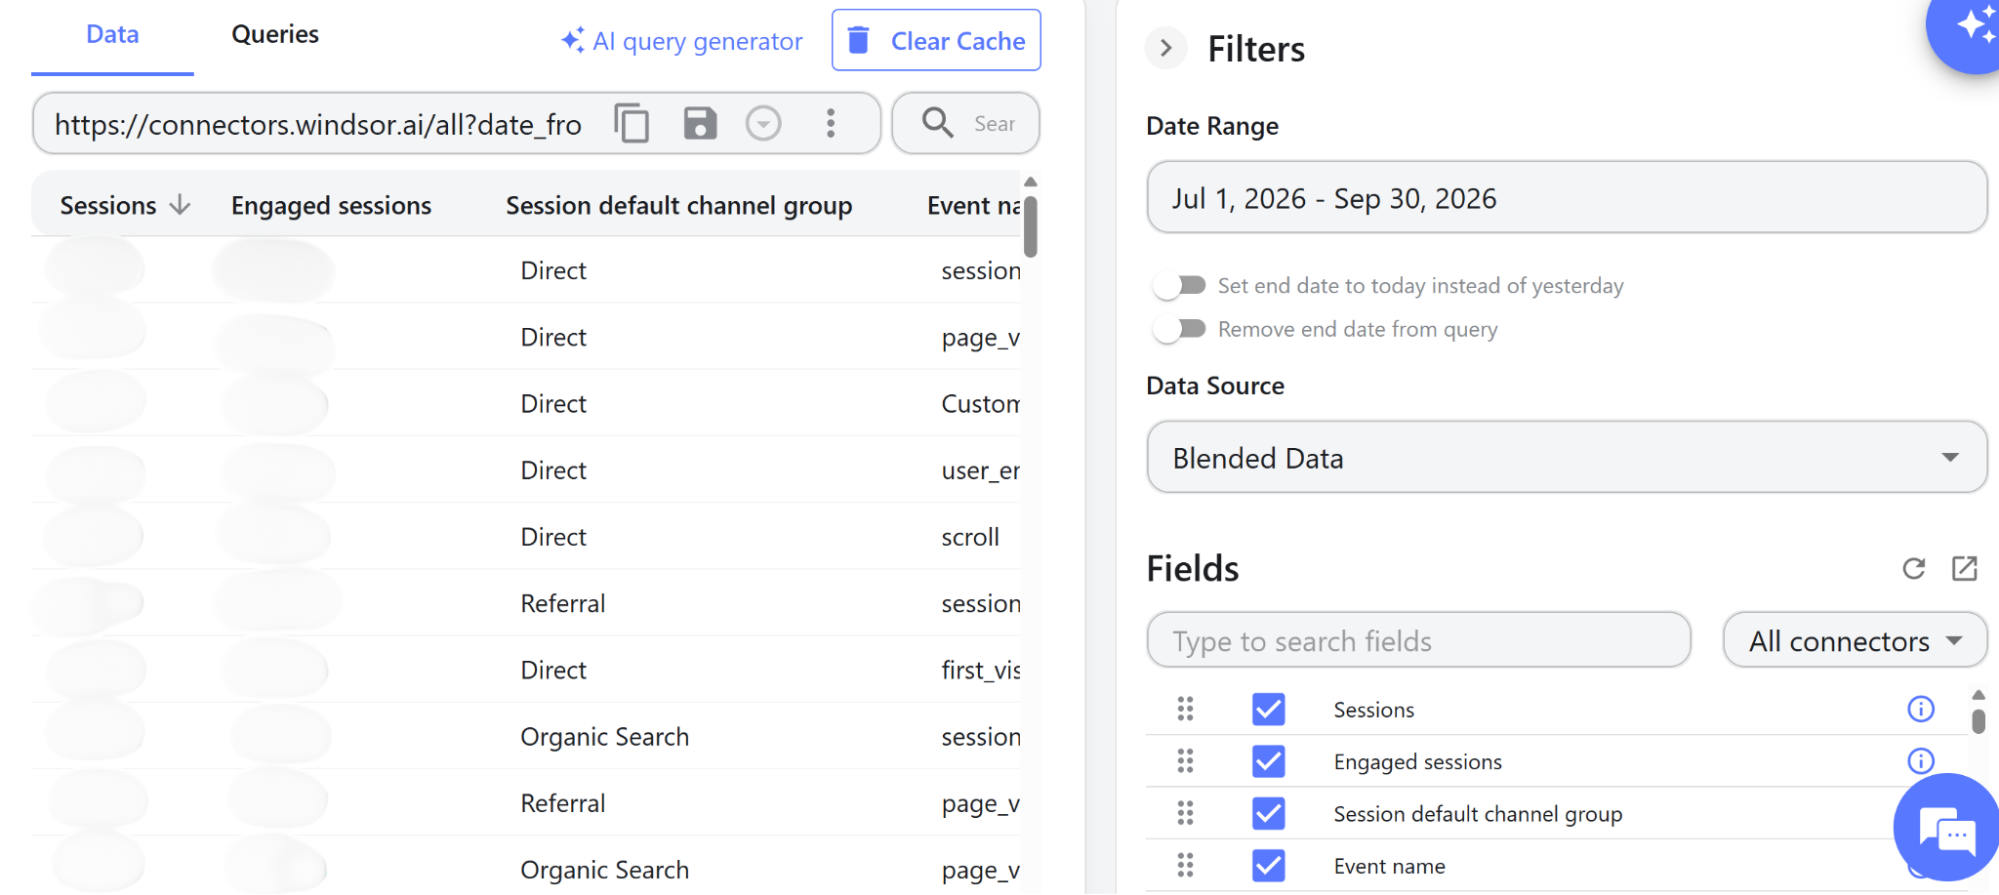
Step 3: Compare the shares. Divide each channel’s sessions and key events by the totals. In Windsor.ai, the conversions field holds GA4’s key events. Engagement rate is engaged sessions divided by sessions.
| Channel | Share of sessions | Engagement rate | Share of sign-ups | Share of first data sources added |
|---|---|---|---|---|
| Direct | 37.0% | 67.4% | 12.4% | 50.3% |
| Referral | 23.2% | 55.5% | 12.2% | 16.2% |
| Organic Search | 21.0% | 61.6% | 4.8% | 10.6% |
| AI Assistant | 8.6% | 68.3% | 3.5% | 15.8% |
| Paid Search | 2.7% | 59.7% | 0.6% | 1.5% |
| Unassigned | 6.5% | 4.7% | 66.4% | 5.3% |
| Other channels | 1.0% | 54.1% | 0.2% | 0.3% |
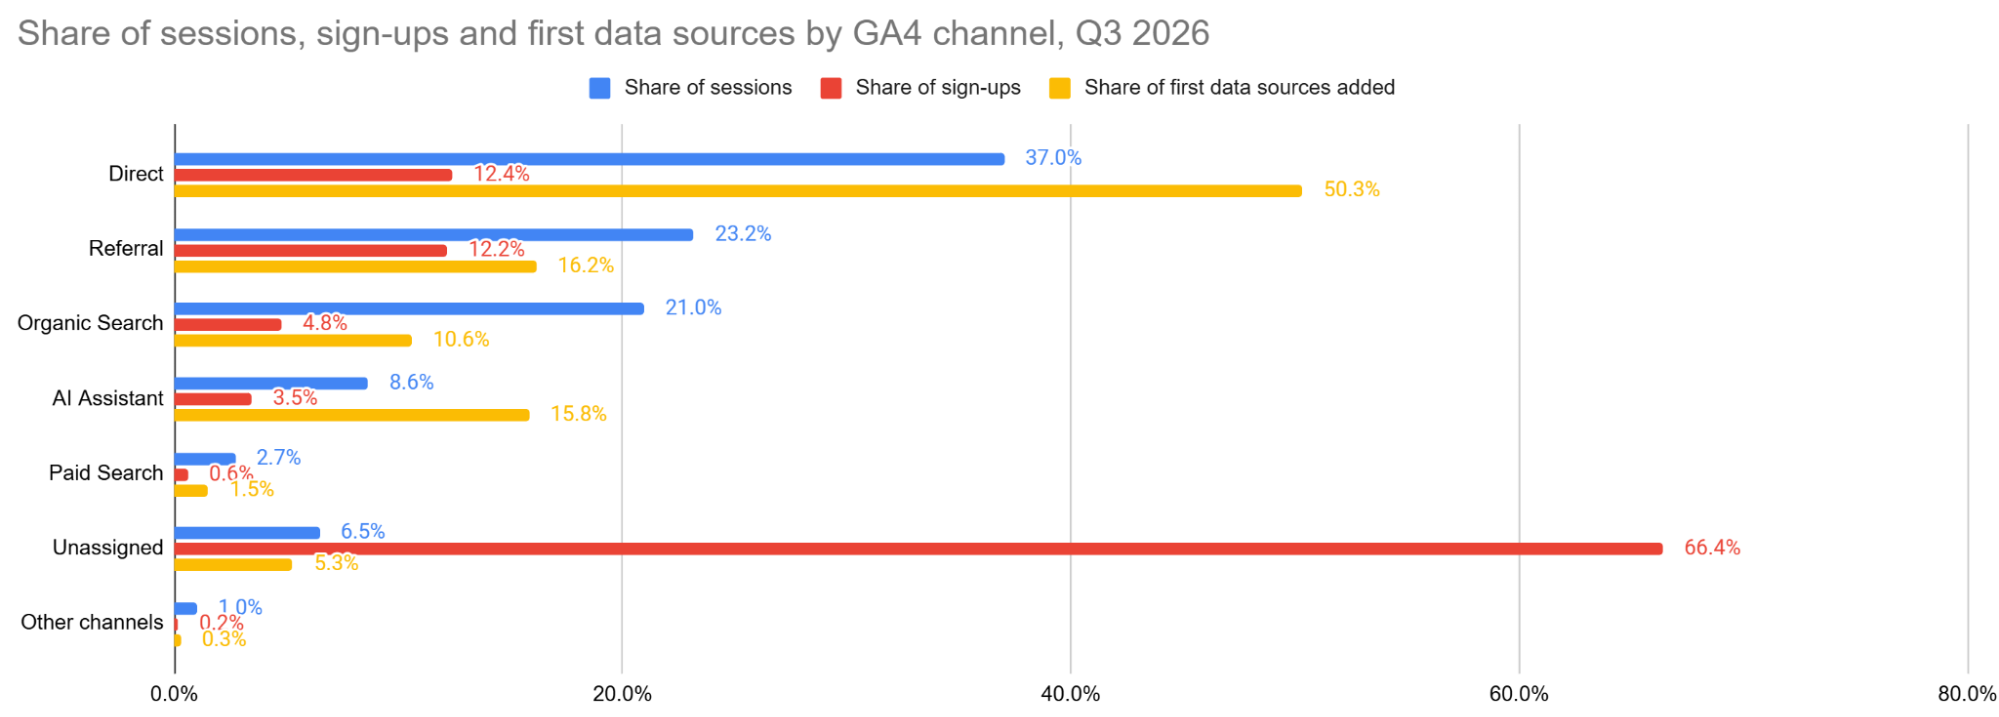
GA4 couldn’t assign a channel to 66.4% of sign-ups, so it grouped them under Unassigned. All of these sign-ups were recorded on onboard.windsor.ai, the sign-up subdomain. Unassigned sessions had a 4.7% engagement rate, much lower than any other channel. A separate sign-up or checkout domain can disrupt attribution, as can events sent directly from a server, so both are worth checking.
The first data source is a clearer indicator of which channels bring users who take action: Only 5.3% are classified as Unassigned. Direct drove 50.3% of first data sources from 37.0% of sessions, making it a stronger source of active users than its session share suggests. AI Assistant showed a similar pattern, accounting for 15.8% of first data sources from 8.6% of sessions. Organic search showed the opposite pattern, contributing 10.6% of first data sources from 21.0% of sessions.
Before comparing channels in your dashboard, check how many of each key event GA4 classifies as Unassigned. If you run an online store, use the WooCommerce template’s Orders Via chart to break down orders by channel and cross-check the results against GA4.
What KPIs does a small business dashboard track?
Choose the KPIs that match how you sell. Windsor.ai pulls the fields for each one from your store, payment, accounting, or Business Profile account.
- Revenue: the total of all sales in the period, from your store, your card reader, or QuickBooks.
- Profit margin: profit divided by revenue.
- Average order value: revenue divided by the number of orders.
- Conversion rate: orders divided by sessions in GA4, or by product views on BigCommerce.
- Returning customer share: revenue from returning customers divided by all revenue.
- Refund rate: refunds divided by total sales.
- Transaction decline rate: declined card transactions divided by all attempted transactions.
- Profile action rate: calls, direction requests, and website clicks divided by Business Profile views.
What to include in a small business report
Find out what sold, what it cost, and which channels brought in customers. Compare the results with last month to spot changes.
Split the data by six fields:
- product or category
- sales channel (online store, card reader, marketplace)
- traffic channel, from GA4 or WooCommerce order records
- customer type (new or returning)
- expense category
- location, for businesses with more than one shop or office
A shop owner’s monthly report brings key business metrics together in one place. Start with revenue, profit margin, and average order value compared with last month. Follow with sales by product and channel. Finish with QuickBooks expenses by category and Google Business Profile data on calls and direction requests for each location.
Browse the full template gallery for dashboards by platform and destination, or see the WooCommerce templates for more store reports. How to use Windsor.ai for e-commerce shows how to ask an AI assistant which products and channels bring sales.
FAQs
Is there a financial dashboard for small businesses?
Yes. The QuickBooks Insights template shows revenue, expenses, profit and balance, with expenses by category and revenue by customer. Windsor.ai reads your QuickBooks data and never changes it: the dashboard can’t create invoices or recategorize transactions.
Can I connect two QuickBooks companies or several stores?
Yes. Connect each company or store to Windsor.ai and select it in the template’s data source. Each one counts as an account, so the free forever plan, with one account, covers one company. Two or more need a paid plan after the first 30 days.
How are Google Business Profile locations counted?
Google Business Profile counts as one data source, and every 10 locations count as one account. A business with 13 locations uses two accounts. The Data Studio Google Business Profile template has a Locations page that splits calls, directions, and website clicks by location.
Can I use these templates in Excel or Google Sheets?
Yes. The Google Business Profile template also comes as a Google Sheets version, and the other templates run in Data Studio. Windsor.ai also sends WooCommerce, QuickBooks, and the other sources to Google Sheets and Excel, and the Excel dashboard templates gallery has ready-made workbooks.
Can I reply to Google reviews from the dashboard?
No. The templates read and display data only. To act on what the dashboard shows, connect Windsor.ai to Claude or ChatGPT. From a chat, you can then reply to reviews, publish local posts, and edit your listing on Google Business Profile. The AI assistant asks you to confirm each change before it runs. See how to manage your Google Business Profile with an AI assistant.
Tired of juggling fragmented data? Get started with Windsor.ai today to create a single source of truth


