 AI insights
 About us
 Careers
 Security
 Customer reviews
 Contact us
 Affiliate program
 Solution partners
 Looker Studio templates
 Tableau templates
 Facebook Ads templates
 Google Ads templates
 Data fields & Metrics
 AI prompt library & Guides
 Product documentation
 API documentation
 Case studies
 Blog
Blog Data models
 Windsor vs Supermetrics
 Windsor vs Fivetran
 Windsor vs Portermetrics
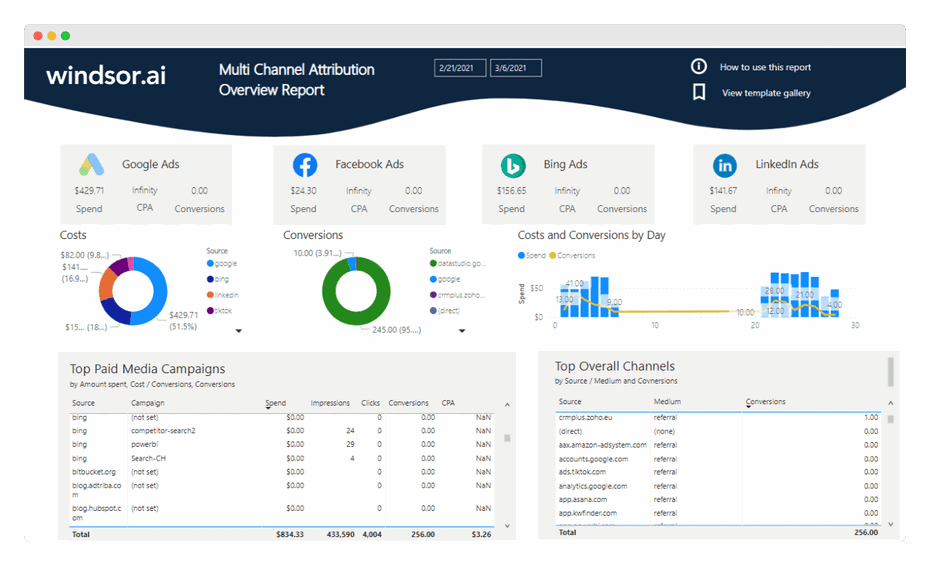
Our Power BI Multichannel Marketing Attribution Dashboard provides simple insights about paid and non-paid media performance. You can see top-level data from all your channels:
and understand their contribution to your marketing goals.
It includes reporting on all channels on a Channel Groupings level to make it easy to understand for everyone (especially for non-technical users)
1. Connecting your analytics and media data
- Connect your data here. In order to get the dashboard working, you will need to connect Google Analytics and at least one media platform (Google Ads, Facebook Ads, Bing Ads, LinkedIn Ads, …). Register or login if you already have an account.

- Select at least one Google Analytics account from the dropdown and remember to grant access.

- Then select tab “2. Select Destination” and copy your API Key.

- Connect your data here. In order to get the dashboard working, you will need to connect Google Analytics and at least one media platform (Google Ads, Facebook Ads, Bing Ads, LinkedIn Ads, …). Register or login if you already have an account.


The template is available both as
Choose your option:
2. Power BI Web Template
a. Install Power BI Web App: Power BI Attribution Dashboard
Click on Connect in the Connect your data section

Paste your API Key from Step 1. c like here, scroll down, and enter values for different sources. You can also choose the Date Range.

On the next screen click on Sign In

Your data should be loading now. Depending on your data size this may take a minute or two.
3. Connecting your data to the Power BI Desktop dashboard template
a. Download the latest version of the Power BI Attribution Dashboard
b. In the template on the start screen, paste your API Key from Step 1. c like here and enter values for different sources. You can also choose the Date Range.

Now you are ready to go with your attribution dashboard. In the default view we are connecting there are columns and dimensions which are not used (e.g. attributed revenues and last-click attribution model based conversions and revenues). To find out more about them and to visualize them, simply head to the Data section in Power BI and start exploring. If you have any questions or feedback, please share it with us through the chat.

Try Windsor.ai today
Access all your data from your favorite sources in one place.
Get started for free with a 30 - day trial.
You might also be interested in…
- Connect Facebook Ads to Power BI
- Connect Salesforce to Power BI
- Connect Snapchat Ads to Power BI
- Connect Bing Ads to Power BI
- Connect Zoho to Power BI
- Connect Linkedin Ads to Power BI
- Connect Klaviyo to Power BI
- Connect HubSpot to Power BI
- Connect Instagram to Power BI
- Power BI Data Sources: Different Types & How to Connect Them
- Free Multi-channel Marketing Dashboard Templates
- Connect Tik Tok Ads to Power BI
-
Guide to Power BI for Digital Marketing