 AI insights
 About us
 Careers
 Security
 Customer reviews
 Contact us
 Affiliate program
 Solution partners
 Looker Studio templates
 Tableau templates
 Facebook Ads templates
 Google Ads templates
 Data fields & Metrics
 AI prompt library & Guides
 Product documentation
 API documentation
 Case studies
 Blog
Blog Data models
 Windsor vs Supermetrics
 Windsor vs Fivetran
 Windsor vs Portermetrics
 Last updated: 21 May 2025

Synchronization Google Analytics 4 (GA4) with Power BI can provide several benefits that enable you to gain deeper insights, create more advanced visualizations, and make data-driven decisions.
In this article we will learn more about Power BI Google Analytics 4 integration.
Keep reading for more.
Table of content
- What are the available methods to connect GA4 with Power BI?
- Method 1: Connecting Google Analytics 4 to Power BI With Windsor.ai
- Method 2: Native Google Analytics Connector in Power BI
- Method 3: Setting up GA4 and PowerBI integration via BigQuery
- Benefits of connecting GA4 to Power BI
- Tips for troubleshooting common issues with the GA4 integration in Power BI
- Summary
What are the available methods to connect GA4 with Power BI?
There are three primary approaches to connect GA4 to Power BI in 2025:
1. Utilizing a Third-Party Connector
Opting for an external solution to integrate GA4 and Power BI offers a more versatile and reliable alternative to the native method. Typically, this connection comes with a range of advantageous features, including a data refresh schedule, support for various import modes, the capability to pull data from diverse sources, and more.
2. Using the Native Built-In Connector
This straightforward method facilitates the extraction of data from GA4 to Power BI with minimal complexity. Initially designed for Google Universal Analytics, the 2.0 (beta) version of this connector extends support to the new Google Analytics Data API, accommodating GA4.
With the impending shutdown of Google Analytics legacy Universal Analytics product in favour of GA4, vendors have been rolling out updated connectors to support native integration between their tools and GA4. It seems with the June release of Power BI Desktop, Microsoft have released an updated Google Analytics connector in Power Query which provides beta support for Google Analytics 4 connectivity.
3. Power BI – GA4 connection via BigQuery
Before establishing the connection to BigQuery, it is necessary to complete a series of prerequisite steps.
One of these steps includes the creation of a Big Query data table that will be used for the Power BI visualizations.
Method 1: Connecting GA 4 to Power BI With Windsor.ai
This method boasts speed and user-friendliness, allowing the connection of GA4 to Power BI in approximately 4 minutes without requiring coding or intricate setup.
Step 1:
Login or Register for a 30-day free trial with Windsor.ai
Step 2:
Grant access to your Google Analytics 4 Account, the use the Google Analytics account select to choose the account that you want to analyse.
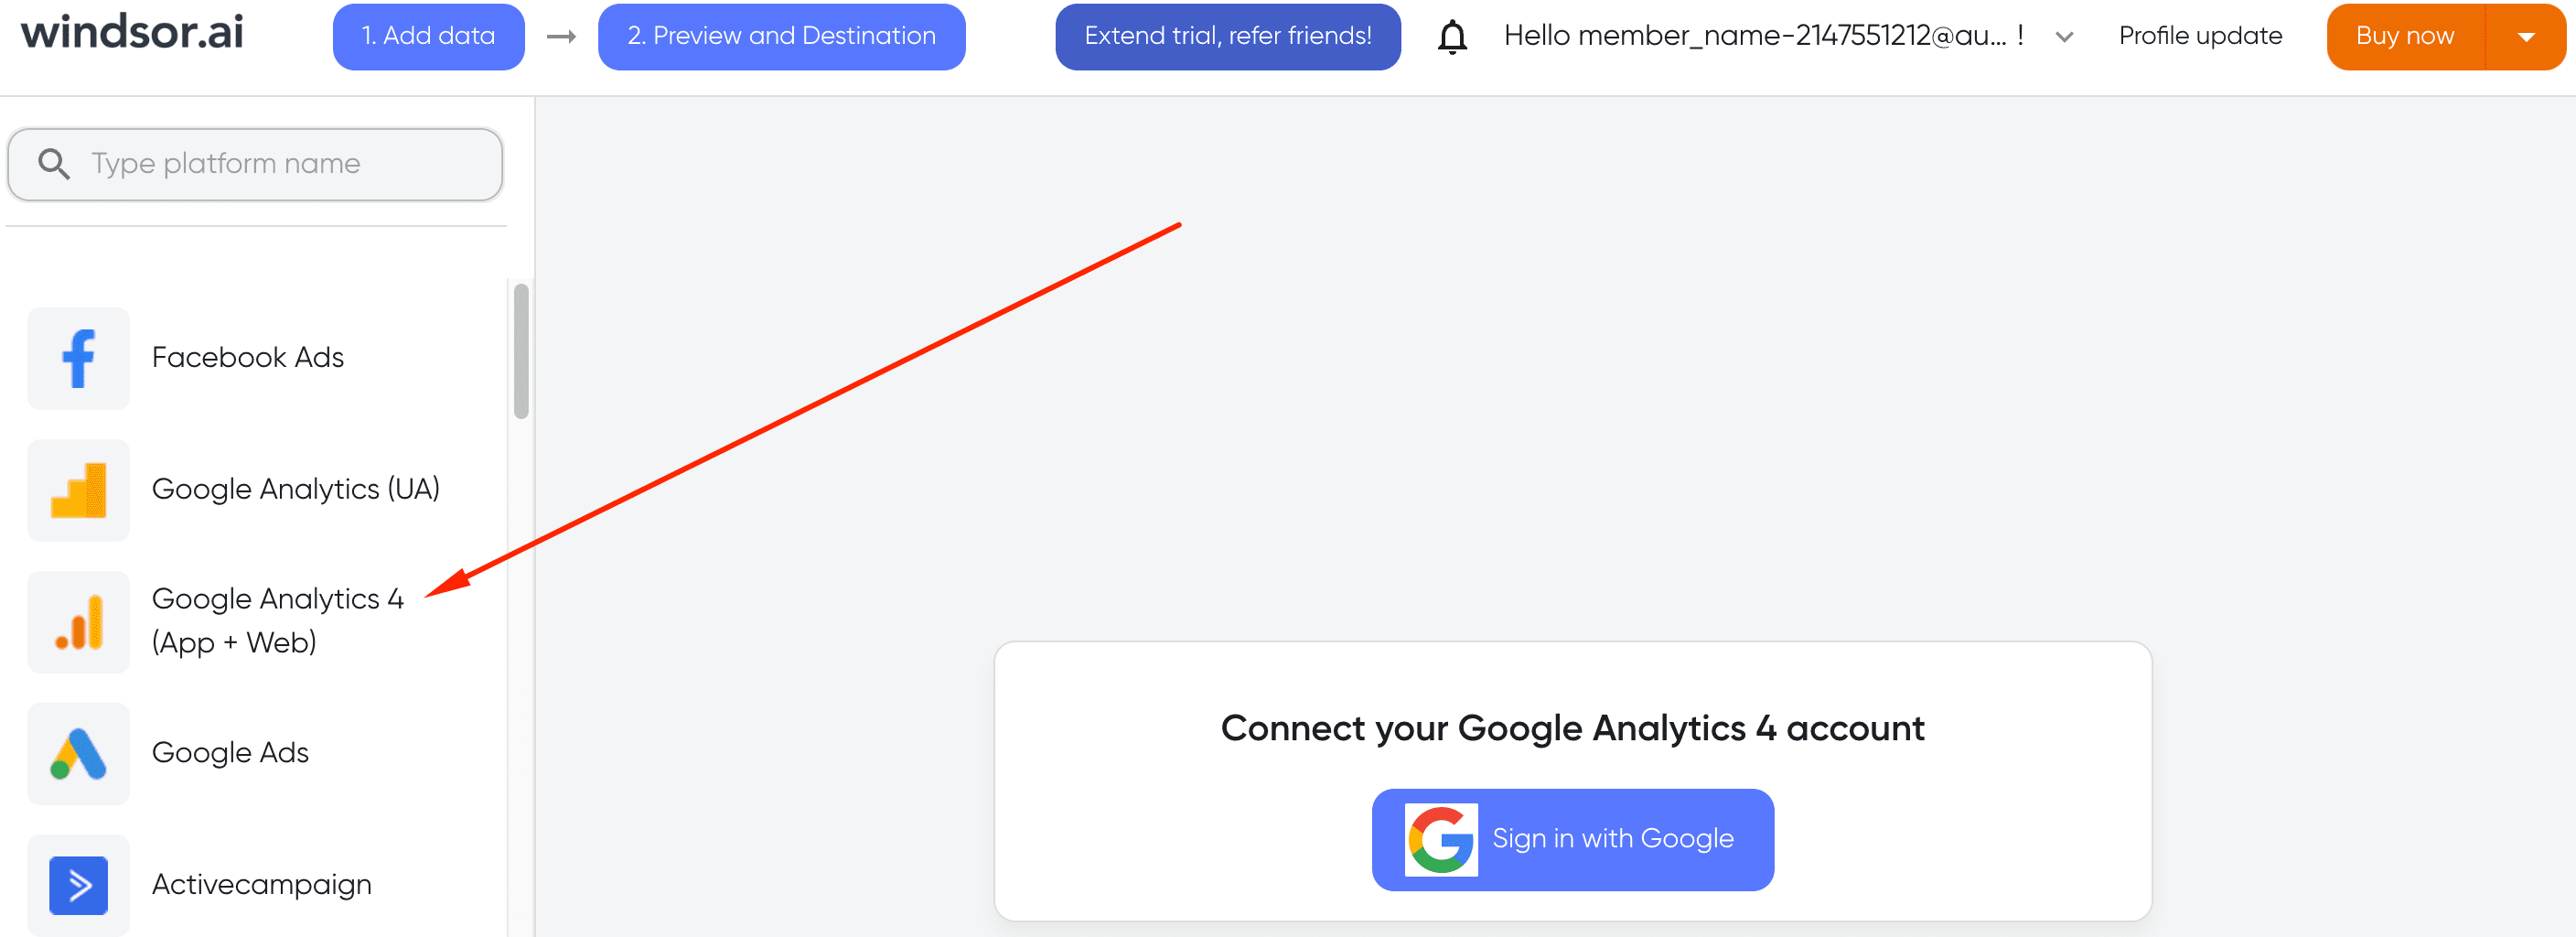
Step 3:
Go to Preview & Data destination, in the data source, select Google Analytics 4, Choose the Date range and then select the fields you need for your analysis.
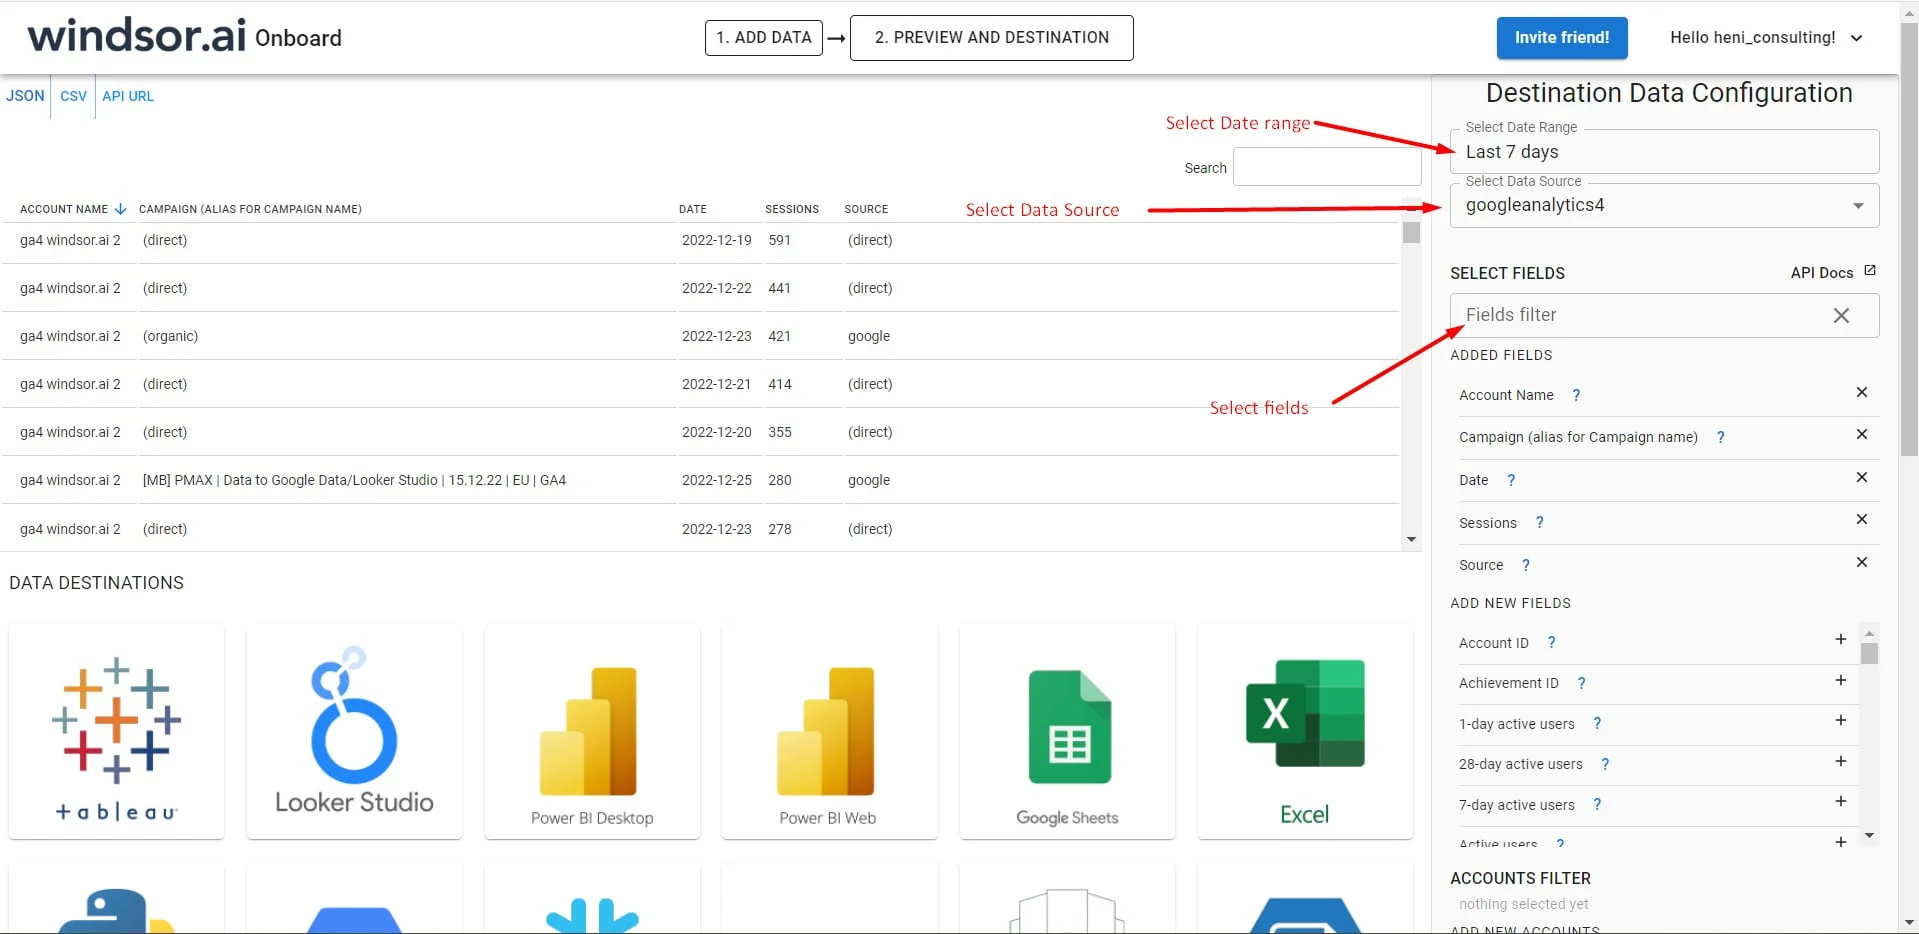
PS: Follow this link to check the full list of fields & dimensions.
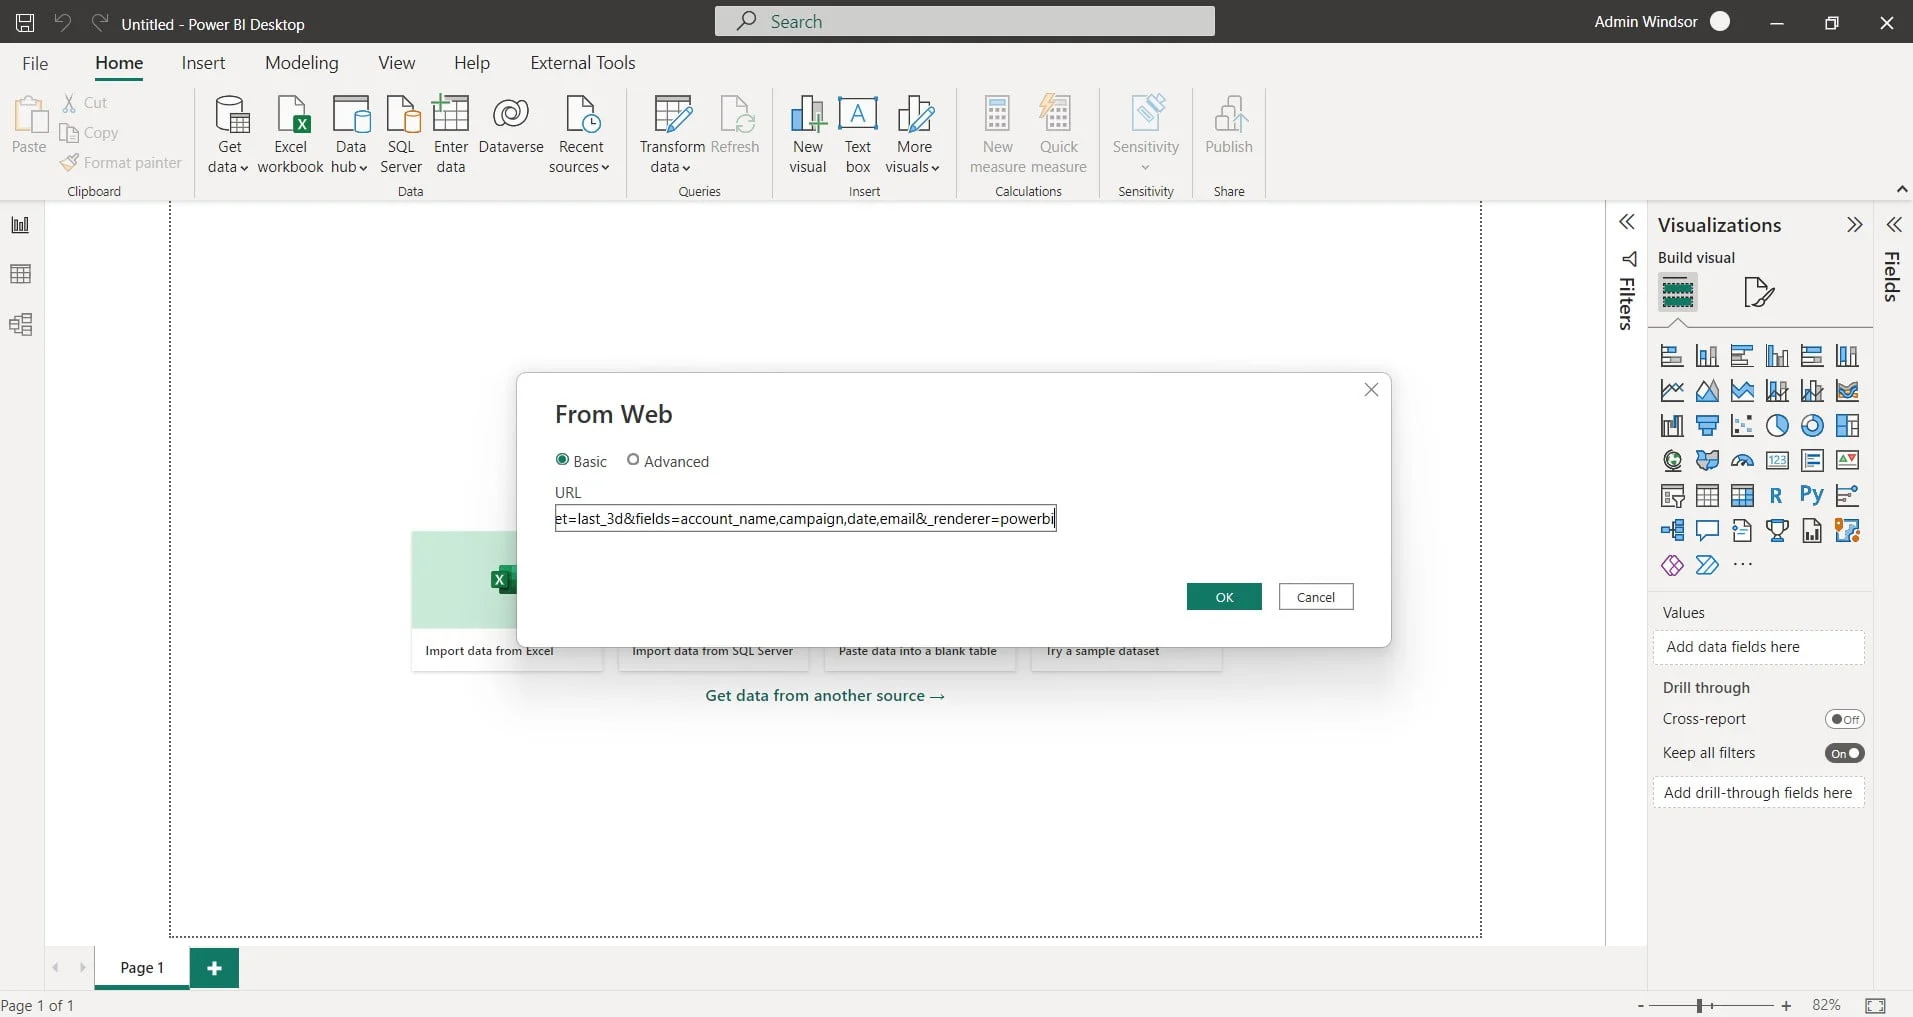
Step 4:
Click on Power BI under “Data Destination” and copy your API URL, then in Power BI click on Get Data -> From web and paste your API URL there, and click “ok”.
Check also:
Power BI GA4 Universal Analytics Design Dashboard Template
Power BI GA4 Dashboard Template

Try Windsor.ai today
Access all your data from your favorite sources in one place.
Get started for free with a 30 - day trial.
Method 2: Native Google Analytics Connector in Power BI
Power BI provides a native Google Analytics connector designed for GA Universal. With the release of GA4, a 2.0 (beta) version of the connector was introduced, supporting GA4. Here’s how to use it:
- Go to ‘Get Data’ => ‘More Options,’ and search for ‘Google Analytics’ in the search bar.
- Click ‘Connect’ and choose the implementation version: 1.0 for GA Universal and 2.0 (beta) for GA4.
- Sign in to your Google Analytics account, grant access to Power BI, and use the Navigator window to choose GA4 properties, metrics, and dimensions.
- Click ‘Transform Data’ for Power Query Editor or ‘Load’ to load your GA4 data to Power BI.
Limitations of the Native Google Analytics 4 Connector in Power BI
Despite its benefits, the beta version of the Google Analytics connector in Power BI has some drawbacks:
- Missing Date Parameters: The connector lacks start/end date parameters, defaulting to loading all records. Date range specification requires Advanced Query Editor usage.
- Data Refresh Challenges: Scheduling refresh in Power BI Desktop is unavailable, and in the Power BI service, the frequency is limited to daily and weekly. Publishing the dataset resolves this issue.
Method 3: Setting up GA4 and PowerBI integration via BigQuery
Step 1: Set up a Google APIs Console project and enable BigQuery
- To begin, log in to the Google APIs Console and either create a new project or select an existing one.
- Next, go to the APIs table and access it by opening the Navigation menu in the top-left corner, then clicking on “APIs & Services” and selecting “Library“.
- Look for the BigQuery API under the Google Cloud APIs section and click on it to activate it.
- Follow the prompt to review and agree to the Terms of Service.
Step 2: Connect a Google Analytics 4 Property to BigQuery
Once you have completed the initial steps, you can proceed to enable BigQuery Export within Analytics Admin.
- In Google Analytics, click on “Admin” to access the Admin section.
- Under the Property column, navigate to “PRODUCT LINKS” and click on “BigQuery Links“, then select “Link“.
- Choose a BigQuery project from the displayed list, ensuring you have at least read permission, then click “Confirm“.
- Determine the location for the data. Note that if your project already has a dataset for the Analytics property, this option cannot be configured. Proceed by clicking “Next“.
- Configure data streams and events by selecting the desired ones for export and excluding specific events if necessary. Events can be excluded by adding them from an existing list or specifying their names, even if they have not been collected yet. Once done, click “Done“.
- To include advertising identifiers for mobile app streams, select the appropriate option. Then, choose to export data either on a Daily (once a day) basis, Streaming (continuous) basis, or both. Click “Next“.
- Review your settings and make any necessary adjustments, then click “Submit“.
Here are the steps to connect BigQuery with Power BI: https://windsor.ai/power-bi-bigquery-connection/
Benefits of connecting GA4 to Microsoft Power BI
Here are some of the key benefits of connecting GA4 to Power BI:
1. Customized Data Analysis
Power BI allows you to perform advanced data transformations and create custom calculations on your GA4 data. You can tailor your data analysis to your specific business needs, uncovering insights that might not be readily available in standard GA4 reports.
Power BI’s data modeling and analysis features empower you to perform more complex analyses on your GA4 data. You can discover correlations, trends, and patterns that might not be apparent in standard reports, helping you make informed decisions.
2. Unified Data Visualization
By integrating GA4 data into Power BI, you can create unified dashboards that combine data from multiple sources. This enables you to see a comprehensive view of your business performance, including website traffic data from GA4 alongside other relevant data sources.
Power BI offers a wide range of visualization options that go beyond what GA4’s built-in reporting provides. You can create interactive charts, graphs, maps, and other visual elements to present your GA4 data in a more engaging and informative manner.
3. Cross-Platform Insights
With Power BI’s capabilities, you can integrate data from various sources beyond GA4, such as other marketing platforms, sales data, or CRM systems. This allows you to analyze how different parts of your business ecosystem interact and influence website traffic and user behavior.
4. Scheduled Refreshes
Power BI enables you to set up scheduled data refreshes, ensuring that your reports and dashboards are always up-to-date with the latest GA4 data. This automation saves time and ensures accuracy in your analysis.
Tips for troubleshooting common issues with the GA4 integration in Power BI
Here are some tips for troubleshooting common issues with the Google Analytics integration in Power BI:
- Check your Power BI and Google Analytics settings: Make sure that you have correctly set up the integration between Power BI and Google Analytics, and that you have the correct permissions to access your Google Analytics data in Power BI.
- Check your data sources connections: Make sure that your data sources connections are working correctly, and that you have the correct credentials to connect to your Google Analytics data.
- Check your data refresh settings: Make sure that your data refresh settings are correct, and that your data is being updated on a regular basis. You may need to adjust your data refresh schedule or manually refresh your data if it is not updating as expected.
- Check for errors in the data: If you are experiencing issues with your Google Analytics data in Power BI, check for errors in the data, such as missing values or incorrect data types. You may need to clean or transform your data to fix these issues.
- Check for issues with your data visualization:CIf you are experiencing issues with your data visualizations, such as incorrect data being displayed or visualizations not appearing as expected, check your visualization settings and ensure that you have the correct data fields selected.
- Check for issues with your data model: If you are experiencing issues with your data model, such as errors in your custom measures or calculations, check your data model and ensure that it is correctly set up and configured.
Troubleshooting with the Google Analytics integration in Power BI may require some trial and error and a bit of investigation, but following these tips can help you identify and resolve common issues. In case there is a need for some advanced tech assistance, there is always an option to hire offshore Power BI developer or in-house specialist.
With the impending shutdown of Google Analytics legacy Universal Analytics product in favour of GA4, vendors have been rolling out updated connectors to support native integration between their tools and GA4. It seems with the June release of Power BI Desktop (version 2.118.828.0), Microsoft have released an updated Google Analytics connector in Power Query (a component of Power BI) which provides beta support for GA4 connectivity.
Summary
Integrating Google Analytics 4 with Power BI allows you to analyze and visualize your website data in a powerful and flexible platform, and can provide a number of benefits, such as improved data analysis, enhanced data visualization, real-time data updates, improved collaboration and sharing, enhanced integration with other tools and services.
This integration empowers you to transform raw data into actionable insights, make informed decisions, and effectively communicate your findings to various stakeholders within your organization.
To connect Google Analytics 4 to Power BI you would need to use Power Bi Connector such as Windsor.ai’s Connectors.
- Login or Register for a trial with Windsor.ai
- Grant access to your Google Analytics 4 Account, the use the Google Analytics account select to choose the account that you want to analyse
- Go to Preview & Data destination, in the data source, select GA4, Choose the Date range and then select the fields you need for your analysis.
- Click on Power BI under “Data Destination” and copy your API URL, then in Power BI click on Get Data -> From web and paste your API URL there, and click “ok”.
Also, you must have it installed on your computer if it is the desktop version or have access to the Power BI Web App.
Try Windsor.ai today
Access all your data from your favorite sources in one place.
Get started for free with a 30 - day trial.
You May Be Also Interested in:
Popular Power BI Dashboard Templates in 2024

