 AI insights
 About us
 Careers
 Security
 Customer reviews
 Contact us
 Affiliate program
 Solution partners
 Looker Studio templates
 Tableau templates
 Facebook Ads templates
 Google Ads templates
 Data fields & Metrics
 AI prompt library & Guides
 Product documentation
 API documentation
 Case studies
 Blog
Blog Data models
 Windsor vs Supermetrics
 Windsor vs Fivetran
 Windsor vs Portermetrics
 Last updated: 21 May 2025

In 2023, having a website is a requirement for any business. Engaging your customer online ensures that your business is in sync with the customer’s needs and requirements.
You may have high-traffic pages but have no idea what to make off of without connecting marketing data to dynamic visualization tools.
Google Analytics (GA) can provide an extensive amount of data that can help running any business these days. But the website data retrieved might be raw and finding insights can be a challenge.
Power BI can help you with this and help you make various business decisions. Connecting GA to Power BI creates a powerful tool which is known as the Power BI Google Analytics Connector.
This article provides a step-by-step guide on how to connect Google Analytics to Microsoft Power BI. Before that, let us understand what Power BI and Google Analytics are all about.
Table of content
- Why do you need Power Bi?
- Steps for connecting Power BI with Google Analytics with Windsor.ai
- Google Analytics VS Power Bi
- Power BI Google Analytics Connector Limitations
Why do you need Power BI?
Power BI Is a Microsoft service. Microsoft offers a cloud service called Power BI Services and a desktop version known simply as Power BI Desktop. BI stands for business intelligence. This tool will allow you to make the most of the available data.
Power BI is a drag-and-drop tool that makes it easy to use. You just have to click on the field you like to look at closely and drop it onto the dashboard. And you will get the insights in no time. It can generate real-time visualizations, charts, and other reports.
Having a Power BI account means you can have both on-premise and on-cloud deployments. Microsoft offers three types of Power BI platforms:
- Power BI Desktop
- Power BI Service
- Power BI Mobile
In other words, if Google Analytics is the substance, Power BI organizes it and makes it more useful. It’ll be much simpler to analyze your data in Power BI rather than directly in Google Analytics. And here’s where Windsor.ai comes in.
In March 2022, Google announced that they are phasing out Universal Analytics (UA) slowly and will be retracted by June 2023.
This would mean that every current user of Universal Analytics should set up the latest Google Analytics 4 by then.
Steps for connecting Power BI with Google Analytics with Windsor.ai

There are two different ways to connect Google Analytics to Power BI with the help of Windsor.ai. The first is using the Power BI desktop and the second is through Power BI Web App.
Power BI Desktop Connection
Make sure that you connect your Google Analytics Data to your Windsor.ai account before beginning the journey to make this integration easier.
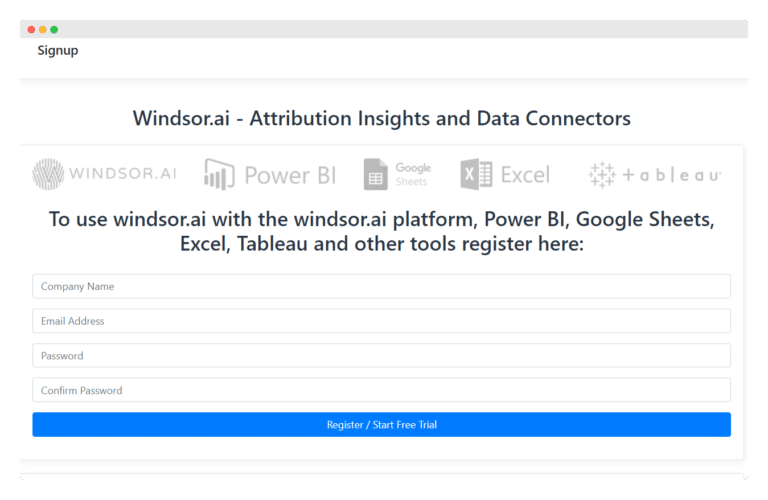
- Register or log in if you already have an account
- Select Google Analytics as a Data Source and Grant Access to Windsor.ai.
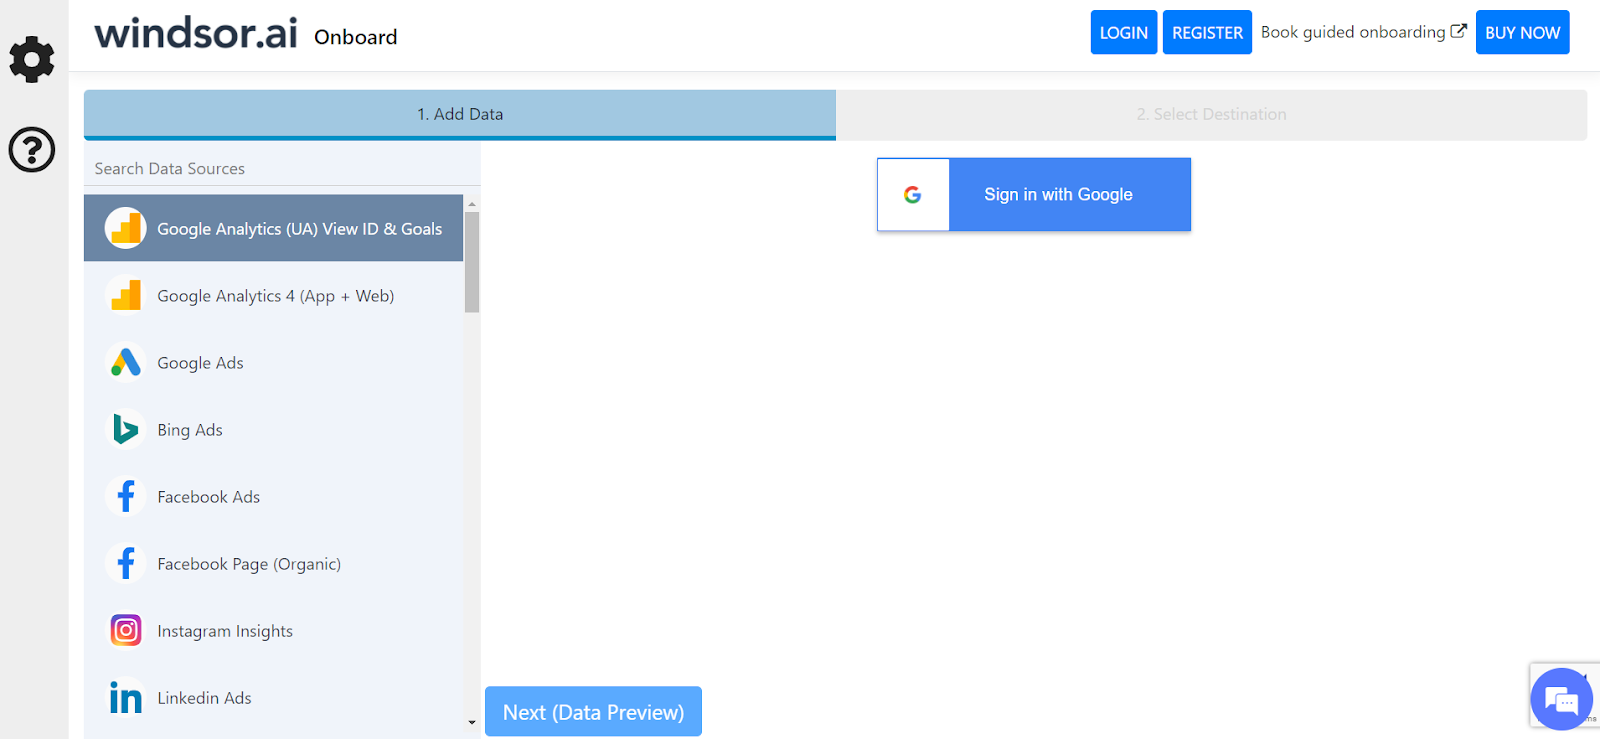
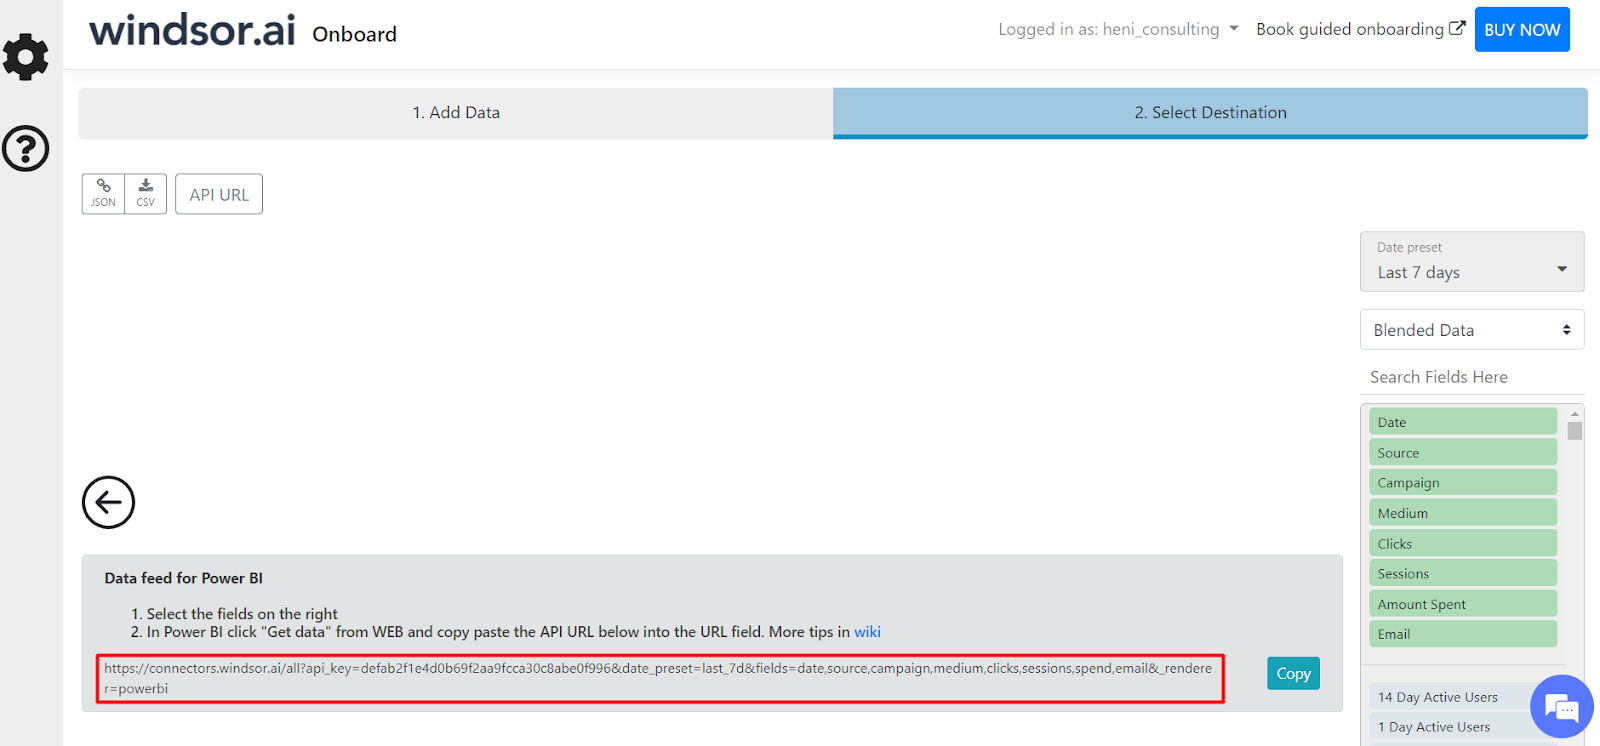
- Next, select your destination. You can also use the search or add fields as shown in the image below:

- Select the fields on the right. In the Power BI account, click on “Get data” and select “WEB”.
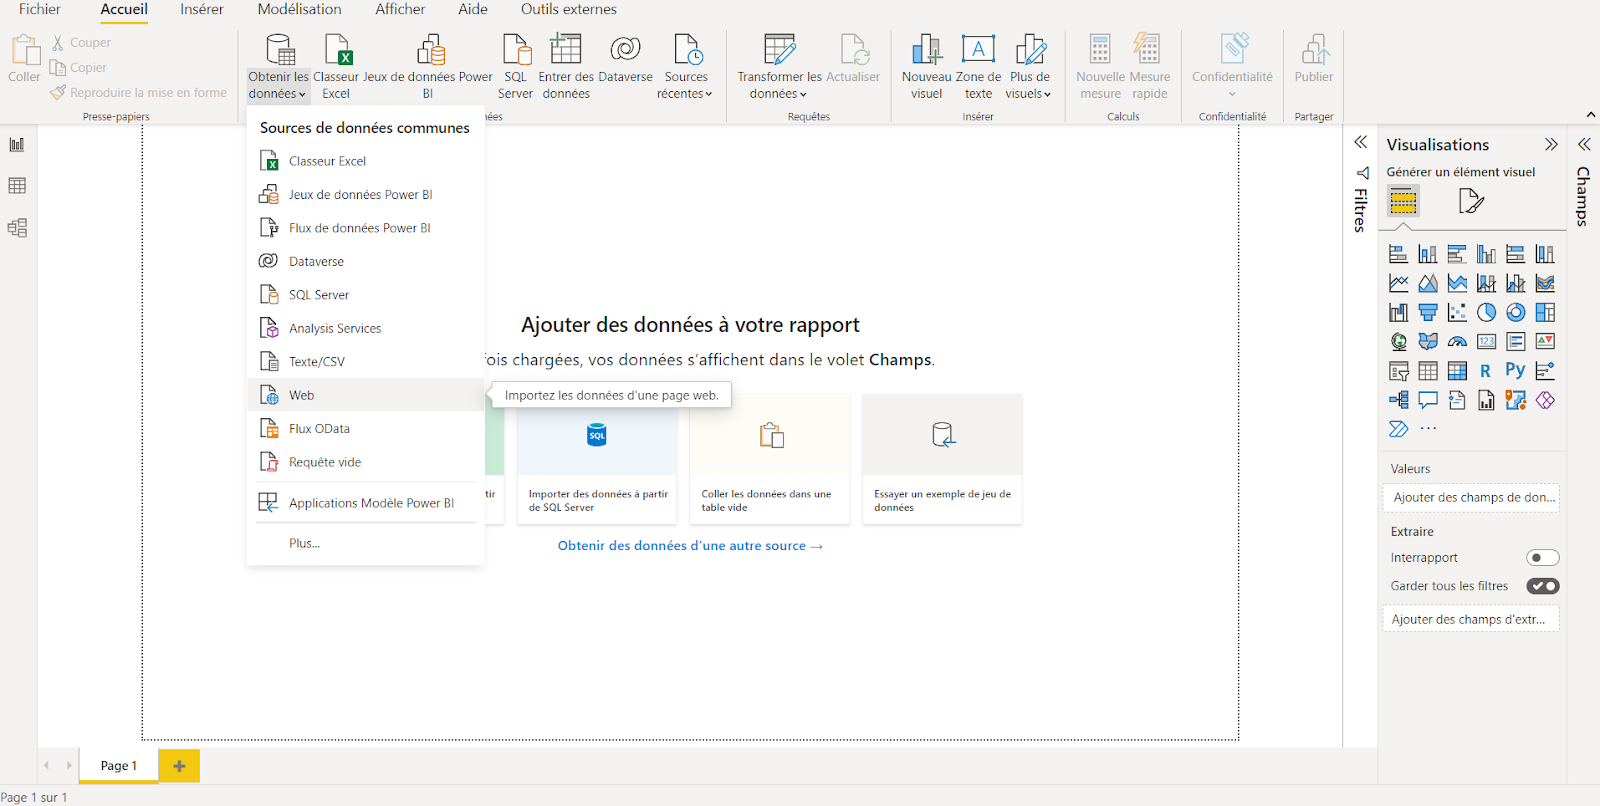
- Copy the URL at which the data is available in the box shown below.
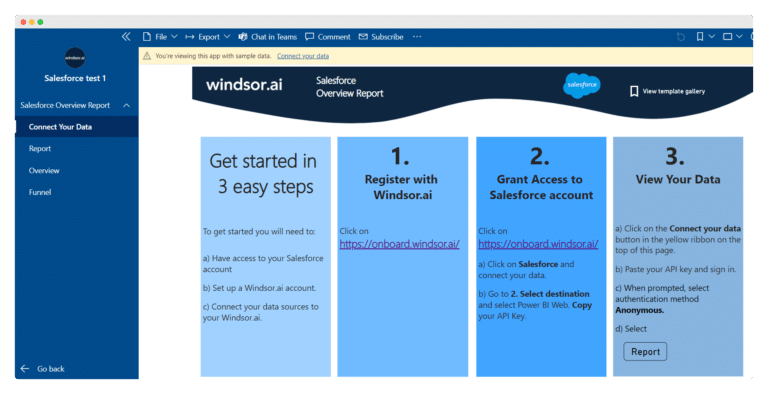
Power BI Web App Connection
If you want to use the Power BI Web App and have not installed it, use this link
- Click on Connect your data link on the yellow background at the top of the page.
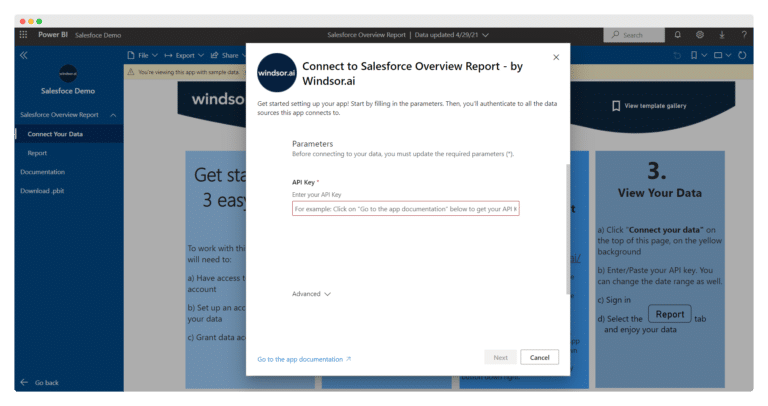
2.Enter your API Key. If you do not have one, create it now
- On the next screen click on Sign In
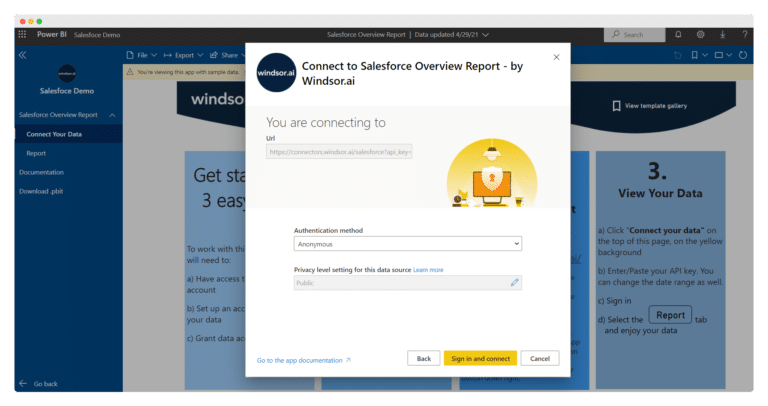
The data will start loading now and the time taken will differ according to the size of the data and may take up to a minute or two.

Try Windsor.ai today
Access all your data from your favorite sources in one place.
Get started for free with a 30 - day trial.
Google Analytics VS Power BI
According to Microsoft, when Power BI goes hand in hand with Google Analytics, the result is conducive and innovative which they call Power Analytics. What about these two platforms makes this integration special?
These days, most organizations use Google Analytics to see if their marketing goals are being met and what they could do to improve the ‘Visitor Footprints’ on their websites.
With the help of this connector, you can uncover hidden patterns and trends in the web performance data. You can identify high-traffic web pages and find multiple trends.
Google Analytics tracks customer website visitor behavior including the number of unique page visits, amount of time spent browsing, geographic location, etc.
How to select the date range?
Google Analytics provides different ways to select the data range. By default, it is set at 30 days worth of data. But in many cases, you may want to change it.
So, here are the different methods to select a date range:
- Click the currently selected date range at the top of ‘Variables’.
- Either, select a preset range, or select a custom range from the calendar.
You can stick with the default 30 days. Select an entire calendar month or select an entire week. You can also select a range of days by clicking the first and last date in the range you wish to see.
You can also use the timeline slider option to pick the date range.
- Click OK.
Google Analytics Power BI Access to the Resource is Forbidden
Re-entering Credentials to Reset the Data Connection
It has been pointed out by many users that the ‘Access to the resource forbidden error’ was fixed by resetting the data connections for the data sources. To do this:
- First, click the ‘File’ tab at the top left of Power BI.
- Next, choose ‘Options and Settings’ on the menu.
- Select the ‘Data Source Settings’ option.
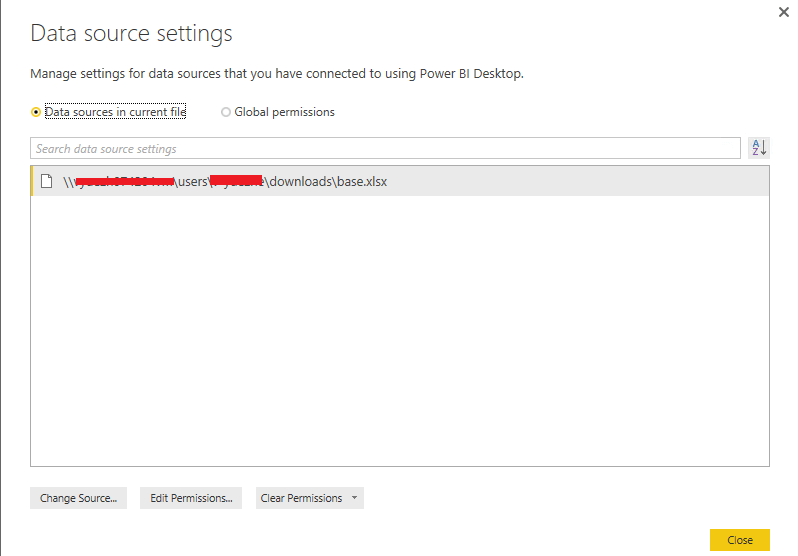
- Select the data source for which the ‘Access to the resource is forbidden’ error’ arises.
- From the drop-down menu, select the ‘Clear Permissions’ option.
- Click the ‘Close’ button.
- Now, the users are allowed to re-enter their credentials when trying to connect the required data source.
Alternative Login Option to Connect to Data
When trying to connect data sources, if a user mistakenly selects the wrong log-in options, the ‘Access to the resource is forbidden’ error may arise.
In the image shown below, a user is trying to connect SharePoint Online via Power BI Desktop. For this, they might need to select the Organizational account log-in option instead of Windows on the window. So, try another login option.

Power BI Google Analytics Connector’s sampling issue
A sampling of data could lead you to make misguided decisions. The calculations can go wrong if the sample size is too small.
Once sampled, the patterns that arise are not representative of the entire dataset. The sample may or may not reflect the true nature of the data.
Once sampling is done, there will be an ambiguity in place which is not something that we look for when expecting analytics to work and be accurate. Click here to read more about this and learn how Windsor.ai help you to overcome this issue.
Power BI Google Analytics Connector Limitations
Google Analytics Integration with Power BI is a really powerful one. But there are certain limitations to this connector. Let us now look into the Power BI Google Analytics limitations:
- Google Analytics quota limits for Power BI: There are certain limitations and quotas for Google Analytics AP requests, which can be read here. But, PBI Desktop and PBI service allow the following upgraded number of requests.
- Queries per day: 1,500,000
- Queries per 100 seconds: 4000
- Power BI Online does not support queries from Google Analytics API: You are allowed to only use the pre-built data sources to connect to data. Querying Google Analytics with the help of custom queries is not supported by Power BI services.
- Google Analytics has a limit of 10,000 rows per API query. If it exceeds 10,000 queries, Power BI does not create extra queries to extract the rest of the rows.
- Impossible to sort and filter for Analytics API queries: The Google API allows you to specify filters, segments, and sort orders. This will modify the result of your Google Analytics Query even before the data reaches the Google Analytics PowerBI connector. This is not supported by the PowerBI service.
Try Windsor.ai today
Access all your data from your favorite sources in one place.
Get started for free with a 30 - day trial.
How Windsor.ai can help you create better reports
Using a platform like Windsor.ai can help connect PBI and UA in such a way that it lets you control every aspect of GA. All your website data can be visualized on Power BI with a few clicks.
You can merge any type of data source to have a Power BI Google Analytics dashboard containing the visualizations of your entire data. Windsor.ai helps you publish the data from your website traffic and develop suitable strategies for your business.
Once you sign in to Windsor.ai, using the easy steps that have been mentioned in this article, you will be able to create beautiful interactive dashboards of your GA data in the Power BI desktop or web app, without any hassle of integrating it yourself.
Windsor.ai makes it easier by providing a variety of templates and helps you create a report in a few simple clicks.
Windsor.ai offers a 30-day free trial. So you can get to see how convenient it is to connect Google Analytics and Power BI using our platform.
You Might also Like to read:
Integrate Google Analytics & your CRM system
GA4 Dashboard Report Templates

