Google Analytics Data Sampling: Everything You Need to Know
You can use Google Analytics to find and understand your target audience and web pages. In Google Analytics, data sampling has become quite popular and it has had direct impacts on a lot of data. Data sampling in Google Analytics involves comparing a single dataset with other data sets. Google Analyzes a portion of your site data to help you quickly generate an actionable report based upon conversions. How can Google Analytics be used in the future? Continue to read!
Advanced Google Analytics users will have experienced sampling before. Especially when it comes to working with custom dimensions.
What is data sampling?
Let’s say in your company you have 250 employees and you want to know how many below the age of 30. Instead of spending hours counting them one by one, you can randomly take some out of the bag and check how many of them fall under your criteria . Based on that sample, you can easily estimate the number of people aged 30 or less.
That’s a rough description of sampling.
In statistical analysis, data sampling means taking a small slice of the whole dataset and analyzing it for trends or for verifying hypotheses.
Since Google Analytics is the first used web analytics tool around the world, it has to process and handle huge volumes of data relatively quickly. For the purpose of speed and accuracy, Google randomly samples a portion of your traffic data.
What is data sampling,
The biggest advantages of sampling are, of course, time-saving and cost-saving. Google can deal with a much smaller and manageable sample yet still produce similar results.
But if you’ll be getting the same result, why waste the time with tangled and huge unsampled data instead of sampled?
Here is why?
Why sampling can misguide decisions making from your data?
Remember the personnel example?
In some cases, your calculations can go wrong: The sample size is too small.
For example, if you only count 5 of 250 people. The younger employees are unevenly distributed.
For example, you accidentally included more younger employees in the sample because they clustered together. In both cases, the pattern does not represent the entire picture. That’s the problem with sampling – it creates uncertainty and mistrust in your reports. While smaller datasets are easier to work with, it doesn’t give you statistical significance. Your sample may or may not reflect the true nature of the data.
Suppose you run two campaigns – A and B. Campaign A has a conversion rate of 10.5%; Campaign B has a conversion rate of 8.3%. The results seem clear, with Activity A the clear winner.
In reality, however, the sample you analyzed may not be representative of the entire population, and there is no discernible difference between the two activities.
This ambiguity is the opposite of how we expect analytics to work. The only reason we decided to use Google Analytics in the first place was to get accurate numbers about our traffic and users.
In the following we will guide you through multiple ways on how to avoid Google analytics data sampling. Continue reading!
What are the ways to avoid Google Analytics Sampling In Looker Studios?
Sampling is one of the biggest obstructions that most data analysts and marketers have to deal with. Google Analytics, although a great tool for marketers, unreliable data is something that all marketers should avoid at any cost.
In this post, we will discuss how sampling affects your data. Besides, you will also see how Windsor.ai can ease your sampling pain in the Looker Studio.
Sampling with Google Analytics
Defining samples in data investigation is simply the practice of analyzing a subset of available data to highlight the most meaningful information present in the projected data set. Google Analytics can apply session sampling to your data and provides you with accurate reports on time. Especially; when you are attracting a large number of visitors each month.
Default reports
There are few default reports catalogs in the left pane under behavior, audience, acquisition, and conversions. Sampling doesn’t affect these reports.
Custom reports
When you start modifying your default reports or build custom ones, sampling might affect your data. Hence; you should be more careful when you are
- Applying table filters
- Generating custom reports
- Applying custom segments
- Smearing secondary dimensions
In the mentioned cases above, sampling might affect your data set.
Sampling Thresholds
A free version of google analytics is used by most people. Below given are the sampling thresholds of analytics 360 and analytics standard:
Analytics 360: 100M sessions view level for the specified date range.
Analytics standard (free): 500k sessions at the property level for the selected date range.
In general, the segmented data for at least four weeks can be segmented; without dealing with sampling.
Native data connector for Google Analytics
A beautiful data visualization can be built in a Looker Studio. The native data connector for Google Analytics works impeccably; when there is no need to worry about sampling. However, when you compare the Google Analytics reporting environment with API, the same data sampling challenges apply to Looker Studio. In brief, analyzing google analytics data in a data studio is not an answer to your sampling challenges.
Sampling effects
For a better understanding of how sampling affects your data, you may set up a test to compare sampled vs unsampled data. A small sample and low values on specific metrics may lead to bigger inaccuracies in your data.
It Is recommended to use Windsor.ai to find out how the different data sets are affected by sampling.
Case study: e-commerce site
Ecommerce, lead generation, and also services websites have to deal with sampling. Some companies often suffer selecting multiple years of data. But it won’t be a great threat as others can analyze data sets for seven days or even less. It is a bigger issue when we want to achieve trend analysis for a longer period.
Now, I will discuss a short story on how I used Windsor.ai to deal with sampling for one of my big clients. The configuration was done even before the new connector was introduced, which we will explain later.
Background
E-commerce companies function internationally and have millions of visitors. Although it was a popular and profit-making online sale platform, it didn’t want to convert to the GA 360 package. The company wanted to create a data studio dashboard for an easy track of the e-commerce performance. Overall, it is not difficult to get unsegmented data in the data studio. All that’s needed is just connecting the native Google Analytics connector to receive all the metrics and dimensions required.
Besides, they also desired to get an in-depth view of the goings-on of their e-commerce business. It is the point where we get into sampling challenges. A few segments are like
- Visitors who show specific interest in buying a product
- Visitors who are showing specific interest in repairing a product
- Visitors who are navigating to the store locator page (it is a sign that they are more interested in offline buying)
As you may have already guessed, these reporting needs and sections have led to data sampling challenges. Hence, we decided to extract a basic set of metrics daily on the channel level.
Solution
We together discussed the different options to tackle the sampling challenges of the company. Also, I leveraged various functionalities of Windsor.ai as well as Google Sheets to solve the challenge.
Try Windsor.ai – 30 days free trial
Google explains sampling in the following way
In data analysis, sampling is the practice of analyzing a subset of all data in order to uncover the meaningful information in the larger data set. For example, if you wanted to estimate the number of trees in a 100-acre area where the distribution of trees was fairly uniform, you could count the number of trees in 1 acre and multiply by 100, or count the trees in a half acre and multiply by 200 to get an accurate representation of the entire 100 acres.
In terms of thresholds for sampling as of July 2021, Google states the following
Google Analytics Standard: 500k sessions at the property level for the date range you are using
In some circumstances, you may see fewer than 500k sessions sampled. This can result from the complexity of your Analytics implementation, the use of view filters, query complexity for segmentation, or some combination of those factors. Although we make a best effort to sample up to 500k sessions, it’s normal to sometimes see slightly fewer than 500k sessions returned for an ad-hoc query.
Google Analytics 360: 100M sessions at the view level for the date range you are using
360 thresholds vary according to how queries are configured. For detailed information, contact your 360 support team.
Now let’s have a look at what issues it causes and why relying on sampled data is such a problem when doing data analysis.
How to identify it and why is it a problem
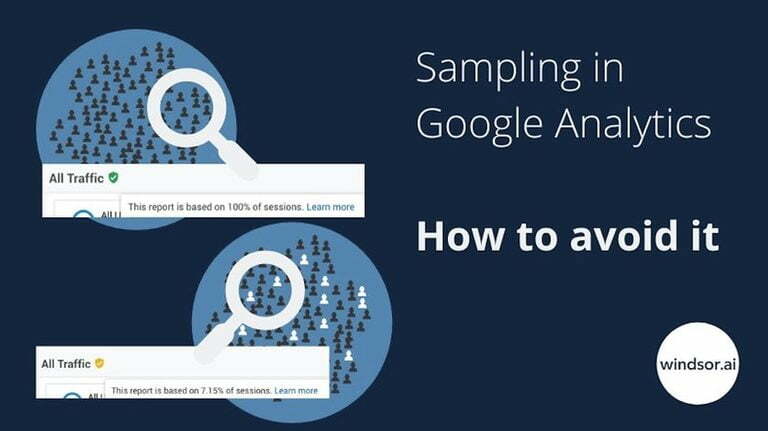
When looking at reports in Google Analytics you will usually see a green tick mark in the report similar. This means no sampling is applied.

In case the tick mark appears in yellow, it means that you are looking at a sampled report.

Now why exactly is this a problem?
7.15% of the data (as shown in the screenshot above) will in no way tell you the true story of what is happening and will almost certainly be too small for even looking at trends.
If you are looking at a sample rate of 50%> it may help you to analyze demographics of your audience or similar high-level insights, but definitely will not help you if you want to do any kind of comparative analysis. If you make decisions based on sampled data you basically work with inaccurate data. These decisions can lead to:
- A loss of trust in the data and risk of the reputation in the data/marketing team
- A financial loss for the company as you make budgeting decisions based on incomplete data
So let’s explore the options you have to avoid sampled data.
Sampling: How to avoid it when working with data
Option 1: Work with standard Google Analytics reports

Google does not sample the standard reports in Google Analytics. This means you are safe from sampling when you look at any standard report. If you look at top level metrics this will be the way to go. Chances are however, that this will not suffice for you. Especially when you made it as far that you have a sampled view, I doubt that looking at these top level reports will bring you one step further ;-).
Option 2: Use short date ranges

Another way to avoid sampling is to use a short date range. If you reduce monthly to weekly or even daily, the sampling will at one point disappear. This approach might work to look at very short date ranges but makes analysis of longer date ranges hard as you would need to export the reports into Google Sheet documents or CSV files and then somehow patch it together (which is a time waster you should probably avoid).
Option 3: Buy Google Analytics 360
As you can see in the opening paragraph of this article, the sampling threshold for Google Analytics 360 (aka Google Analytics Premium) is much higher (500k sessions on Google Analytics vs. 100m sessions on Google Analytics 360). The issue we see here is that it comes with a hefty price tag starting around $150k per year. Of course it not only comes with reduced sampling but also with other features but sampling is clearly the most important feature.
Option 4: Use Windsor.ai
Another option is to use Windsor.ai to extract all your data upsampled. For those looking at media KPI’s it also connects the upsampled data to the costs from your various sources (Google Ads, Facebook Ads, Bing Ads, LinkedIn Ads, Salesforce, Hubspot, GA4 …) and makes it available for you to work with in raw format via API, Looker Studio, Microsoft PowerBI or our own dashboard.
The steps to get started for free are:
- Connect your Google Analytics and your costs data here
- Load data for a date range of 20 – 30 days to get your upsampled insights insights
- Setup your dashboard in the platform of your choice (links above) and analyse data
- (Optional) Customize the setup to connect your Google Analytics Tableau data with your CRM or e-Commerce data or enable pulling and visualization of custom dimensions from your Google Analytics setup

Try Windsor.ai today
Access all your data from your favorite sources in one place.
Get started for free with a 30 - day trial.
Conclusion
It depends greatly on your technical abilities and your wallet to what option you choose. The most important takeaway which I’m sure you understood by now is that making decisions based on sampled data leads to many problems.
If you have another way of tackling this problem feel free to share it with us.
Other Articles which you also might be interested in:
- UTM tagging vs. Google Ads auto-tagging: What should I choose?
- How Do You Tag Facebook Ads Correctly For Google Analytics?
- Marketing attribution modelling, a general overview
- How to integrate your CRM lead forms with Windsor.ai
- Looker Studio Multichannel Attribution Dashboard Template
- Data driven attribution models
- Export your marketing data to BigQuery
- Free Google Analytics 4 Report Templates
