 AI insights
 About us
 Careers
 Security
 Customer reviews
 Contact us
 Affiliate program
 Solution partners
 Looker Studio templates
 Tableau templates
 Facebook Ads templates
 Google Ads templates
 Data fields & Metrics
 AI prompt library & Guides
 Product documentation
 API documentation
 Case studies
 Blog
Blog Data models
 Windsor vs Supermetrics
 Windsor vs Fivetran
 Windsor vs Portermetrics
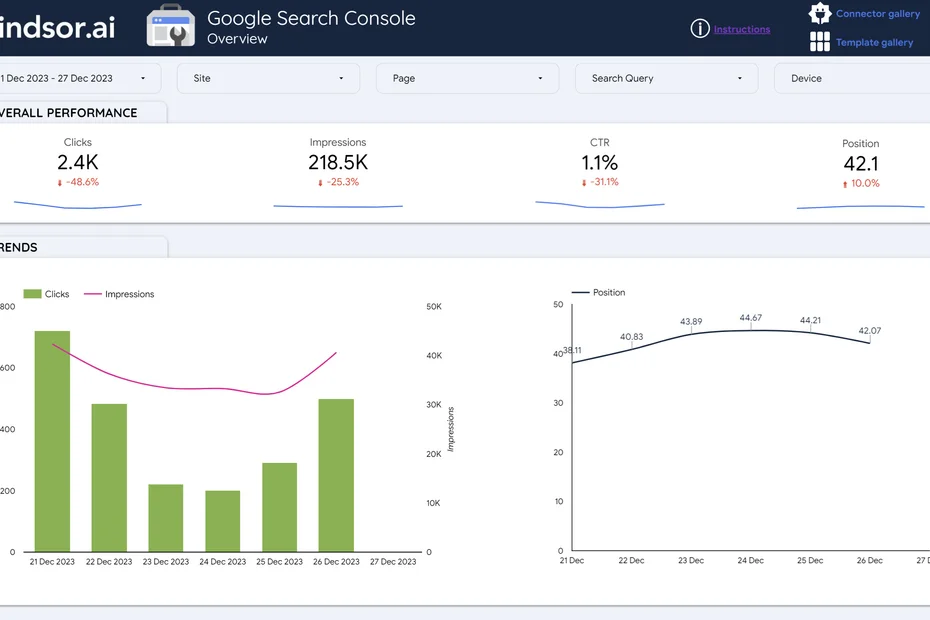
You need a Looker Studio (former Google Data Studio) SEO template if you do SEO campaigns. Search engine optimization (SEO) is key to website visibility for organic traffic, clicks, and conversions. When running an SEO campaign, you need to create SEO reports to track SEO KPIs metrics to know whether or not your SEO efforts are improving your site performance.
Thankfully, tools like Looker Studio allow users to create SEO dashboards easily.
Table of contents
- Looker Studio SEO Dashboard Overview
- Benefits of Looker Studio for Search Engine Optimization performance
- Prerequisites for creating a Looker Studio SEO dashboard
- How to Build an SEO Report Template in Looker Studio?
- Limitations of Google Data Studio SEO Dashboard template
- Conclusions
- FAQ
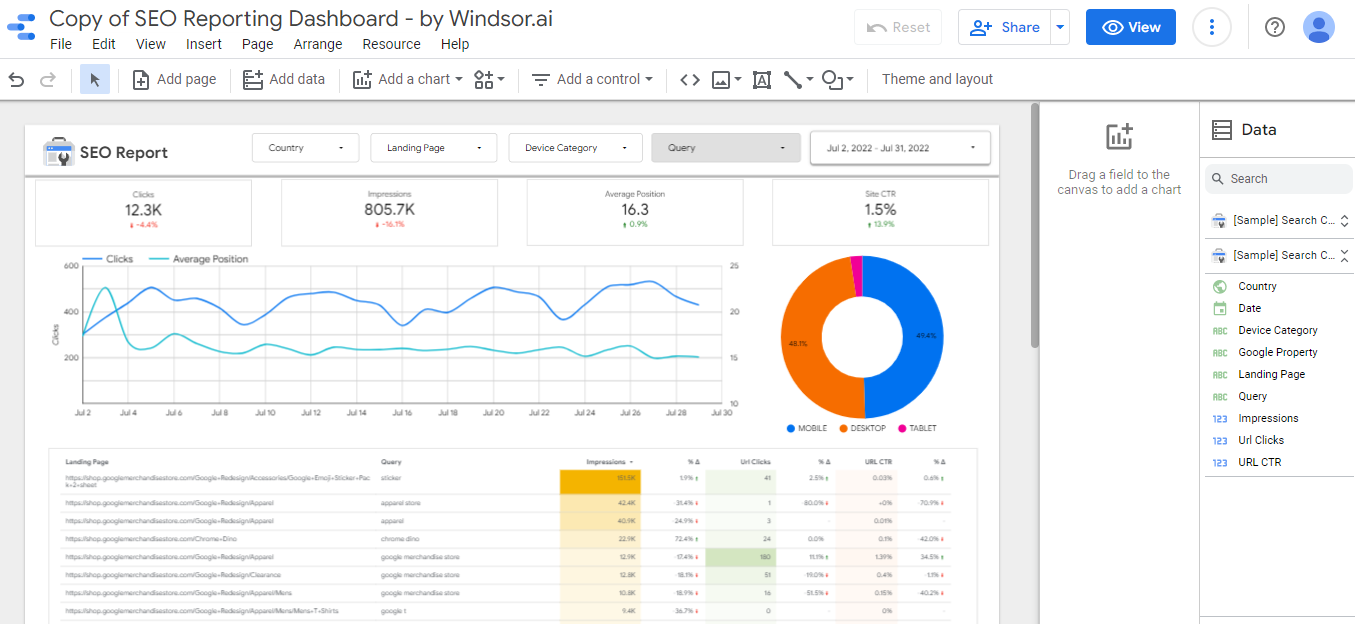
Looker Studio SEO Dashboard Overview
How you create an SEO reporting dashboard will depend on many things, including your target audience and SEO goals. For example, if you implement international strategies, you’ll need SEO dashboards that show the penetration of particular countries.
Within Looker Studio, there are different visualization elements for SEO reporting. Hereunder, we’ll examine key components of the Looker Studio SEO dashboard template.
How to use it
- Click on this link to open the template
- Make a copy of it (File -> Make a copy)
- For the new data source select CREATE NEW DATA SOURCE
- Under COMMUNITY CONNECTORS, go to EXPLORE CONNECTORS. Search for “Google Search Console by Windsor.ai” and add the connector.
Covered Topics
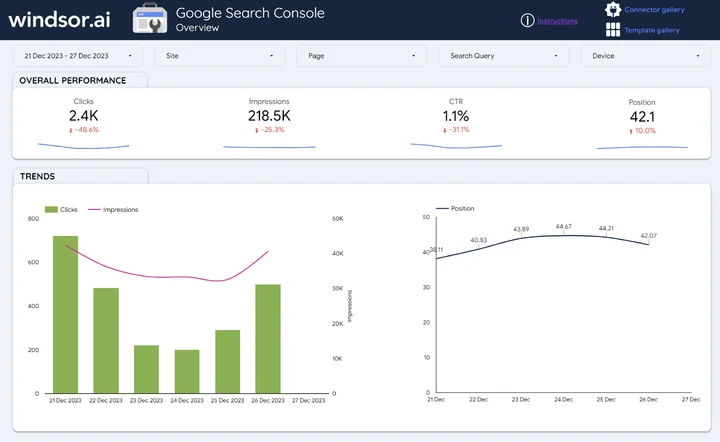
1. Overview Page
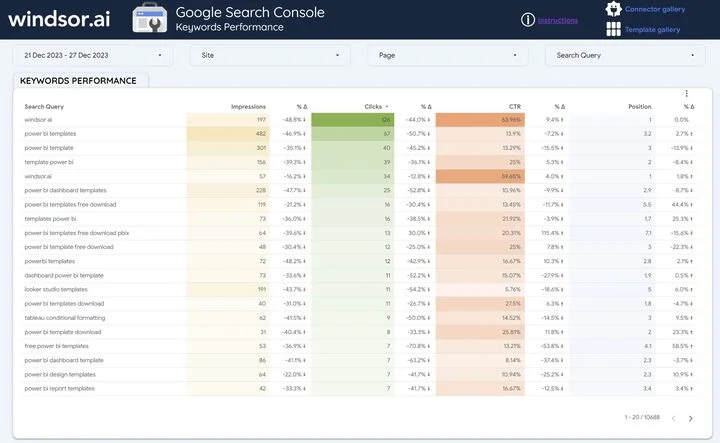
2. Keywords Performance Page
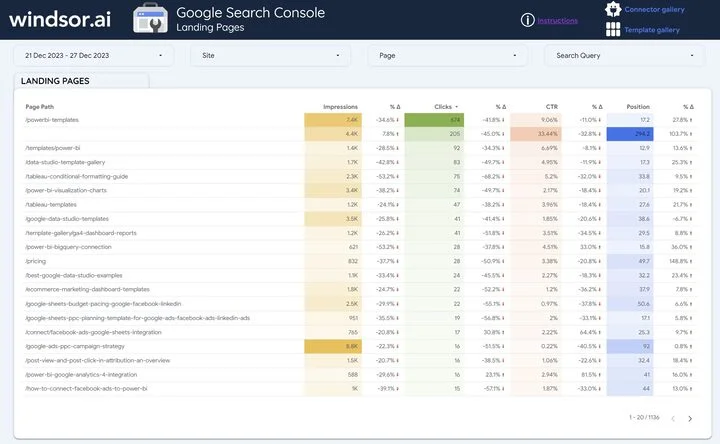
3. Landing Pages
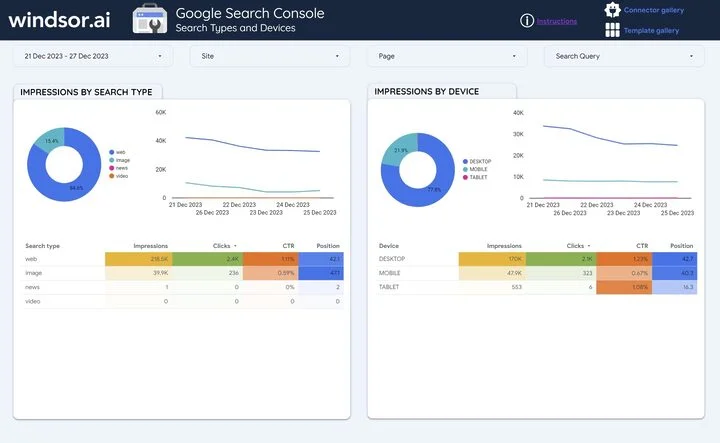
4. Search Types & Devices Page
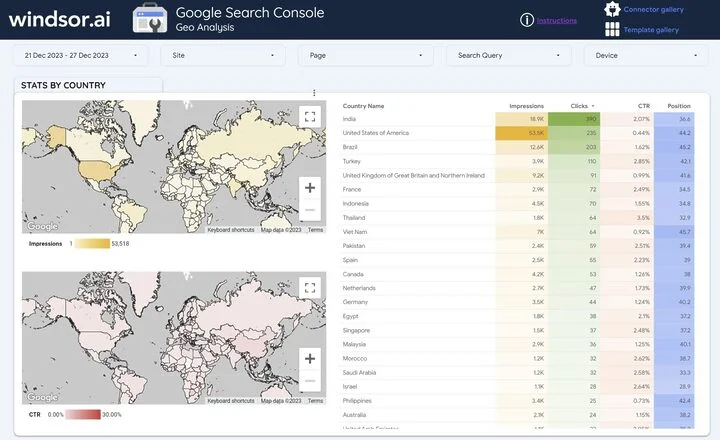
5. Geo Analysis Page
Questions that can be answered by using this template
- How is your website positioned on Google Search?
- How many organic impressions do you have on Google Search?
- How many organic clicks do you have on Google Search?
- What is your CTR?
- Which keywords perform best/worst in terms of impressions, clicks, CTR and position?
- Which are your best/worst landing pages?
- How do you perform by search type and device type?
- In which countries you perform best/worst in terms of impressions, clicks, CTR and position?

Try Windsor.ai today
Access all your data from your favorite sources in one place.
Get started for free with a 30 - day trial.
How to build your own Google Search Console dashboard in Looker Studio?
Add Tables
Tables are powerful visualization tools for many important SEO KPIs, such as impressions, clicks, click-through rates (CTR), etc.
You may choose the “Landing Pages” dimension, and use the tables to track bounce rate, session, and average time on site.
To add a table, click on the “insert” button on the toolbar, and in the resulting pop-up window, select “Table.”
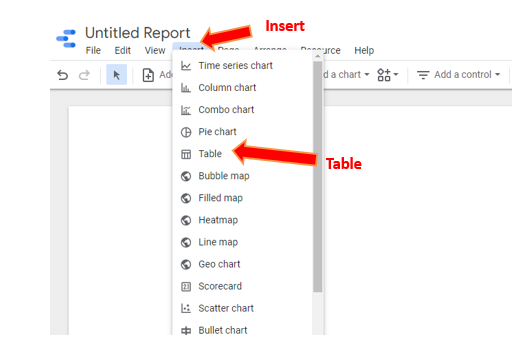
After clicking on “table,” drag and drop the table on the Looker Studio SEO dashboard. Then use the field on the right-hand menu to drag and drop the dimension and metrics you want to chart on the table.
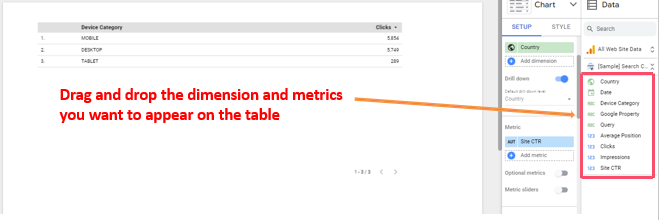
You’ll then have a table that looks as follows:
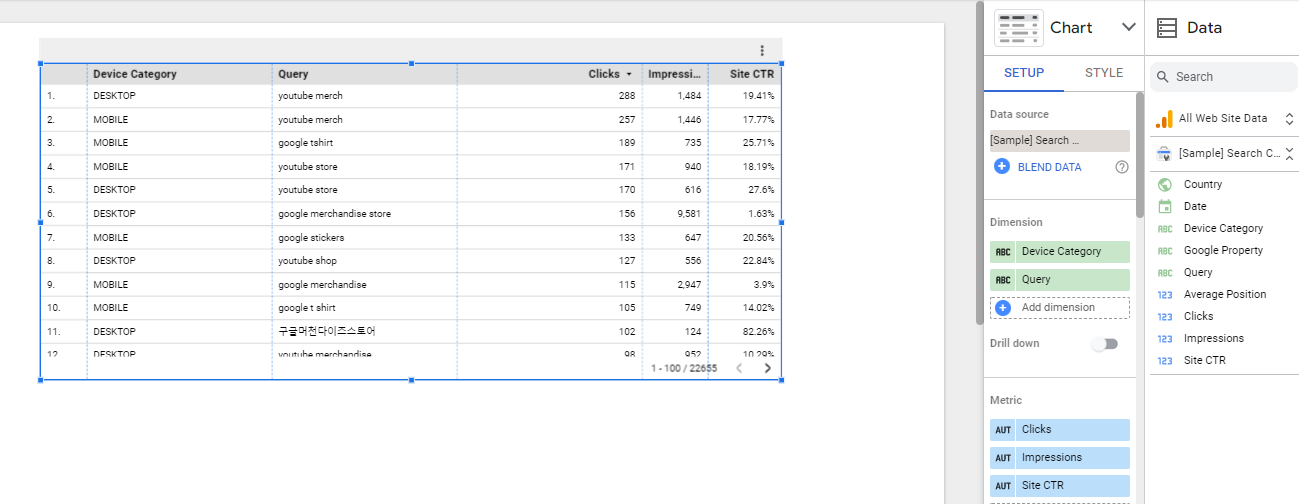
In the table, you’ll find that “Query” is one of the Dimensions charted, while clicks, impressions and CTR are the metrics charted. The table vividly shows the keywords that make your site visible in search engine results and drive clicks.
Add a Time Series chart
A Time Series chart is a powerful tool to help you visualize how your KPIs change over time.
You can chart performance before and after an SEO campaign to determine the result of the optimization. You may also use time series charts to provide periodically (monthly, quarterly, etc.) SEO reports. The line graph was previously demonstrated in a basic Time Series Chart.
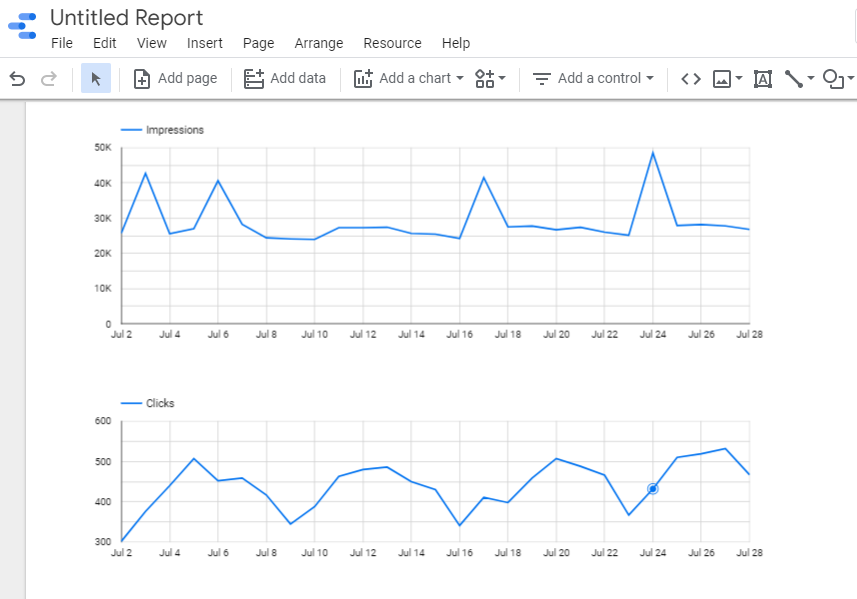
To add a Time Series Chart, you may use the same steps as adding a table. Click on the insert button on the toolbar and click on “Time Series” in the pop-up window.
Drag and drop the table on the SEO dashboard, then drag and drop the dimension and metrics you want to chart. The image below charts the impressions and site clicks for a designated period of time.
Add a Bar Chart
A bar chart is a powerful visualization tool, especially for comparing data sets. A bar chart in Looker Studio SEO dashboard templates will help you visualize your KPIs clearly.
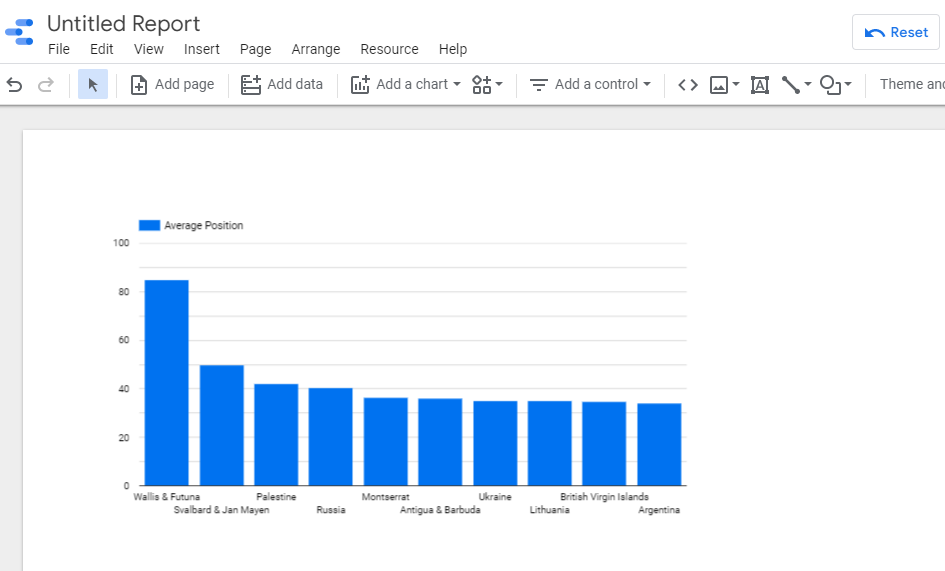
To add a bar chart, click on “Insert” on the toolbar and then click on “Column Chart” in the pop-up window. Then draw the chart on the dashboard and add your metrics.
In the bar below, using “average position” as the metric and “country ” as the dimension, you can see the website’s average position in Google searches in different countries.
Add a Pie Chart
The pie chart is an excellent visualization tool that makes it easy to visualize the relationship between the parts and the whole of a variable.
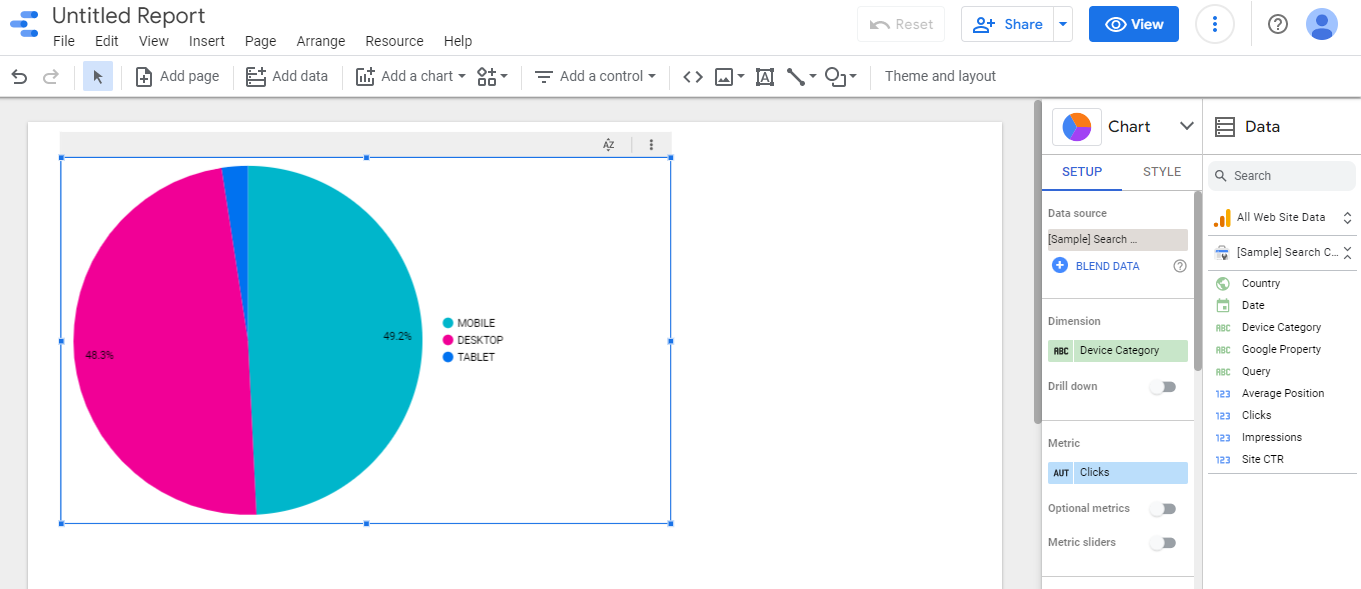
In an SEO Looker Studio template, a pie chart is excellent for tracking the type of devices that your site users are using so that you can implement design changes that drive traffic and conversions.
To add a Pie Chart:
- Click the Insert button on the toolbar.
- Click “Pie chart” on the pop-up window.
- Drag and drop your chart in the dashboard, then
- add the Dimension and metrics you want to chart from the right-hand menu.
Add Geo Chart
A geo chart helps you to know the specific areas of the world (countries, regions, cities, etc.) that are generating traffic, sessions, and conversions for you.
If you need to increase visibility in specific regions, then you need geo charts in your SEO dashboard.
It’s also easy to add a geo chart. Navigate to Insert and click on Geo chart in the pop-up window. You can then add your dimension and metric to chart the map.
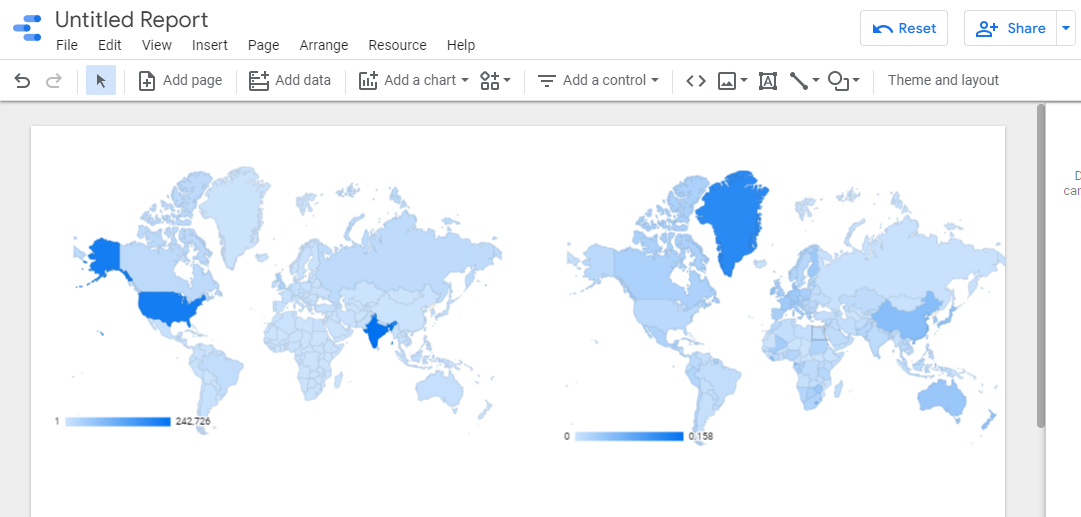
The Geo Chart above visualizes a site’s impressions and click-through rate worldwide. It shows that the site posts impressions in India and some parts of the United States but posts low CTR in these regions.
Thus, the site may need to make its titles and meta description more interesting to drive clicks.
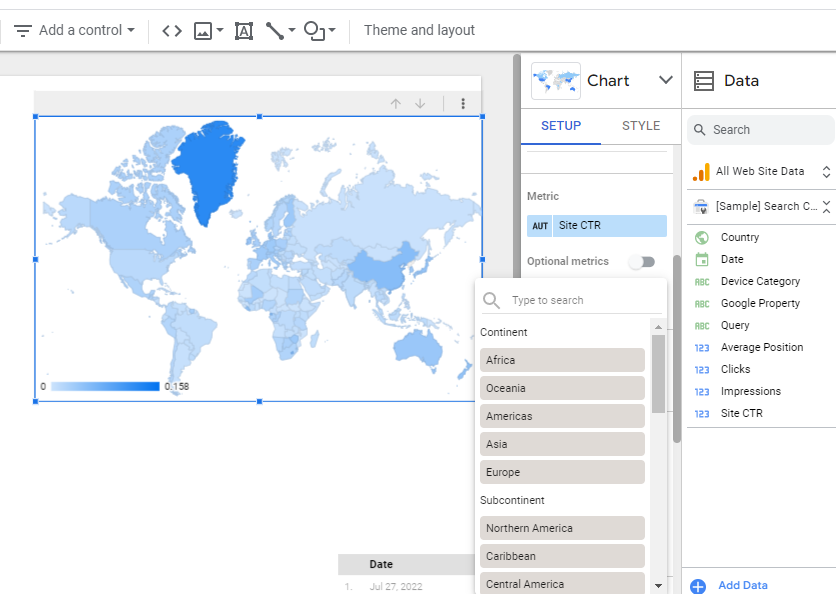
In the Geo Chart above, the zoom level is “world.” But for a more granular chart, you can change the zoom level to continents, subcontinents, and all the way to cities.
Move to the “zoom” button at the right-hand pane to do this. You’ll find it below the “Metrics” section.
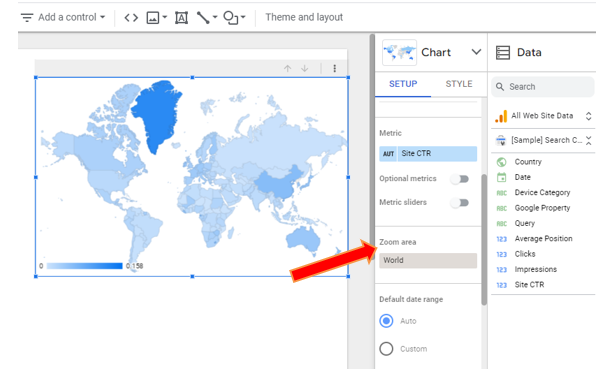
Clicking on it allows you to select a zoom level to narrow down the region for your Geo Chart.
Benefits of Looker Studio for Search Engine Optimization performance
Looker Studio is a versatile and powerful tool for data storytelling, particularly in the realm of SEO reporting. Its combination of user-friendliness, customization options, and integration capabilities make it a valuable asset for businesses and professionals seeking to effectively communicate their SEO performance.
- Cost-effective Solution: Looker Studio is a free tool, making it accessible to a wide range of users without any additional cost.
- User-Friendly Interface: Its intuitive design and user-friendly interface make it easy for individuals, even those without extensive technical expertise, to create and customize SEO dashboards and reports.
- Tailored Reporting: The platform allows for the creation of reports that are specifically tailored to the target audience, which is crucial for effective communication of SEO insights.
- Data Integration: Users can combine data from various sources, providing a holistic view of SEO performance. Looker Studio supports this by allowing seamless integration with Google Analytics, Search Console, BigQuery, Google Sheets, and professional SEO platforms like SE Ranking.
- Data Visualization: The tool allows for visualization of any combination of data, making it easier to convey complex information in a more understandable format.
- Time-Saving Automation: The automated report building and data compilation feature can save significant time and effort, especially for regularly generated reports.
- Accessibility for Less Experienced Users: It helps individuals with less understanding of SEO data to gain strategic insights, leveling the playing field for all stakeholders.
- Branding and Logo Integration: Users can create custom reports and dashboards that include their own branding and logo, ensuring a consistent and professional appearance
Some useful webinars
Prerequisites for creating Looker Studio SEO dashboards
To start using SEO dashboards in Looker Studio, you need the following:
- A Looker Studio account.
- Be in one of the supported countries.
It’s unsupported in only a handful of countries – The People’s Republic of China, Iran, Iraq, Crimea, North Korea, Syria, and Cuba.
Try Windsor.ai today
Access all your data from your favorite sources in one place.
Get started for free with a 30 - day trial.
How to Build an SEO Report Template in Looker Studio?
You need a Google account to log into Looker Studio and explore the Looker Studio dashboard. You may use the same account as your Analytics, Google Search Console, etc.
After logging in, you’ll find that the dashboard is similar to Google Docs, Sheets, or Drive.
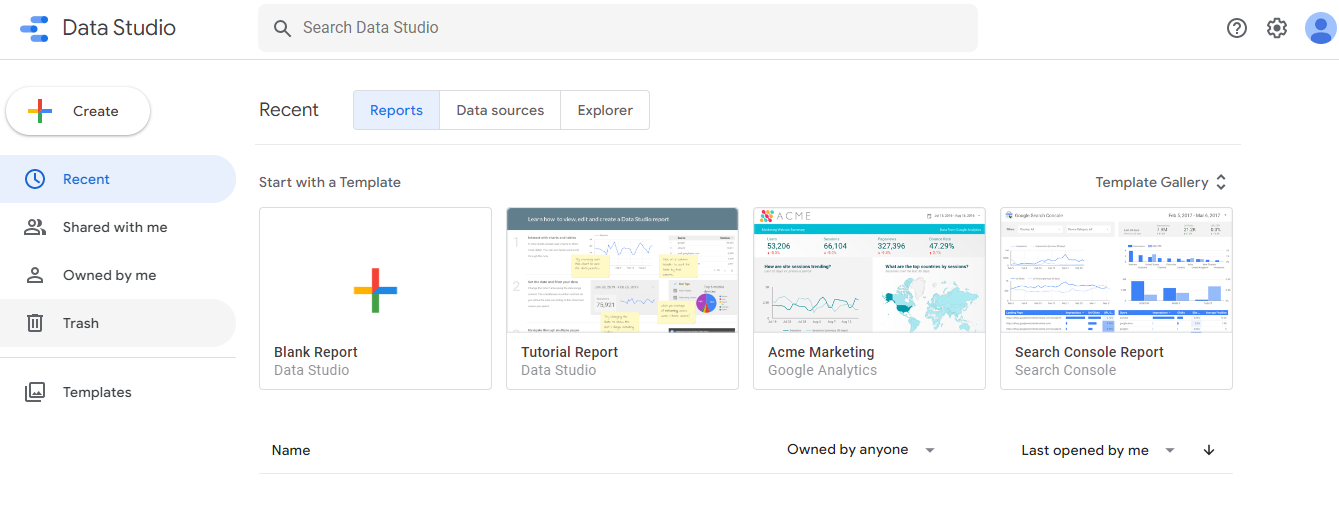
The “Reports” tab is where you can access all your reports. The “Data Sources” tab is where you’ll find the connections you created between Looker Studio and your data sources.
The “Explorer” tab lets you tweak a chart without modifying the report used in making it.
That said, to start creating SEO dashboards and reports using Looker Studio, implement the following steps:
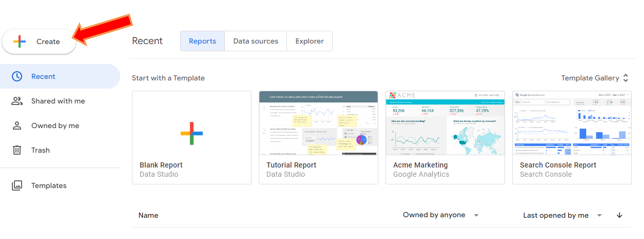
Step 1: Click “+ Create” to start a report
To connect to a data source, move to the top of the right-hand side navigation panel and click the “+ Create” button.
Step 2: Click “Data Source”
Then click “Data source” on the window that pops up when you click create.
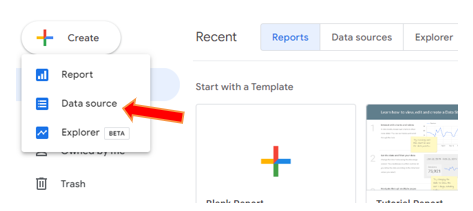
Then you can connect to about 23 Google Connectors, including Google Analytics, Google Ads, Google Sheets, BigQuery, AppSheet, File Upload (for CSV files), MySQL, Google Search Console, YouTube Analytics, and more.
You may also connect with 600+ “partner connectors,” which are connectors built and supported by Looker Studio partners. These include Facebook Ads, PageSpeed Insights, Google Ads, Mailchimp, Ahrefs, Semrush, Google My Business (GMB), HubSpot, eBay, etc.
Use the following links to find the right connectors:
Google Search Console offers the most comprehensive SEO datasets for websites. So, to create your SEO dashboard, you may choose to connect to the “Google Search Console” in the Google connectors section.
However, if you connect to Goole Search Console directly, you’ll have to create every element of your dashboard , which may be cumbersome and time-consuming.
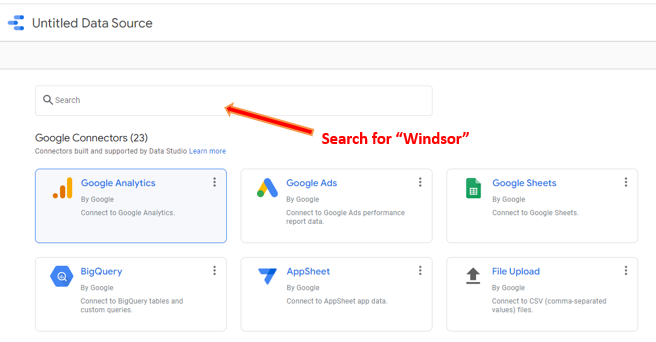
You can make the process easy for yourself by using a Looker Studio SEO dashboard template from a third-party connector. The Windsor.ai connector offers one of the most comprehensive SEO dashboards for Looker Studio.
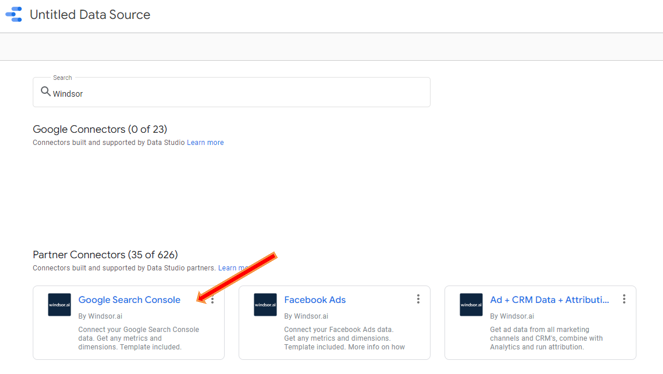
In the search panel, type “Windsor.”
There’s a shortcut to using the Windsor.ai connector for creating attractive SEO dashboards within Looker Studio.
Open the SEO reporting template by Windsor.ai.
Click on the three-dot icon at the top right corner of the page, and click “Make a copy.”
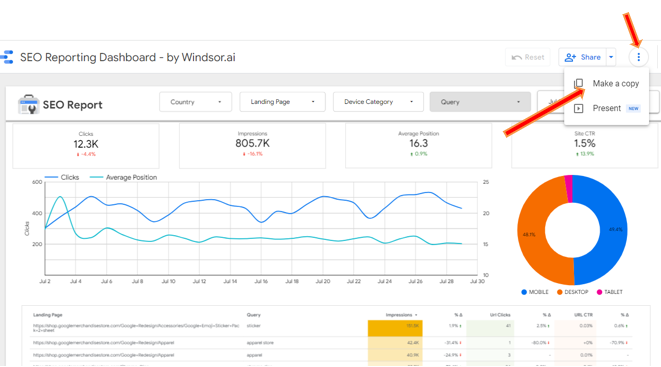
A pop-up window opens titled “Copy this report.” In the “New Data Source” field, select “New Data Source.”
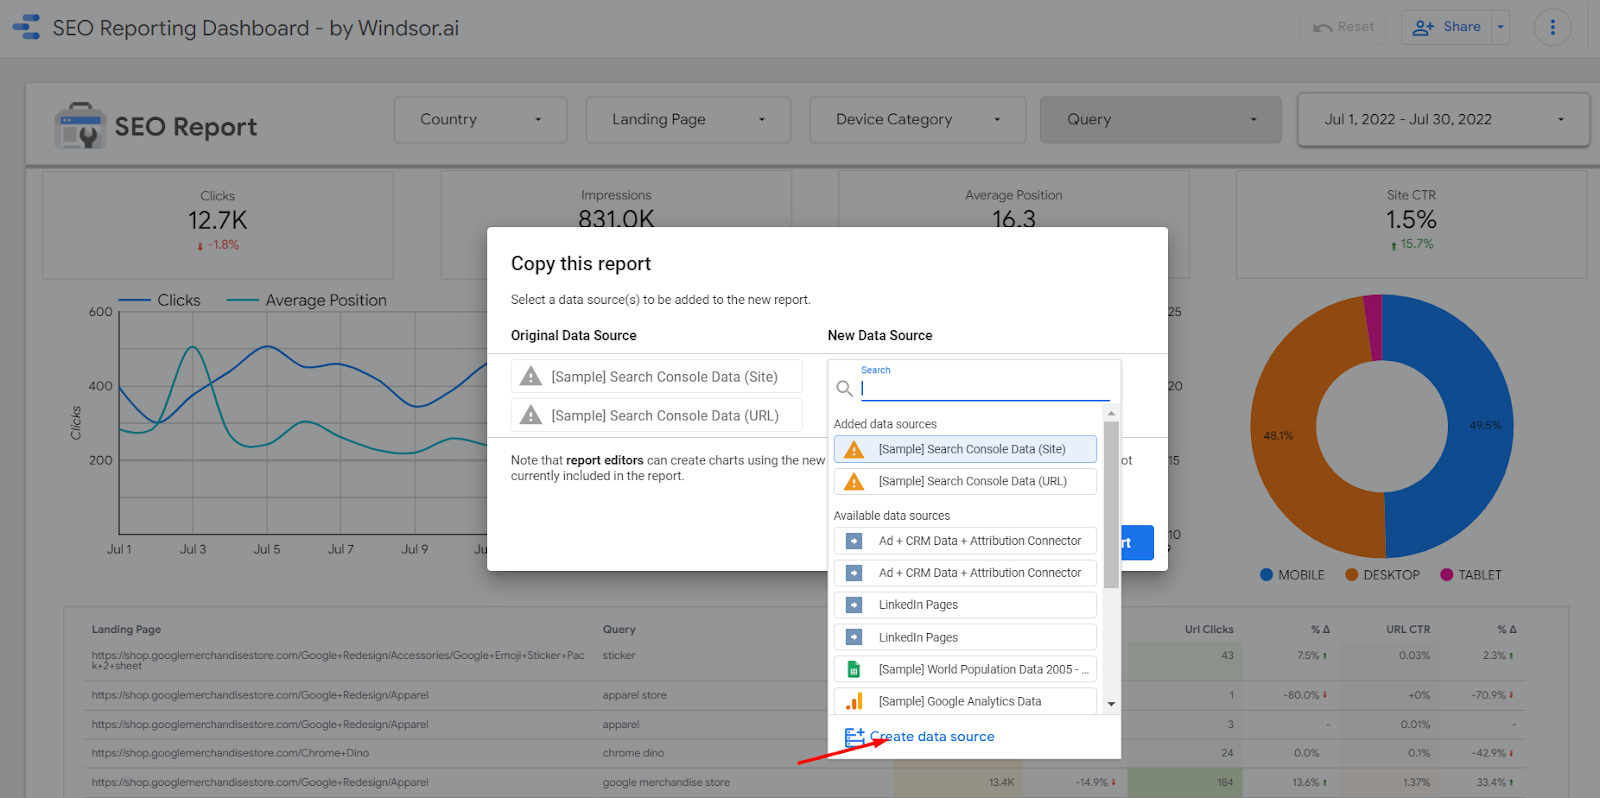
Then you can type “Windsor” in the search panel to connect.
Step 3: Connect to the Windsor connector
Under the “Partner Connector,” search for and select “Google Search Console.”
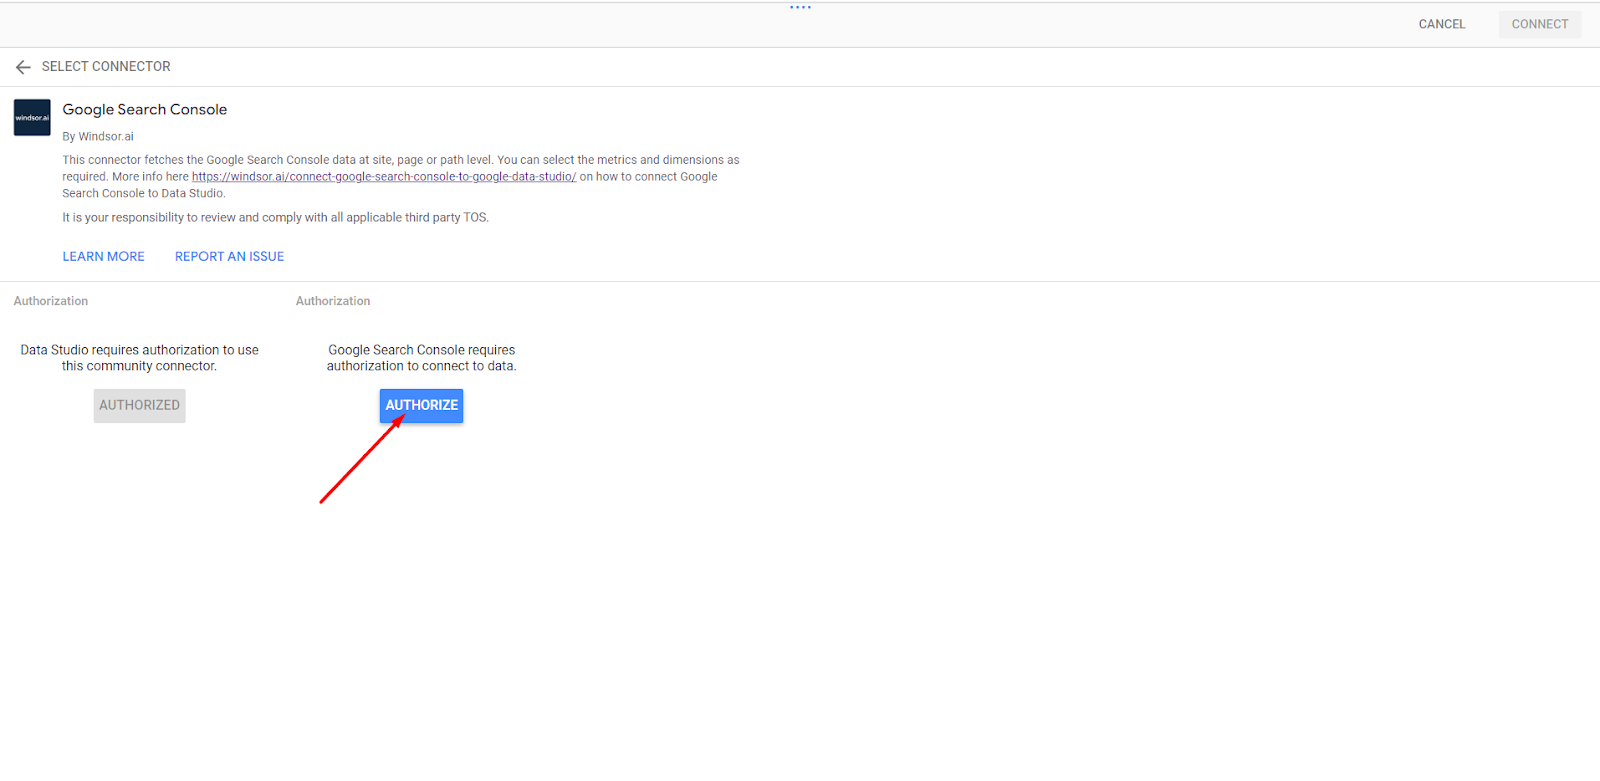
Step 4: Give Windsor access
You’ll then be prompted to give access to Windsor.ai. Click the “Authorize” button to grant access.
Step 5: Grant access to your Google Search Console account
In the window that pops up, click the “Grant Search Console Access” button.
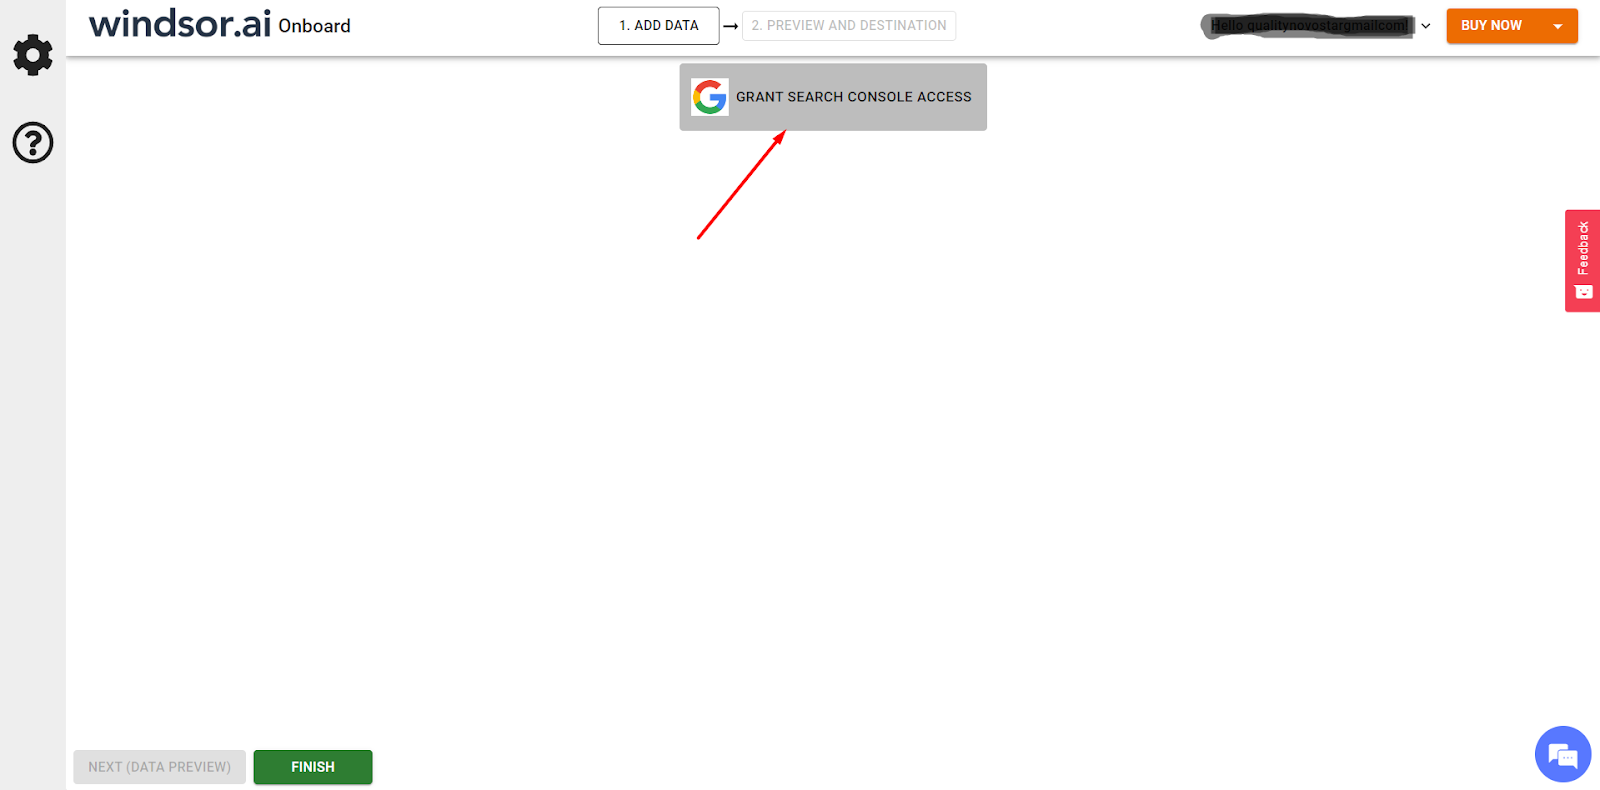
In the new pop-up window, select the appropriate account and continue. Then click “Finish.”
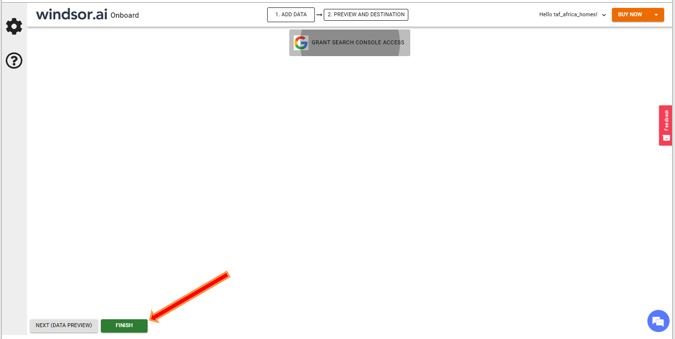
Step 6: Complete the connection
Navigate to the top right corner of the page for the “Connect” button and click it.
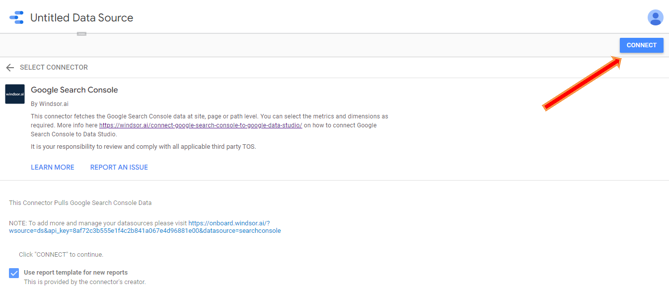
Your data in Google Search Console will then be loaded in Looker Studio. Your data will be presented as a table, listing every field in your Search Console account.
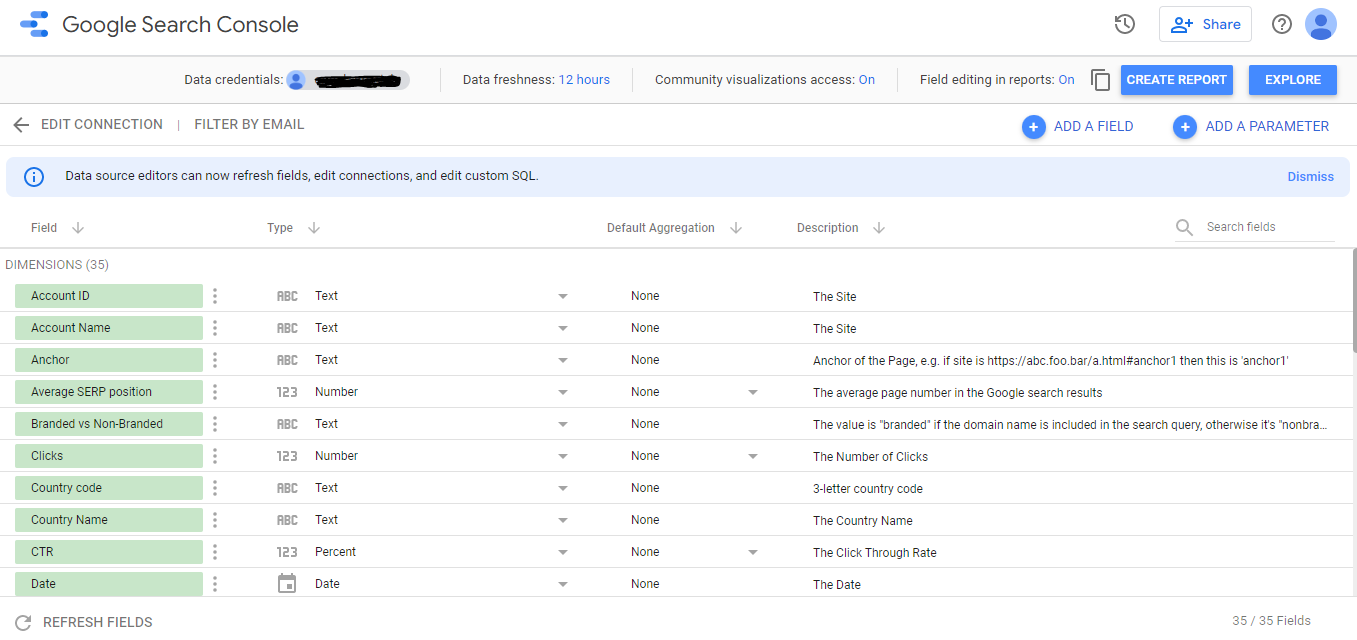
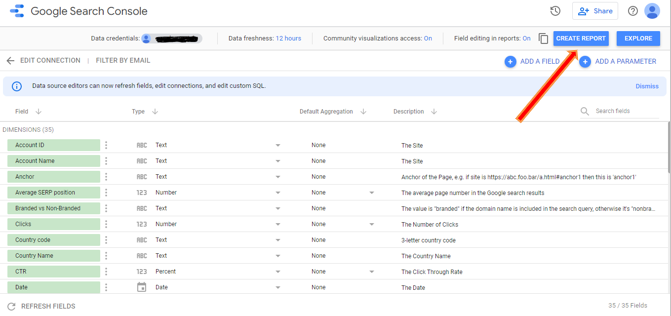
Then hit the “Create Report” button at the top right corner of the page to start your report.
It’ll load the Windsor SEO dashboard template.
Limitations of Looker Studio SEO Dashboard template
Looker Studio is a great tool for SEO visualization and reporting. However, it comes with some limitations. These include:
- It limits the number of charts per report
Looker Studio limits the number of charts you can use to report your SEO metrics. This may not be an issue with startups. But it will be a big issue for large organizations that run large campaigns with layers of metrics and supermetrics for SEO to track and measure.
- It has a limited display
A crucial limitation when visualizing SEO KPI in the Looker Studio platform is that it does not display year-over-year trends. Leading SEO agencies like SeoProfy use additional tools to track and compare historical data trends effectively.
- It is not a BI tool
Looker Studio is, at best, a reporting tool that allows users to create beautiful reports, like SEO monthly reports. However, it lacks the advanced BI capabilities of tools like Tableau and Power BI.
For example, Looker Studio lacks advanced visualization. It also lacks the SUMX feature for summing columns and rows.
- Lack of real-time updates
Looker Studio offers Live Connections for many data sources. However, while this allows you to pull the latest data through the platform at any time, it does not offer any way to auto-refresh dashboards or report views.
So, you’ll not be able to project a real-time updated dashboard. The only way is to use a third-party plug-in.
- Slow live connection
Using the Looker Studio live connection can be frustrating because of its low speed. When queries get more complex and data sources become more varied, the platform begins to lag.
- Lack of API for Automation
Looker Studio lacks an API for enabling data automation. You can use the platform to create and send periodic reports , but there’s no way to automate such a process.
However, automation is necessary for today’s competitive business environment to save time from creating repetitive data reports.
Conclusions
If you need to create an SEO report, Looker Studio is one free tool to use. A Looker Studio SEO dashboard is a tool to visualize your SEO metrics and KPIs to know the success of your SEO campaign. One of the easiest ways to connect your SEO marketing data to Looker Studio is using a Windsor.ai connector.
Try Windsor.ai today
Access all your data from your favorite sources in one place.
Get started for free with a 30 - day trial.
However, as mentioned earlier, Looker Studio has some limitations, especially as it lacks advanced visualizations and BI capabilities, real-time updates, and API for data automation. If you’ll rather connect to an advanced visualization tool like Tableau and Power BI, Windsor.ai is also one of the best connectors you’ll find.
Windsor.ai gives a better way to integrate your data for analysis, visualization, and reporting. With Widsor.ai, you’ll get:
- Excellent support for a wide range of data sources, including Google and non-Google sources
- Advanced SEO metrics visualizations
- Real-time data migration for real-time views and reports
- Data automation to save you time
Interestingly, Windsor.ai is very easy to use and does not require you to code. It also has a 30-day free trial.
FAQ
How do I create a SEO dashboard in Looker Studio?
This guide provides a clear roadmap for creating an effective SEO dashboard in Looker Studio:
- Connect Data Sources: Establish connections with sources like Google Search Console and Google Analytics.
- Start a New Report: Begin a new report in Looker Studio.
- Select Data Source: Choose the relevant data source (e.g., Google Search Console) for your SEO metrics.
- Add Elements: Incorporate elements like tables, charts, or scorecards to visualize the data.
- Configure Visualizations: Set up each visualization by specifying the data source, dimensions, and metrics to be displayed.
- Customize Dashboard: Add filters, date range controls, and organize elements logically for a comprehensive view.
- Save Your Work: Make sure to save your dashboard regularly to avoid losing any progress.
- Share Your Dashboard: When the dashboard is ready, use the ‘Share’ button to distribute it with relevant stakeholders.
Can I share my SEO report from Looker Studio?
You’re absolutely right. Sharing SEO reports in Looker Studio can be done through various methods:
- Share Button: You can click on the “Share” button and add the email addresses of the people you want to share the report with. They will receive an email invitation to view the report.
- Manage Access: Clicking on “Manage access” allows you to control who has access to the report. You can adjust permissions and copy the link to share with specific individuals.
- Download as PDF: The “Download” button allows you to export the report as a PDF file, which can then be easily shared via email or other platforms.
What is Looker Studio in SEO?
Looker Studio is an essential tool for SEO professionals. It allows them to consolidate data from different sources, create visually appealing reports, and gain valuable insights into the performance of their websites in search engine results. This helps in making data-driven decisions to enhance SEO strategies and ultimately improve search engine rankings.
Read also:
Power BI vs. Google Data Studio: Which Is Better?
15 Best Looker Studio Example Dashboards
Main Types of Google Data Studio Templates