How Do You Tag Facebook Ads For Google Analytics?
As a best practice, performance marketers should always tag Facebook traffic to measure the campaign ROAS/CPA in Google Analytics. When you rely solely on the Facebook Pixel for conversion information, you are assuming that Facebook provides unbiased and complete data. Since advertisers tend to show themselves in the best light, it is a smart idea to cross-check Facebook Ad performance in Google Analytics. It is easy to do with a few key UTM tags. Tagging can also be referred to as URL tracking, link tracking, UTM tagging or campaign tracking.
How Do You Tag Facebook Ads For Google Analytics?
Step 1. Create A New Campaign In Facebook
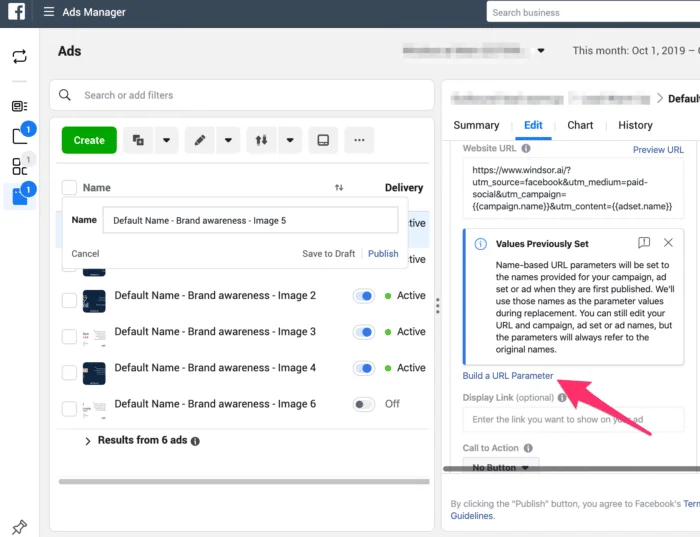
Step 2. Fill Out The Website URL
Step 3. Build a URL Parameter
Use variables to automatically populate the campaign name and campaign content. Add a custom parameter for utm_term to store {{ad.name}} in the utm_term dimension. The utm_term dimension appears as keyword dimension in Google Analytics. Here are the recommended settings:
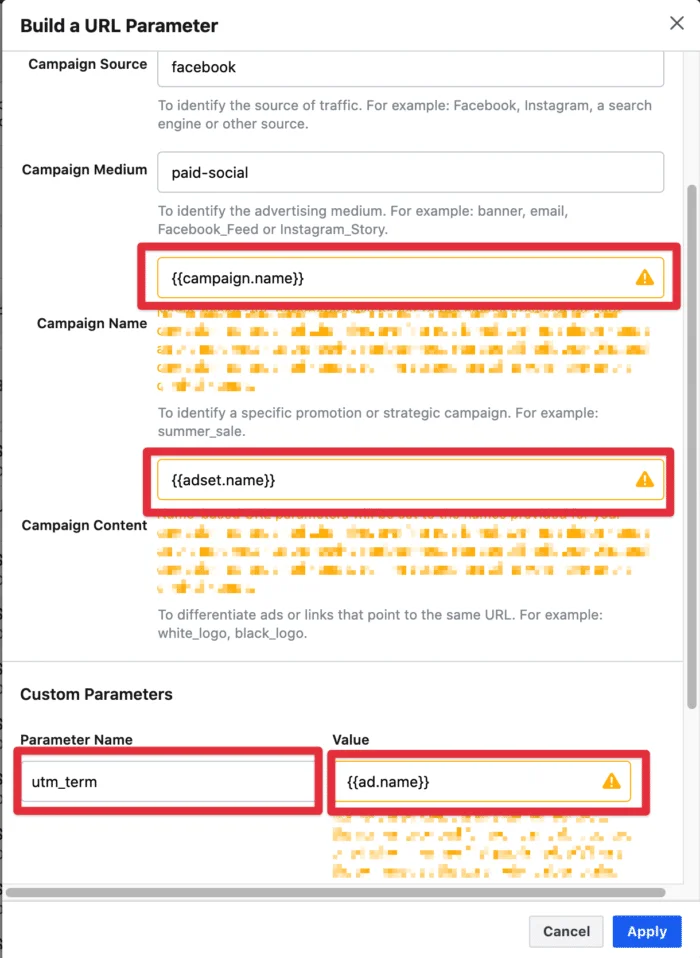
Note: for the campaign medium you might want to use
cpcinstead. This is depending on your channel groupings.
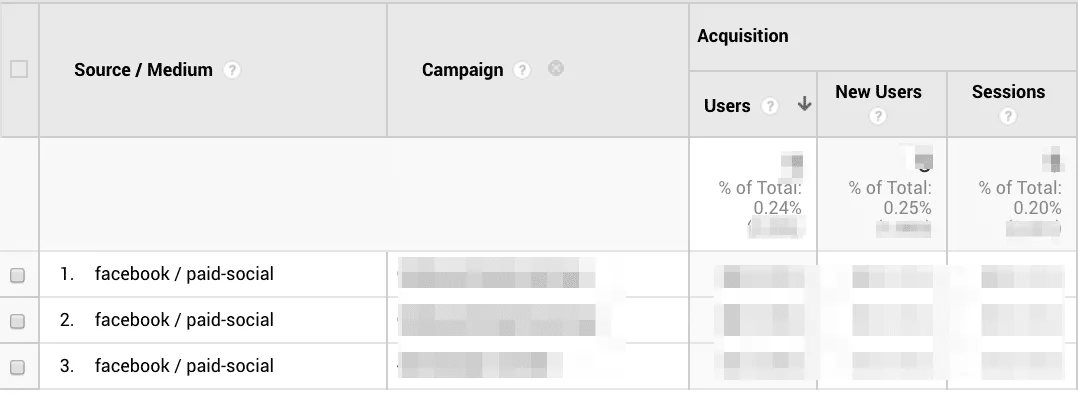
Step 4. Start tracking your paid Facebook performance in your Google Analytics data
Now you will see the traffic and the conversions/revenues from Facebook in your Google Analytics and can start slicing and dicing the data according to campaign, ad set and keyword dimensions.
Step 5. Use a data pipeline tool like Windsor.ai to match Facebook costs automatically to your conversions/revenues (Optional)
Now that you have the conversion/revenue data tagged properly it makes sense to also look at the costs which lead to conversions. Our platform can help with this.

How to measure the impact of spend on Facebook data vs Google Analytics conversions.
We’re going cover learnings we had from clients on how to measure the impact of spend on Facebook data vs Google Analytics conversions.
Facebook is playing an important role for most performance advertisers. However, understanding how Facebook contributes to the overall conversions is one of the trickiest questions. First of all, Facebook encourages you to look at the Facebook conversion data while Google is telling you a whole different story using the last-click based Google Analytics data. The visualization below explains the issue.
A few steps are necessary to get good insights into your the contribution your Facebook campaigns have on overall conversions.
Get all the data in one place
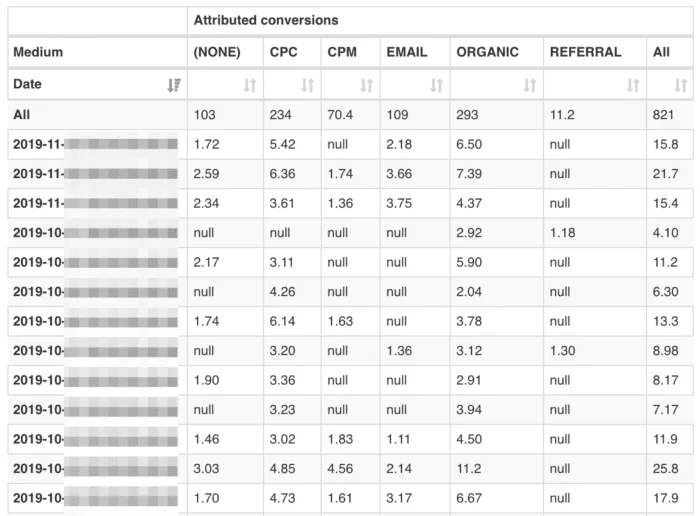
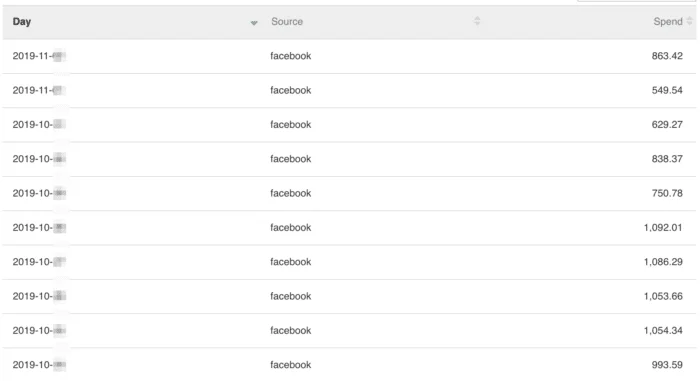
First, you want to make sure that you have all the data from Google Analytics (conversions) and Facebook (costs) in a database table or in a spreadsheet with a daily granularity. To get started really simple you can just export data from Facebook in CSV/Excel format and do the same from Google Analytics. If you would like to get the process a bit more automated and avoid wasting time on manual operations, you can get a variety of different tools.
The outcome of your extraction should be two tables which look similar to what you see below.
Get your insights
Now, we are going to look at the impact the Facebook spend has on Google Analytics conversions. We are now looking at how the media spending on Facebook impacts conversions on Google Analytics. Over time we have discovered that the strongest relationship between spendings (Facebook) and conversions (Google Analytics) is if we compare the spendings with paid search brand campaigns, also and organic search conversions.
Basic
That’s why in this very simple performance evaluation we are going to look at the data on weekly levels to understand what our weekly Facebook spend should be.
We are going to look at the data in a bubble chart:
- The entity of the chart (one bubble) = 1 week (Important: read the note below on how to determine the best entity)
- On the X-axis we look at the Spend on Facebook
- On the Y-axis we look at the Conversions we have on paid-search Brand campaigns and Organic search conversions
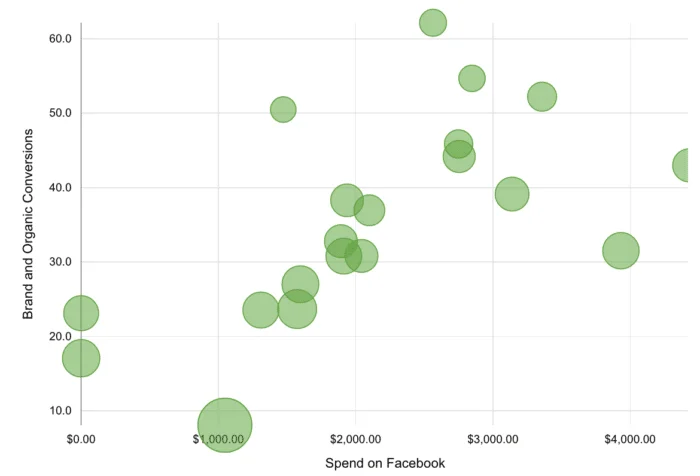
Now, these insights on the data set give a clear indication that we have an upward sloping trend on brand and organic conversions in the weeks with increased Facebook spending. Based on these insights the advertiser would ideally spend between $2000 and $3000 per week on Facebook.
The reason why we are choosing Brand and Organic conversions is that in multiple data sets we see the strongest correlation between Facebook spendings and these outcomes based on our client’s data. This may be different depending on your customer journeys.
An important note here is that the defined entity really depends on the product you are selling or the conversion you want to achieve.
If you have a product which is simple or is an easy sell the journey is shorter, whereas if you have a complex product you will have a longer customer journey.
So while for a luxury hotel (conversion > $ 5000) you might look at a 30 days conversion window, it is probably wise to look at the impact differently.
Advanced
To determine the effect of spending on revenue you can use a set of linear regressions. First you probably also want to clean data from the effects of special events (e.g. Black Friday or singles day, 11.11).
You can do this by removing revenue that is larger than 200% of the median value of revenue in the preceding 15 days and the following 15 days.
The best is to run a linear regression model separately for consecutive overlapping periods of 35 days (or longer, in case you have a really complex product you are selling). The result is a set of coefficients for Facebook for each day.
With this approach, you can clean data from seasonal effects and you can better deal with scattered data.
These regression coefficients show the effect of an increase in the costs of Facebook on total revenue (at a daily level),
These coefficients can be used to calculate relative shares of revenue that can be attributed to Facebook.
Try Windsor.ai today
Access all your data from your favorite sources in one place.
Get started for free with a 30 - day trial.
Why You Can’t Match Facebook Conversions to Google Analytics Data
Marketers and companies have been struggling to match Facebook conversions to Google Analytics data, with no luck. And they won’t succeed so easily.
That’s because they both use different attribution models. Google tracks cookies on a single device at a time. While Facebook follows user activity spanning many devices.
Now, marketing problems arise due to huge discrepancies between Facebook and Google Analytics. Given the clear inconsistency, you can’t present the data to your stakeholders without justifying how Facebook Ads correlate to users’ path to purchase and improve overall traffic.
The massive challenges posed by Facebook and Google Analytics attribution models can be corrected by understanding how they differ so you can better design and drive brand visibility.
So, let’s find out the five primary reasons your Facebook conversions and Google Analytics tracking will vary.
Clicks vs. impressions
Google uses last click attribution model. In other words, it credits the last place a user clicked on before buying the product. So, a user may see your Facebook ad, go offline, do a direct search later, click on a PPC ad to land on your site. In this instance, Google will attribute this conversion to the PPC ad.
Besides, Facebook Insights tracks impressions via view-through and click-through tracking. For example, if a user clicks or views your ad and takes desired action within a default 28-day or 24-hour attribution window (respectively), Facebook considers it as a conversion.
Tip: To get the bigger picture of your ad campaign impact, disable view-through attribution in Facebook. You can also analyze multi-channel funnel reports in Google Analytics to pinpoint how Facebook is guiding visitors’ path to purchase conversions.
JavaScript snippets
There’s another major difference in Facebook and Google Analytics tracking. The latter runs a JavaScript code snippet to identify a visitor using cookies… which may seem unimportant at first.
But for today’s smart users — who are concerned about their online privacy, disabling JavaScript or clearing cookies is now a habit. Without these two tracking metrics, Google can’t produce accurate conversions.
On the contrary, Facebook doesn’t use JavaScript to track clicks. But, it uses a JavaScript code — otherwise known as pixel — for conversion tracking. So, if the pixel code can’t load on the user’s browser, Facebook won’t record a conversion.
Cross-device conversions
Google Analytics tracks user conversion path by assigning a unique client ID to each visitor. Ergo, it can identify new vs. returning visitors. Here Google acknowledges single device as a touch point for tracking. Suppose if a person used a tablet and later their smartphone to access the same site or landing page, then they’ll be given two unique IDs.
Facebook tracking operates on multiple touch points and multiple devices.
It can do that because it tracks the user’s social media activity since they have to be logged in to browse. Thus, it can use a nonlinear conversion path to follow user journey and show a better set of tracking data.
Sessions vs. clicks
One issue marketers face is the disparity seen in Facebook clicks and Facebook-referred Google Analytics sessions. What you need to understand is clicks are not the same as sessions.
Facebook records every click (post, ad or page link). Google defaults to a 30-minute session.
Let’s say, a visitor clicks on the Facebook post more than once within a 30-minute window and comes to your site. Now in this single session, Google will record only one conversion (and Facebook two) although the visitor may take multiple actions — download an eBook, read a blog, etc.
Furthermore, the visitor may leave the site before Google Analytics fully loads the tracking code. Or they become inactive once they’re on your site, i.e. clock out for 30 minutes and re-engage with your site. If so, Facebook will count one click and Google two.
Quick note: Facebook tracks All Clicks and Link Clicks. The former records every interaction, including likes, comments and shares. The latter tracks the actual number of clicks.
Premature exit
Adding upon the earlier point, there are instances of users clicking the Facebook Ad and quickly leaving or moving to another site before Google triggers the JavaScript code. There are a few reasons for this behaviour.
Such as, the webpage takes a long time to load. The user clicks by mistake. Or else, they visit the page later (they’re accessing the site during work hours). In such cases, Facebook counts this click as a conversion but Google can’t.
Tip: Make sure you place Google snippets in the header of each webpage, not in the body or footer. This way, you’ll have a higher chance to capture the user’s path to purchase before they bounce off.
Wait, there’s more
Is this all you need to match Facebook Ads and Google Analytics data to delight your stakeholders? Certainly not.
There’s no doubt these elements are crucial. But you must consider a few other Facebook and Google attribution variations to improve your analytics game.
- Google may show sampled data if your sessions reach 500,000 or more in volume. In simple terms, it creates an estimate of the full raw data. To review all data points, access server log files.
- If you’ve enabled filters for company-related IP addresses on Google, then internal traffic (say, employees) coming from Facebook gets excluded.
- Facebook records the time of the click (or view) that led to a conversion, whereas Google considers the time when the user acts (like purchasing the product).
- While your Facebook fans may belong to different demographics, there’s a chance only small percentage of them is engaging with your ad. In that case, revise and tailor the content to boost interaction and streamline analytics.
How to illustrate data inconsistency between Facebook & Google Analytics
Paid Facebook conversion
Are you attempting to integrate Facebook analytics data with third-party statistics from Google Analytics? And really Uncertain about how to represent sets of data to your consumers?
Facebook apprehends indirect “non-aligned ” conversions, whereas Google Analytics tracks linear conversion. View-through conversion tracking is not available in Google for Facebook traffic towards your site. Facebook tracks the cross-device conversion better in comparison with google analytics.
Organic Facebook conversions
Can only be tracked by using Google Analytics or any third-party analytics software. Favorable, Google Analytics displays the Facebook referral traffic with conversion data.
Main reasons for discrepancies ( Facebook click data and google analytic session data )
More numbers of clicks in 30 minutes for a post on Facebook is considered a Single session. Two sessions in Google analytic means 2 different time interactions before purchase, but in Facebook, it is considered to be 1 session. Fast bounce rate is not recorded in google analytics.
Steps to Create an Integrated report
- Select the measurable Metrics / KPIs to report positioned on your client’s Objectives, and coordinate them together accordingly.
- For identical metrics, report the two metrics alongside, precisely established as Facebook data and Google data.
- Introduce synopsis/ notes on the differences between identical metrics.
Closing thoughts
Google Analytics and Facebook Pixel conversions will never match since they both serve distinct goals. Google Analytics helps optimize your website traffic, and Facebook provides a robust platform for advertisement.
This contrast can prove useful once you know how to exploit the independent strengths of Facebook Insights and Google Analytics before rushing to connect the dots. And, if you want to integrate them (despite their differences) to inspire brand awareness, get in touch with a Windsor.ai champion today!
Sums up every modern marketer’s biggest problem quite nicely. With the walled garden approach of many large media companies, there is a tendency to look at data in silos rather than trying to understand the impact of spend on one channel to an outcome on another channel. I hope this post helps you to maximize the performance on your Facebook campaigns.
Book a Free Demo of Windsor’s Marketing Attribution Software, to see how it helps you get the best out of your marketing activities.
You might also be interested in
The Best Facebook Ads Report Templates to Try
The Best GA4 Report Templates to Try
Facebook Ads to Looker Studio: Connect Data Quickly
Connect Facebook Ads to PostgreSQL
Connect Facebook Ads to Azure SQL
Facebook Ads to Google Sheets Integration
Connecting Facebook Ads to Tableau
Connect Facebook Ads to Snowflake
Import Facebook Ads to Power BI
Power BI GA4 integration: How to Connect Them
Google Analytics 4 Looker Studio Connector


