 AI insights
 About us
 Careers
 Security
 Customer reviews
 Contact us
 Affiliate program
 Solution partners
 Looker Studio templates
 Tableau templates
 Facebook Ads templates
 Google Ads templates
 Data fields & Metrics
 AI prompt library & Guides
 Product documentation
 API documentation
 Case studies
 Blog
Blog Data models
 Windsor vs Supermetrics
 Windsor vs Fivetran
 Windsor vs Portermetrics
Free KPI Tracking Templates For Marketers
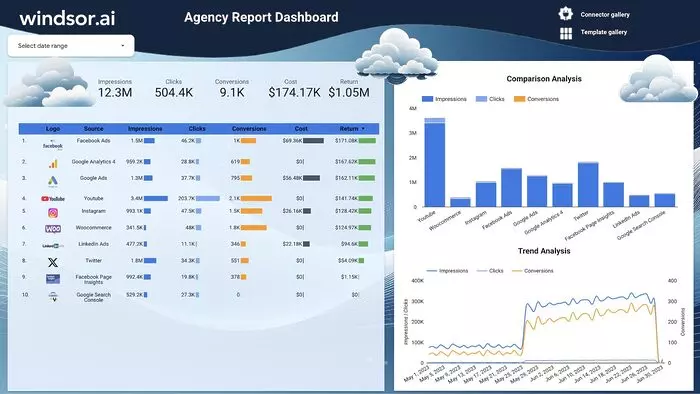
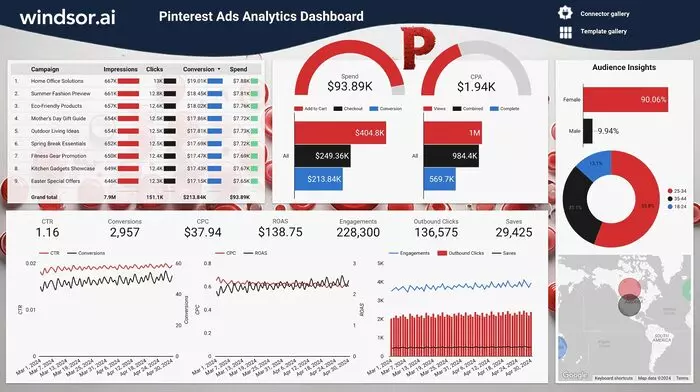
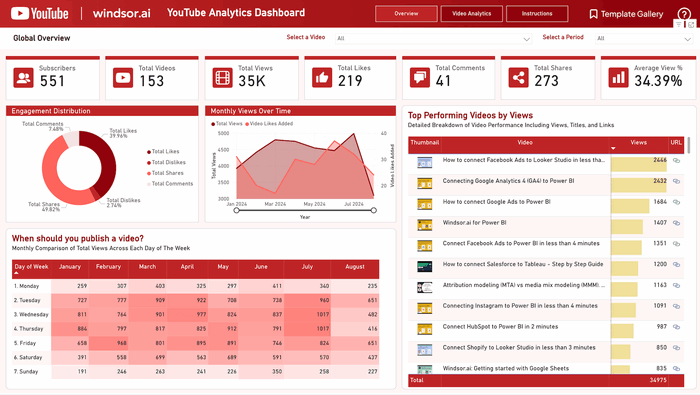
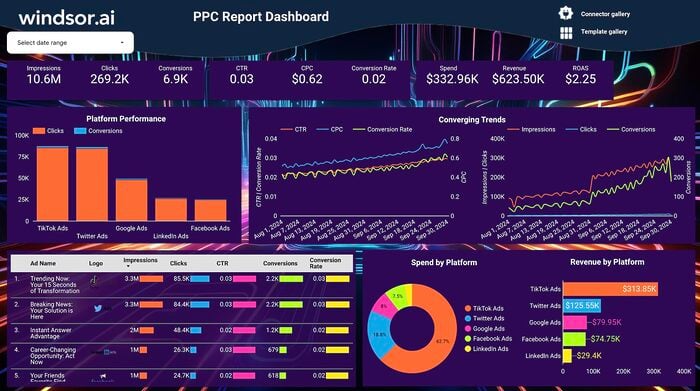
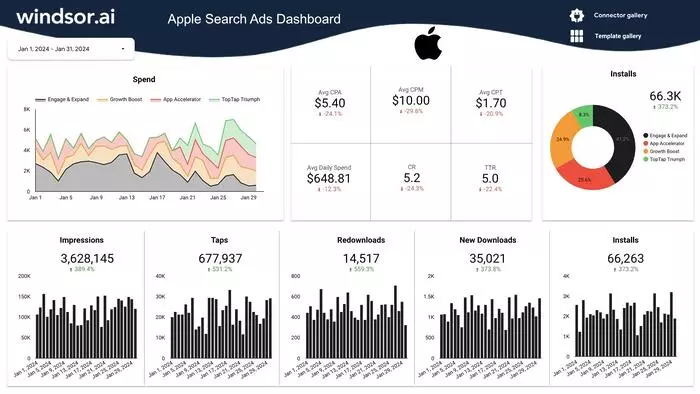
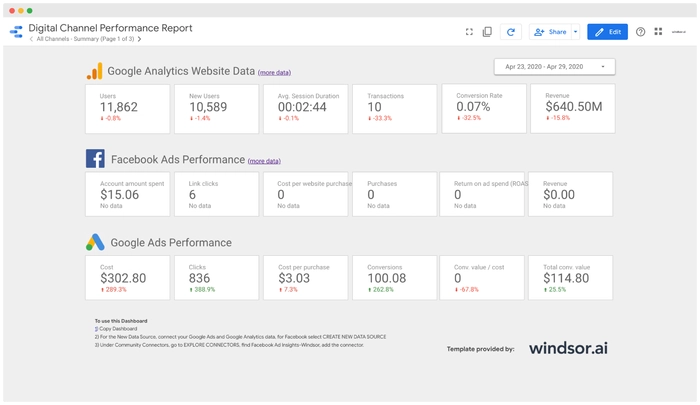
Windsor.ai offers a seamless way to track key performance indicators and generate insightful marketing reports with pre-built KPI dashboard templates. Use them to simplify tracking essential metrics, reducing workloads, optimizing budgets, and improving business outcomes.
Explore our vast library of KPI tracking dashboard reports, select the most suitable template aligned with your reporting needs, and set it up in just a few clicks—no technical and coding skills are required.


Try Windsor.ai today
Access all your data from your favorite sources in one place.
Get started for free with a 30 - day trial.
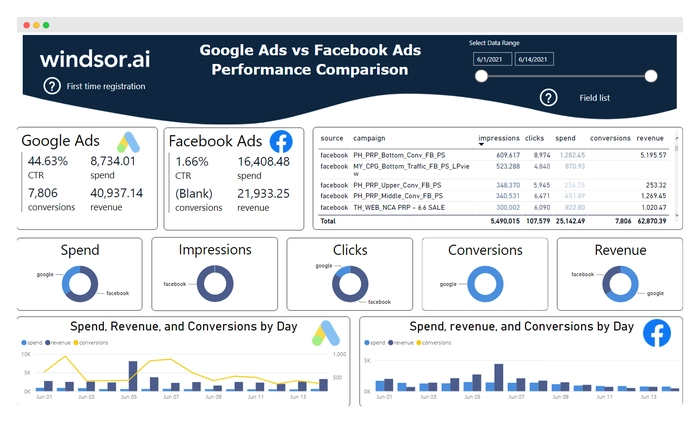
What is a KPI tracking dashboard?
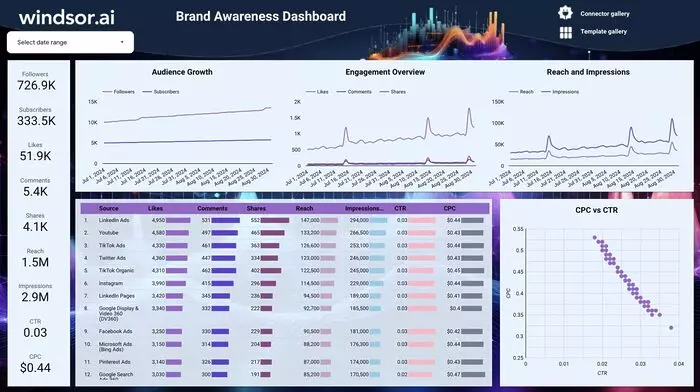
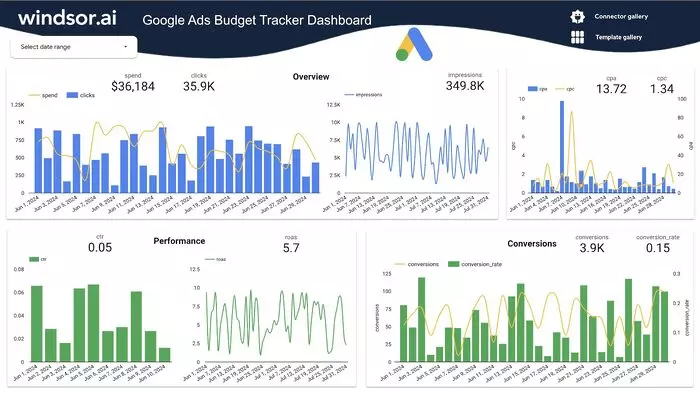
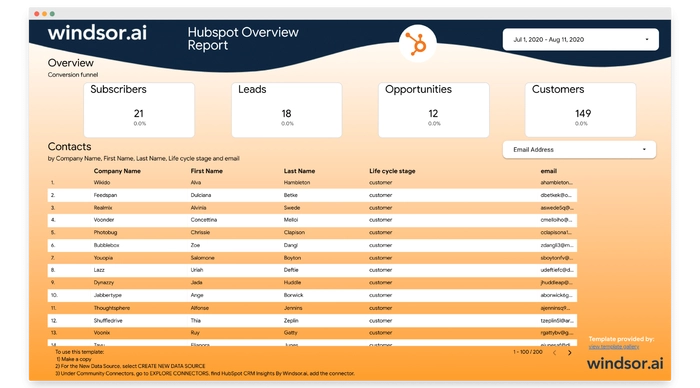
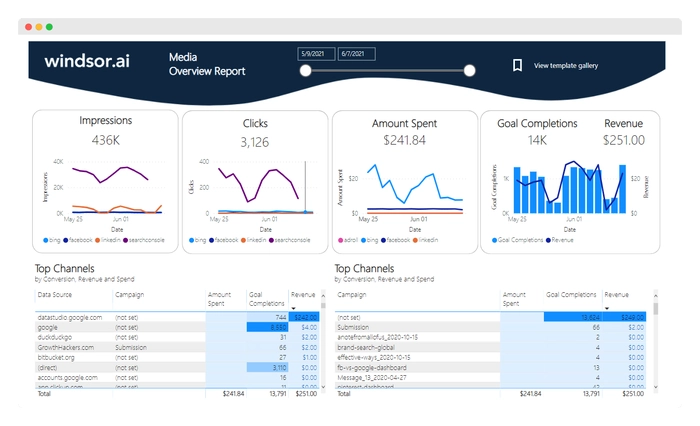
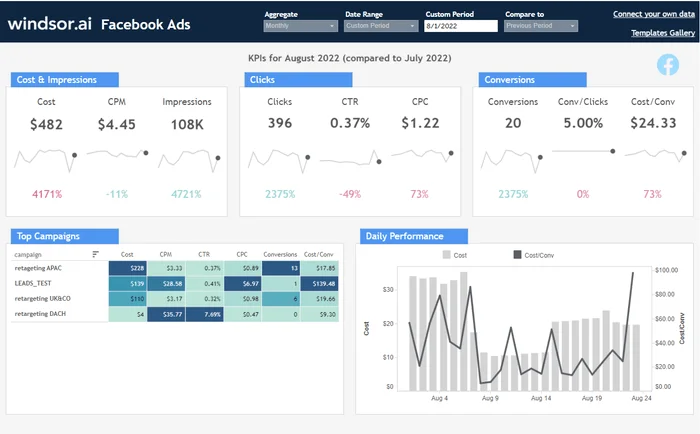
A KPI tracking dashboard is a visual representation of key business and marketing metrics in one centralized location. It serves as a powerful tool for business owners and stakeholders to monitor overall business performance and marketing campaigns, enabling them to make strategic decisions based on data-driven insights.
Windsor.ai’s KPI tracking dashboards greatly improve operational efficiency by streamlining data collection and analysis. With our fully automated data integration and visualization system, you can take full control over lead generation, conversion rates, and ad ROI, empowering you to make winning decisions.
How to effectively track KPIs: 5 steps
1. Defining metrics and collecting data
This is the foundational step where you decide which specific metrics are most relevant to your marketing goals. It’s important to choose metrics that directly align with your business objectives and marketing campaigns.
2. Benchmarking and setting goals
Next, you should establish benchmarks and quantitative targets. Setting clear, measurable goals in terms of general business outcomes and revenues is crucial. Whether you can achieve your set goals depends on whether they are concrete and evidence-based.
3. Measuring and reporting progress
Regularly monitoring and measuring your chosen KPIs against the defined targets is essential to determine if your marketing efforts satisfy the expected outcomes. You can easily monitor key performance indicators through Windsor.ai’s KPI tracking dashboard reports that let you measure metrics over time to identify the most effective marketing approaches.
4. Defining next steps
Based on the data gathered from KPI tracking, it’s important to identify areas for improvement and outline specific actions that can be taken to enhance performance. Use the obtained KPI tracking insights to achieve better results by redistributing budgets while refining marketing campaigns.
5. Sharing results
Visualizing KPI data through tools like graphs, charts, and KPI tracking dashboards makes it easier to understand and communicate results within the team or to stakeholders. The implementation of this step enables all parties to easily interpret trends to make well-informed choices. This visual representation also helps spot patterns and areas that require attention.
What KPIs should be included in a KPI tracking dashboard?
Businesses must track the most significant KPIs applicable to their business operations in their dashboards. Some of the main metrics include:
- Leads: Tracks users who show interest in purchasing or trying your product or service.
- Customer Acquisition Cost (CAC): Measures the cost incurred to acquire a new customer, helping assess the efficiency and profitability of marketing efforts.
- Website traffic: Monitors website visitor numbers and their engagement rates.
- CTR (Click-Through Rate): Calculates the percentage of people who clicked on a link compared to the total number of people who saw the link.
- Cost per Lead: Calculates the cost associated with generating a single lead.
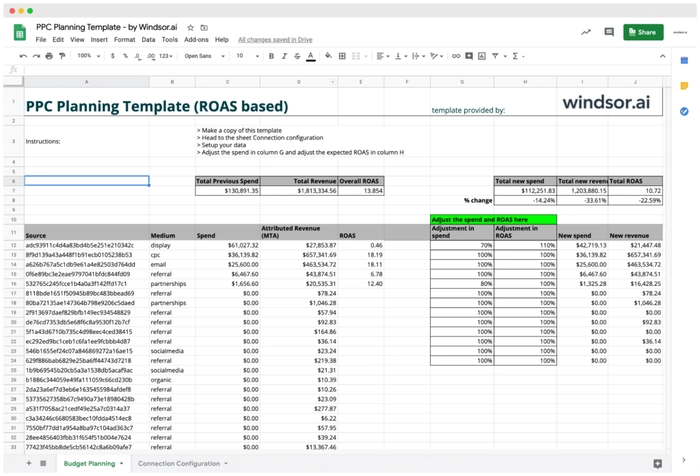
- Return on Ad Spend metrics (ROAS): Evaluates the overall effectiveness of your advertising campaigns by measuring the revenue generated for every dollar spent on advertising.
Top KPI tracking dashboards by Windsor.ai
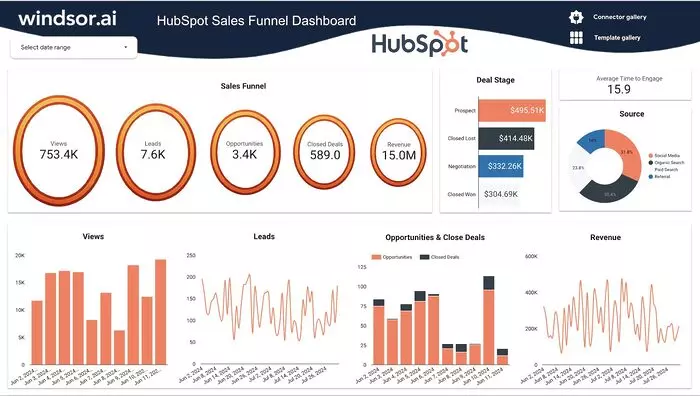
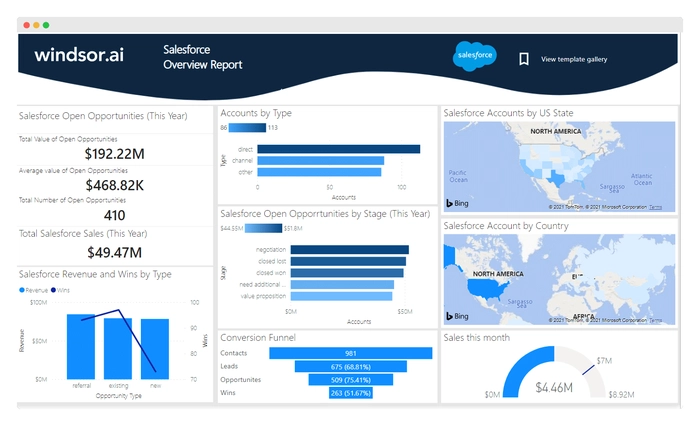
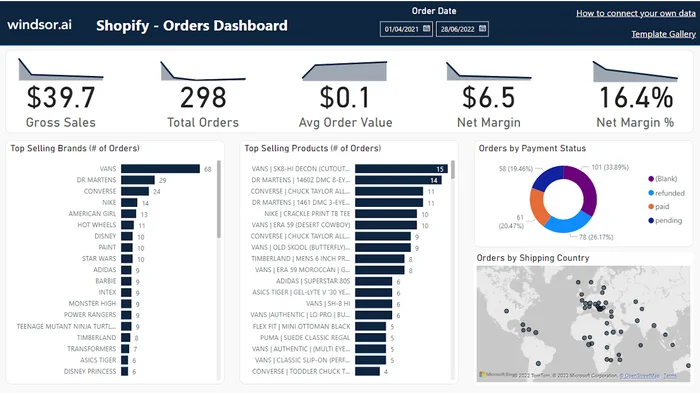
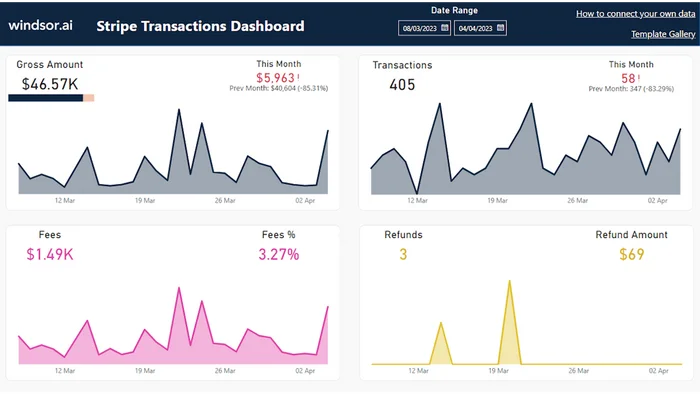
- Sales report template
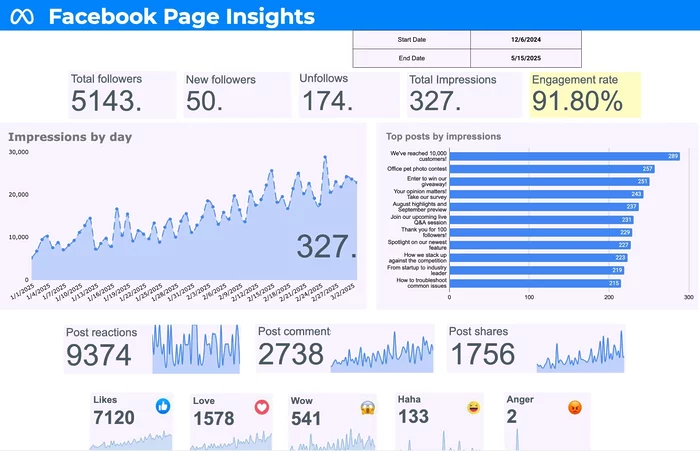
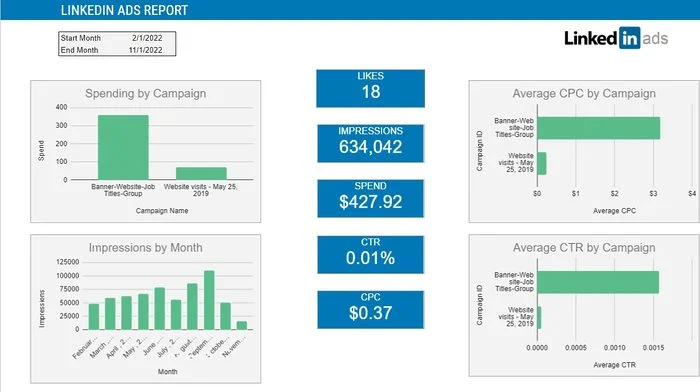
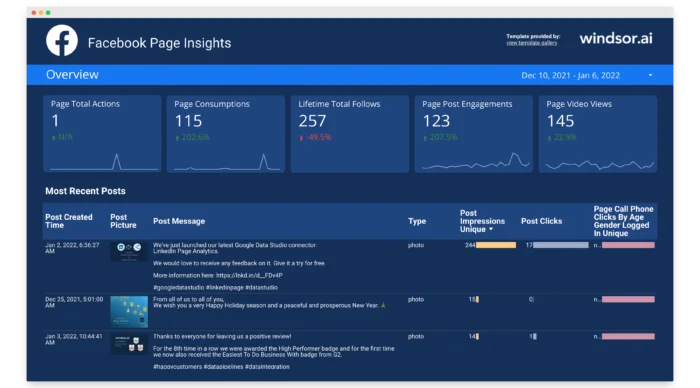
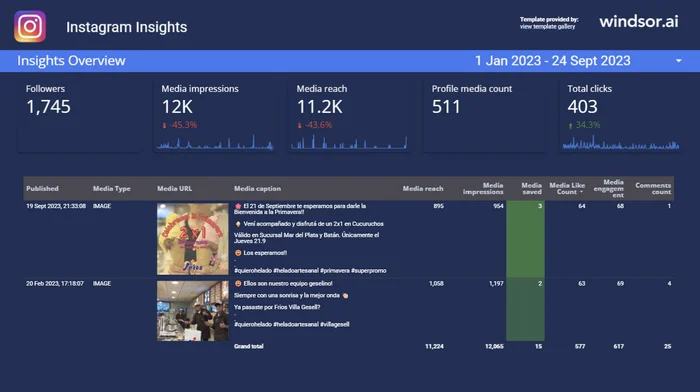
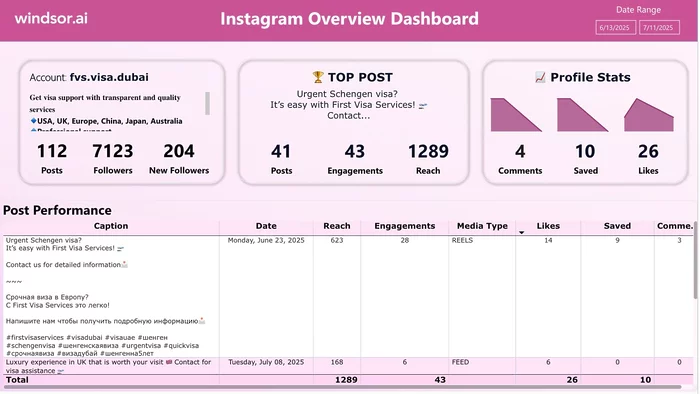
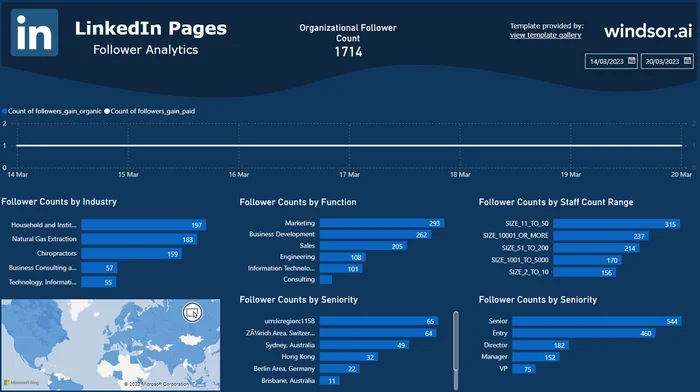
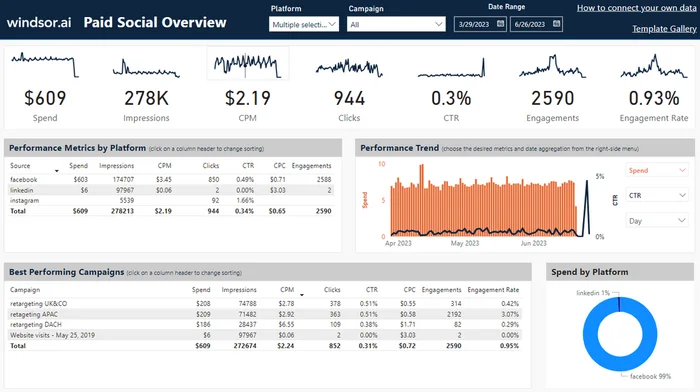
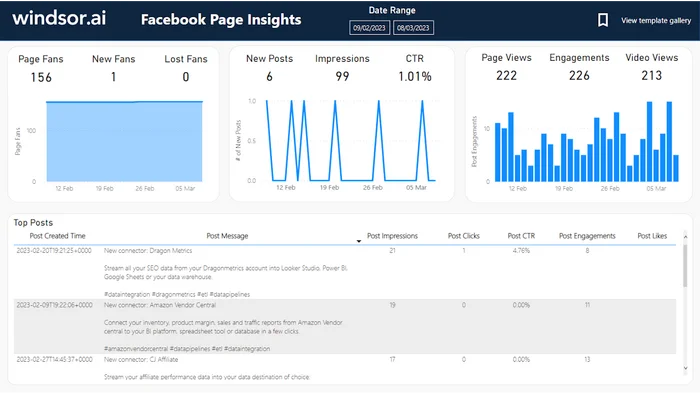
- Social Media report template
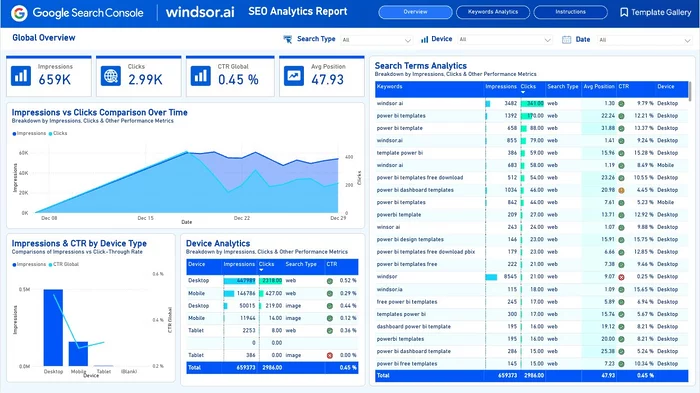
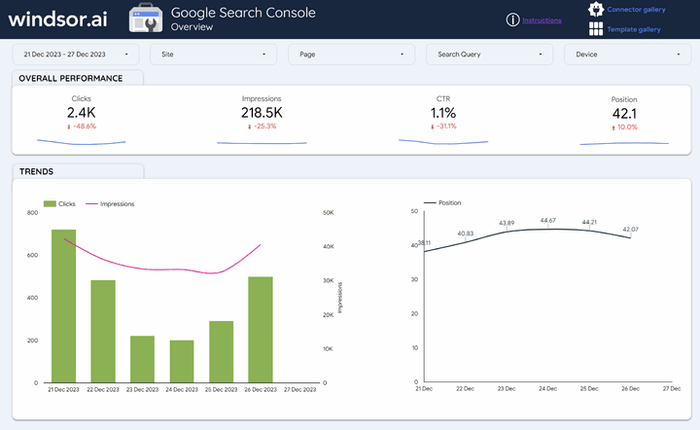
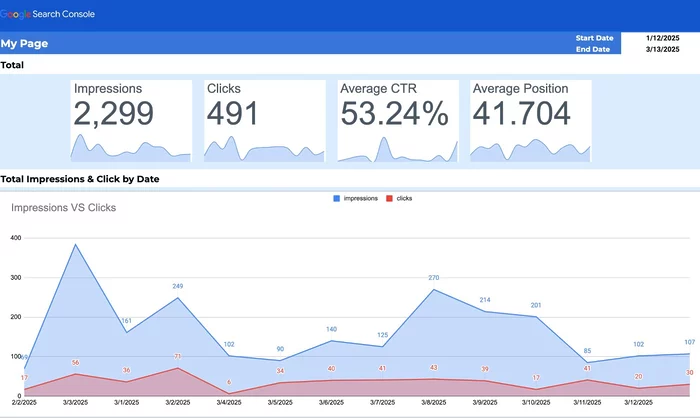
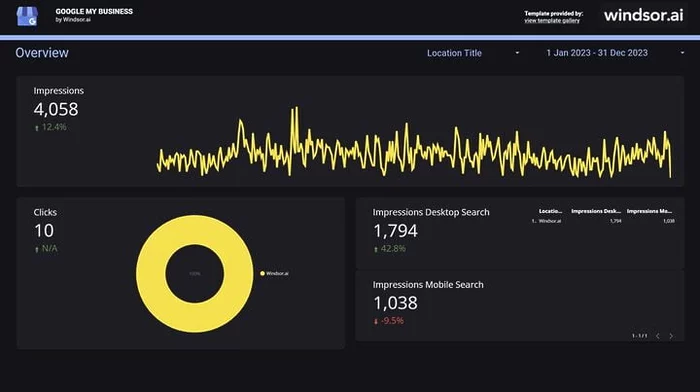
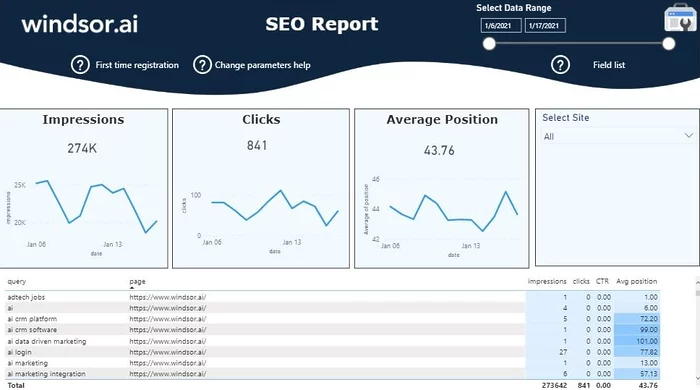
- SEO report template
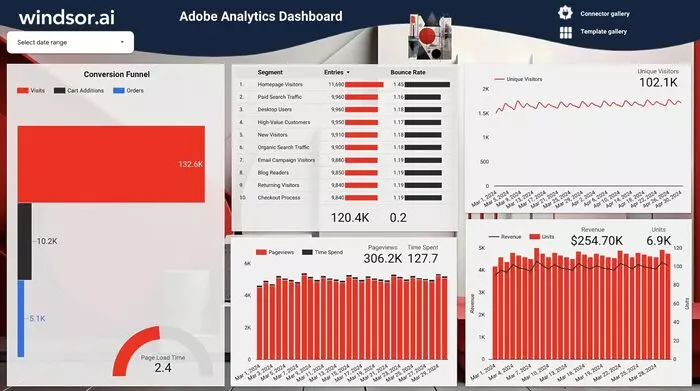
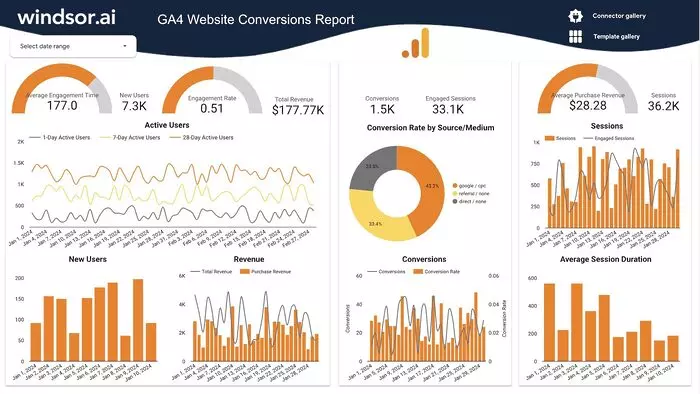
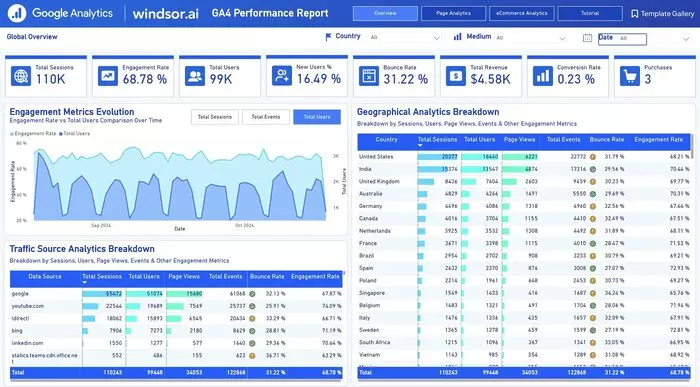
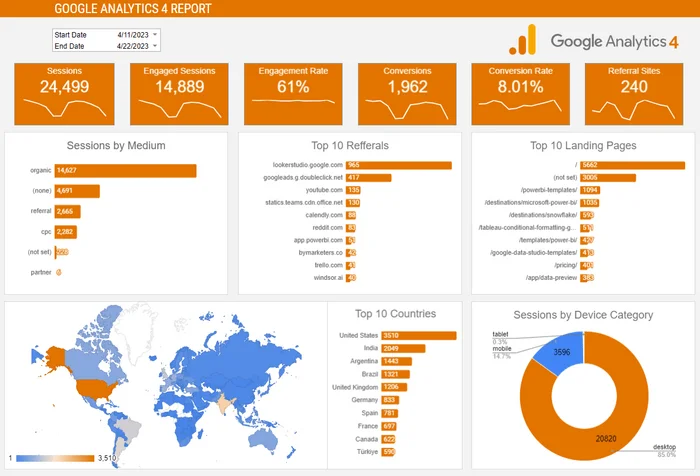
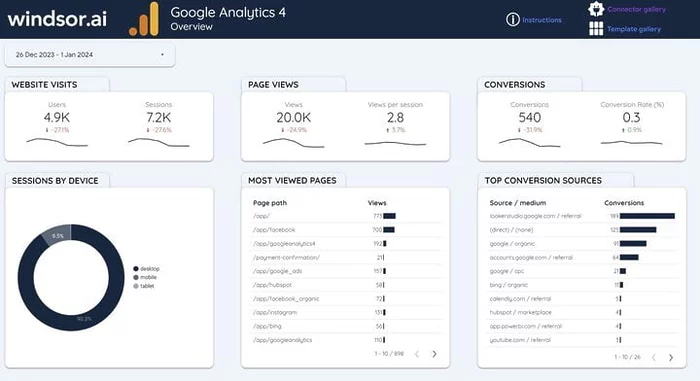
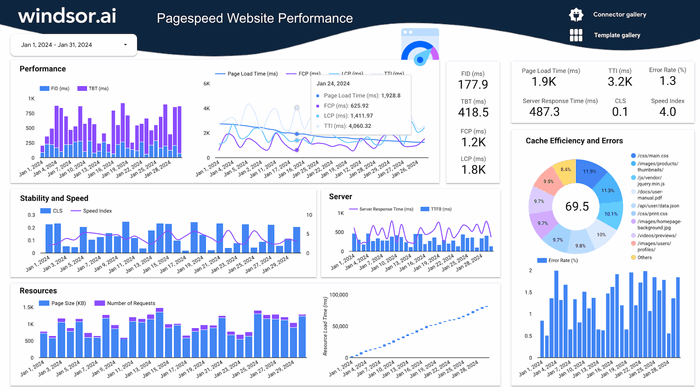
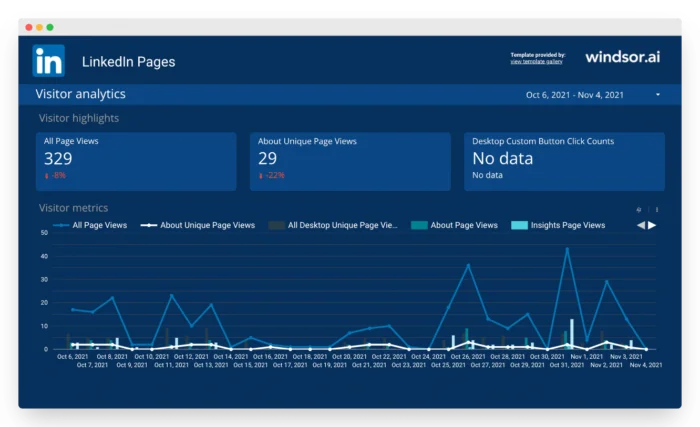
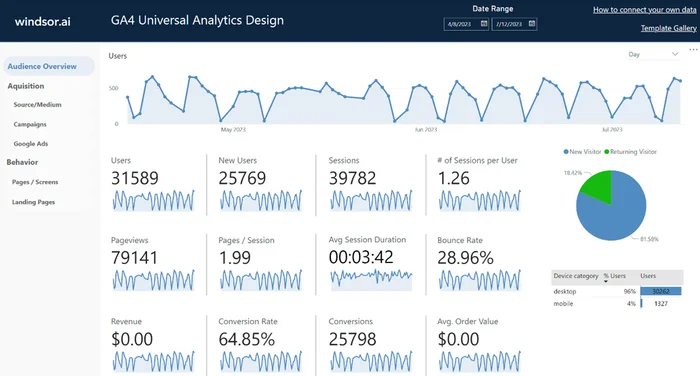
- Website Analytics report template
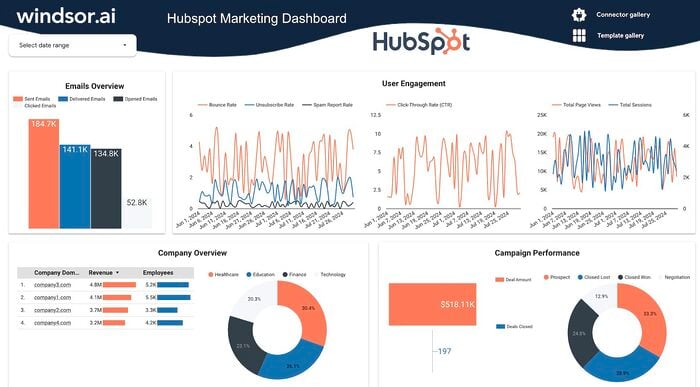
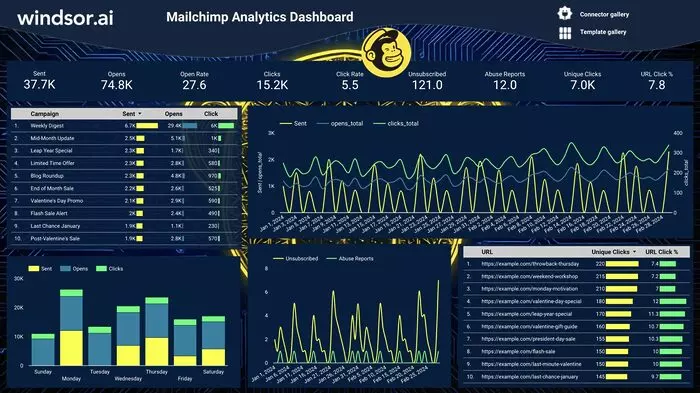
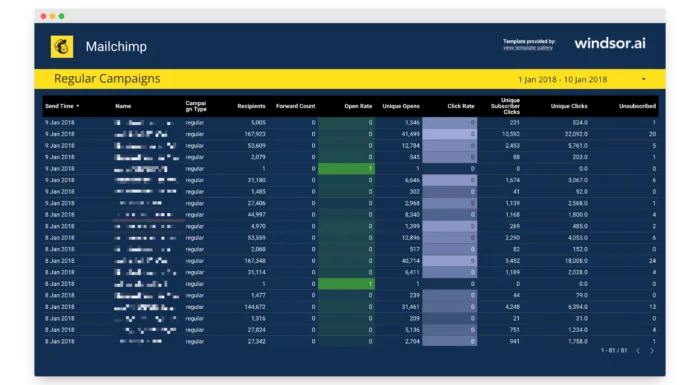
- Email Marketing report template
- Content Marketing report template
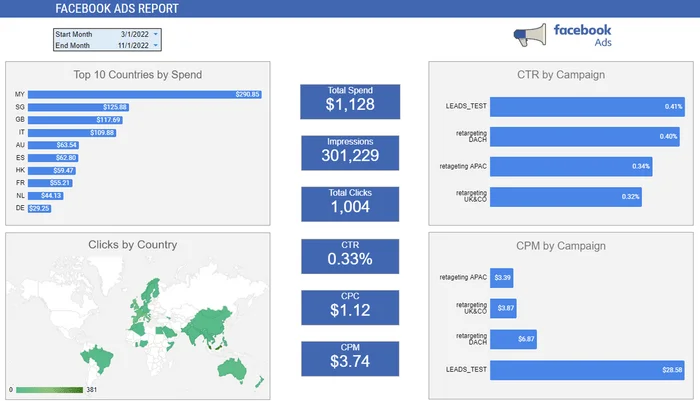
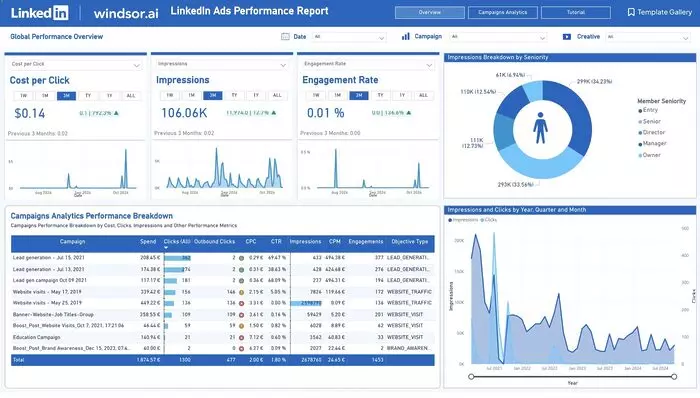
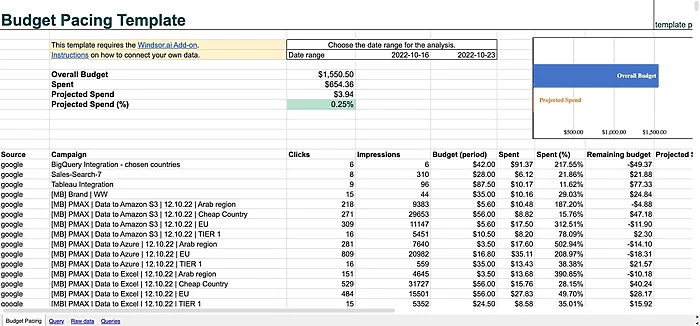
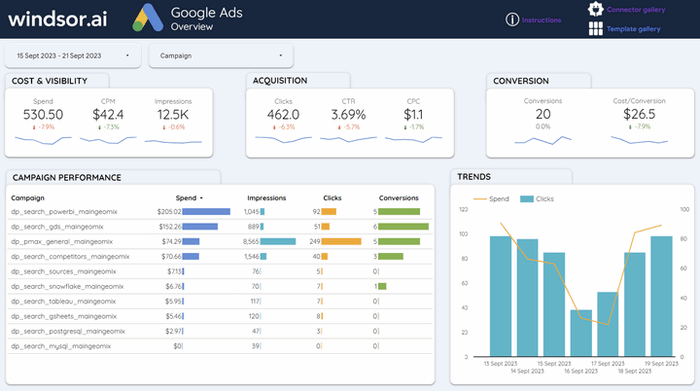
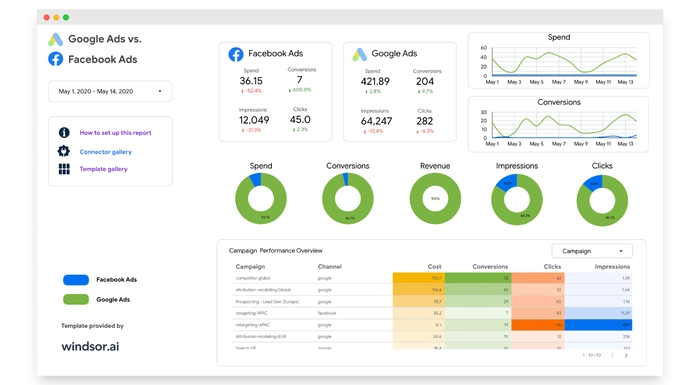
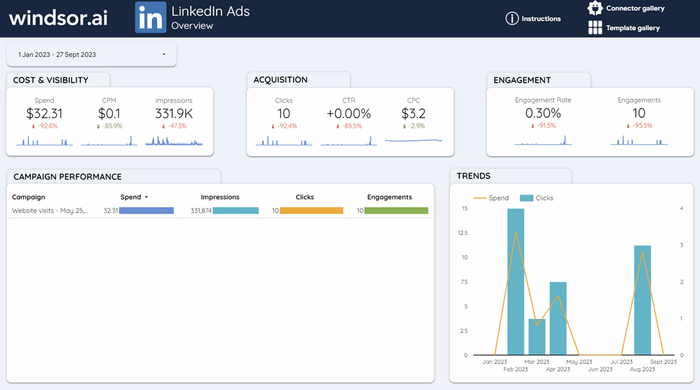
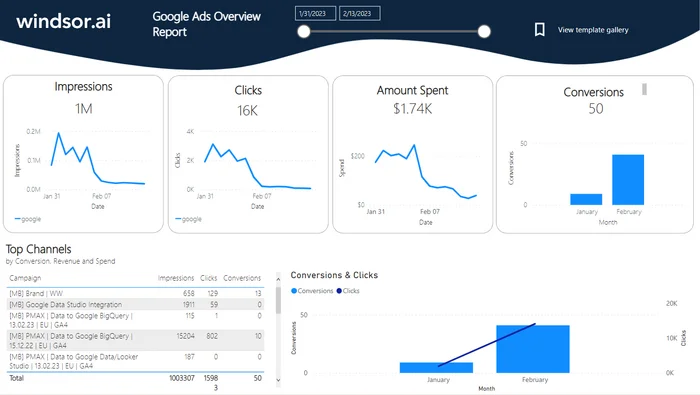
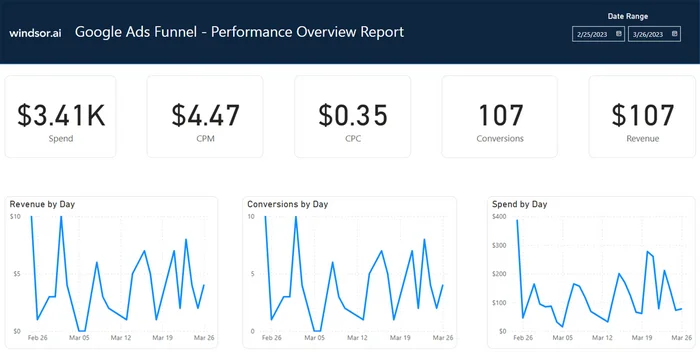
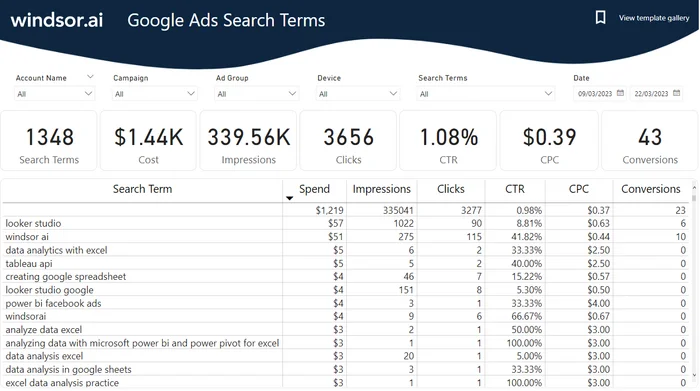
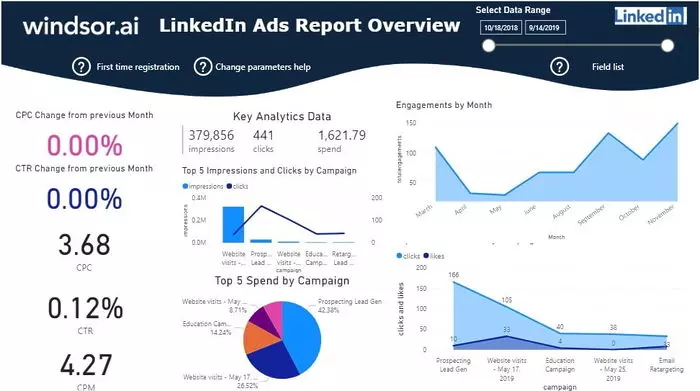
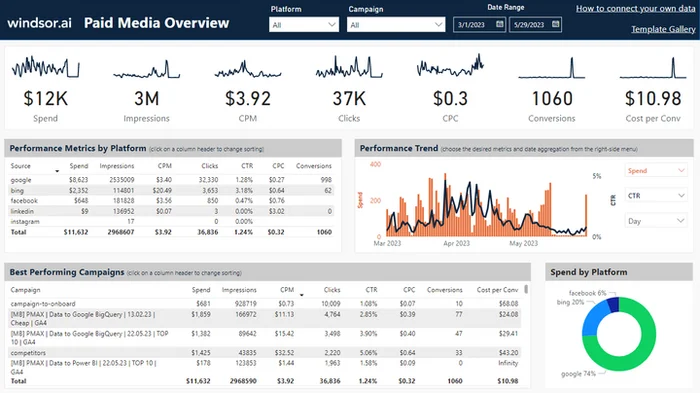
- PPC Advertising report template
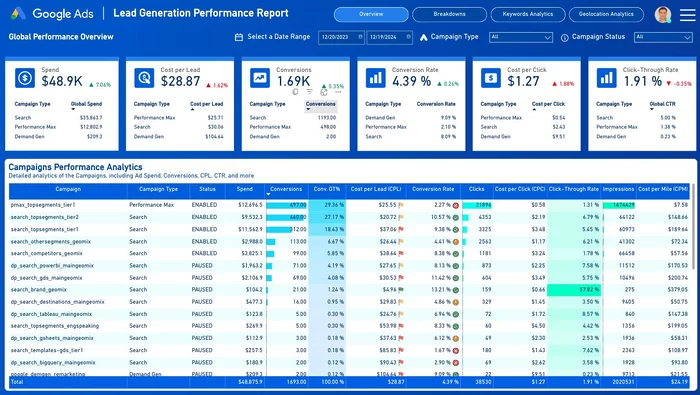
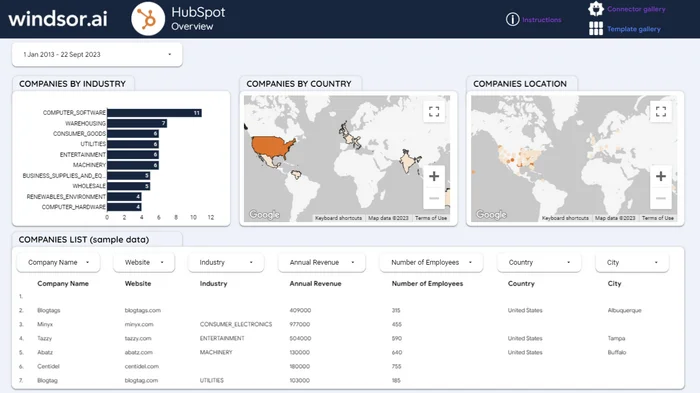
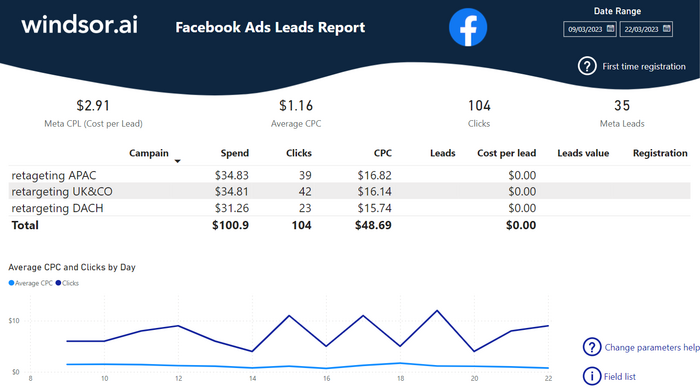
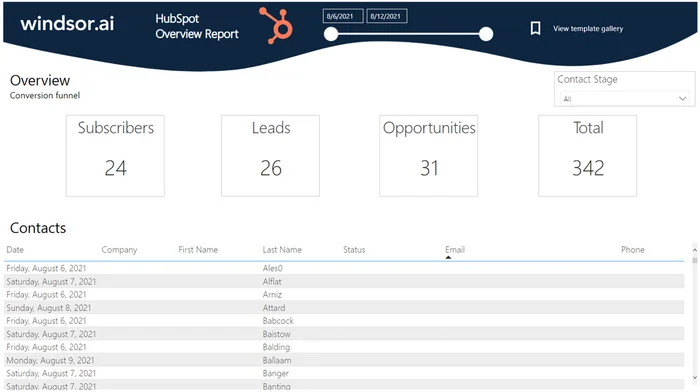
- Lead Generation report template
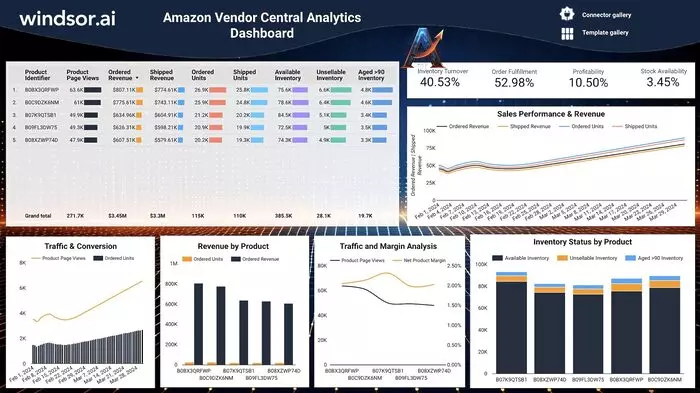
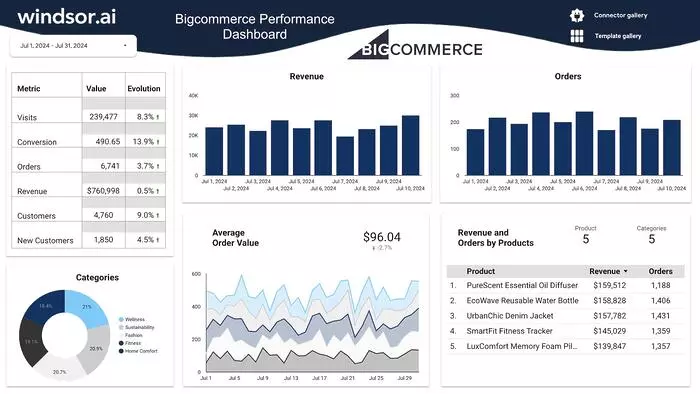
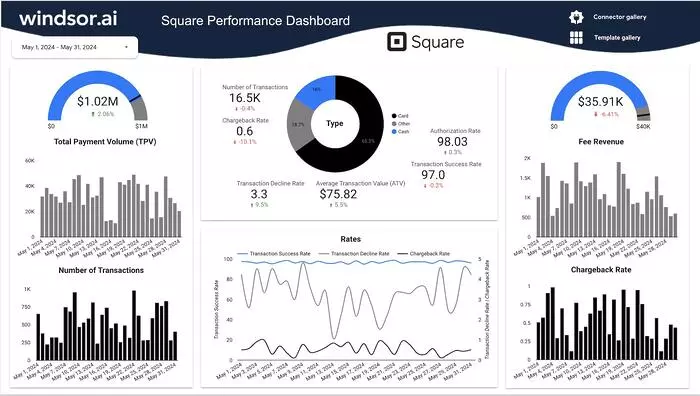
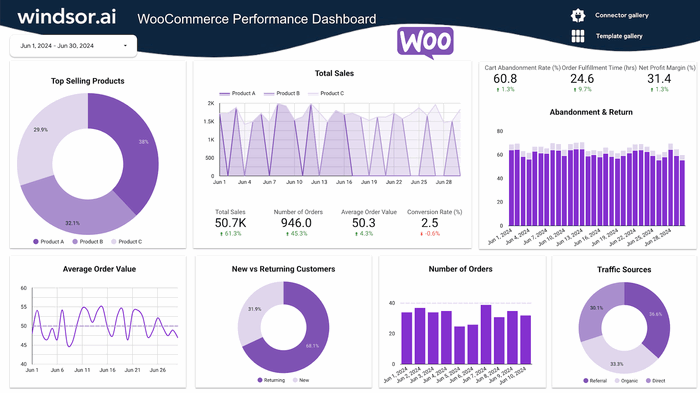
- E-Commerce report template
Start implementing KPI tracking dashboard reports today to enhance your operational effectiveness and achieve the best possible marketing results!