 AI insights
 About us
 Careers
 Security
 Customer reviews
 Contact us
 Affiliate program
 Solution partners
 Looker Studio templates
 Tableau templates
 Facebook Ads templates
 Google Ads templates
 Data fields & Metrics
 AI prompt library & Guides
 Product documentation
 API documentation
 Case studies
 Blog
Blog Data models
 Windsor vs Supermetrics
 Windsor vs Fivetran
 Windsor vs Portermetrics
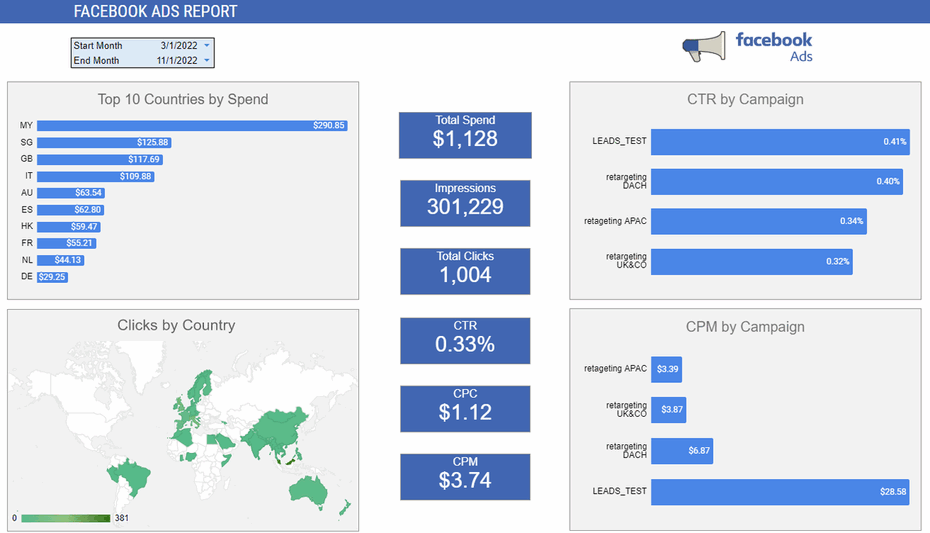
This Facebook Ads Overview Report template helps you to visualise your Facebook Ads into Google sheets in a few clicks. Dimensions and metrics visualised in this report are:
- Website Purchases
- Campaign Name
- Clicks
- Countries people are located
- CPC
- CPM
- CTR
- Date
- Impressions
- Amount SpentSource
There is a list of close to 300 metrics and dimensions available once you start customising the report. To find the full list head to Available metrics and dimensions. Even more details about the Meta / Facebook Ads metric you can find here.
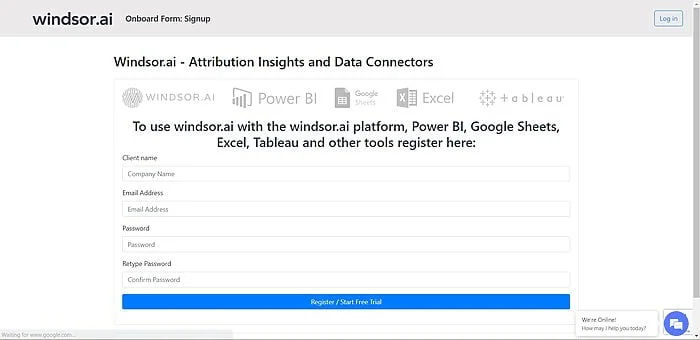
Step 1:
Login or Register on Windsor.ai
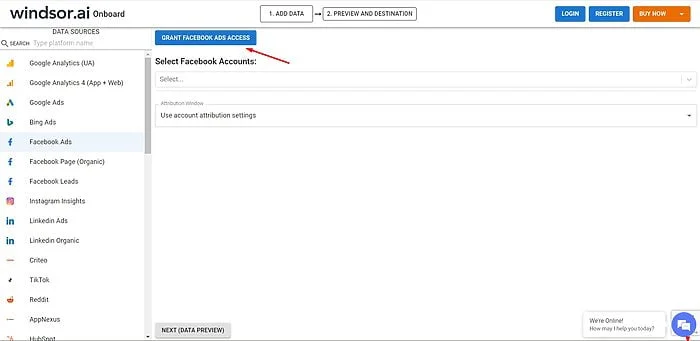
Step 2:
Grant access to your Facebook Ads Account
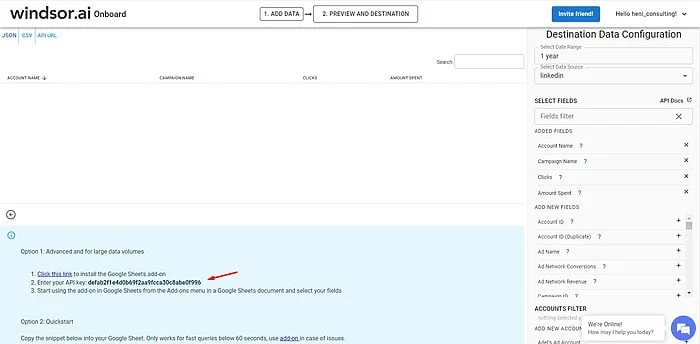
Step 3:
Click on Google sheet as show below and copy your API KEY
Step 4:
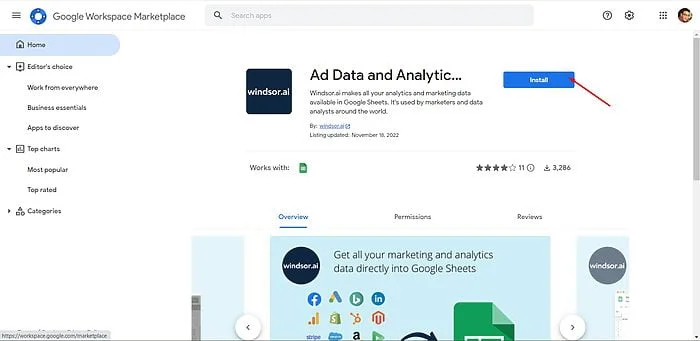
Add Windsor.ai’s Extension to Google Sheets.
Step 5:
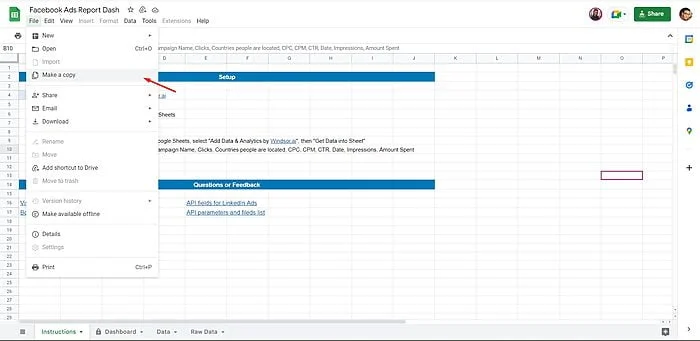
Copy The template with clicking on File -> Make a copy
Template Link : Google Sheet Facebook Ads Overview Report
Step 6:
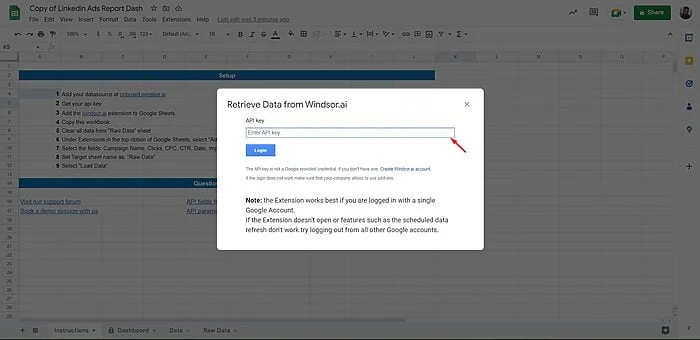
Under Extensions in the top ribbon of Google Sheets, select “Add Data & Analytics by Windsor.ai“, then “Login” and Paste your API KEY there:
Step 7:
Now under “Add Data & Analytics by Windsor.ai” extension press on Get Data into Sheets, then click on the Edit icon under the Facebook query.
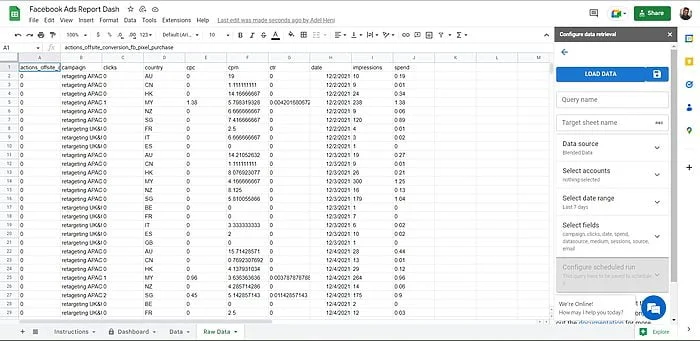
Choose the accounts you want to include and the date range. Now click on Load Data and your template should be ready.
Fields used in this Facebook Ads Google Sheets Report Template
- Campaign Name
- Country
- Clicks
- CPC
- CPM
- CTR
- Date
- Impressions
- Amount Spent
PS : Make Sure in the Target sheet Name to Write ” Raw Data”
You might also be interested in…