 Destinations
 Data sources
 AI insights
 About us
 Careers
 Security
 Customer reviews
 Contact us
 Affiliate program
 Solution partners
 Template gallery
 Looker Studio templates
 Power BI templates
 Excel templates
 Google Sheets templates
 Tableau templates
 Facebook Ads templates
 Google Ads templates
 Data fields & Metrics
 AI prompt library & Guides
 Product documentation
 API documentation
 Case studies
 Blog
 Data models
 Windsor vs Supermetrics
 Windsor vs Funnel.io
 Windsor vs Fivetran
 Windsor vs Rivery
 Windsor vs Portermetrics
 Windsor vs Coupler.io
Free CRM Dashboard Report Templates
Pick a free CRM dashboard template for Data Studio (Looker Studio), Power BI, Google Sheets, or Excel.
Most templates show HubSpot or Salesforce deals by pipeline stage, along with won and lost deals, leads, contacts, and companies. The rest report marketing data from HubSpot Marketing Hub, Salesforce Marketing Cloud, and ad platforms.
Each template comes with setup steps for connecting your CRM or ad accounts through Windsor.ai. The example below uses sample Q3 2026 deals in a demo HubSpot account.
















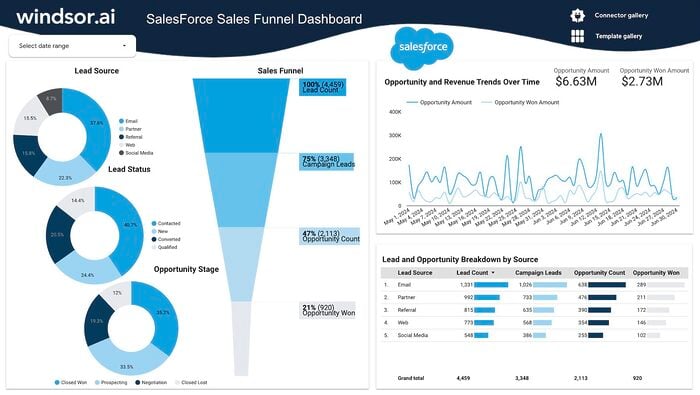
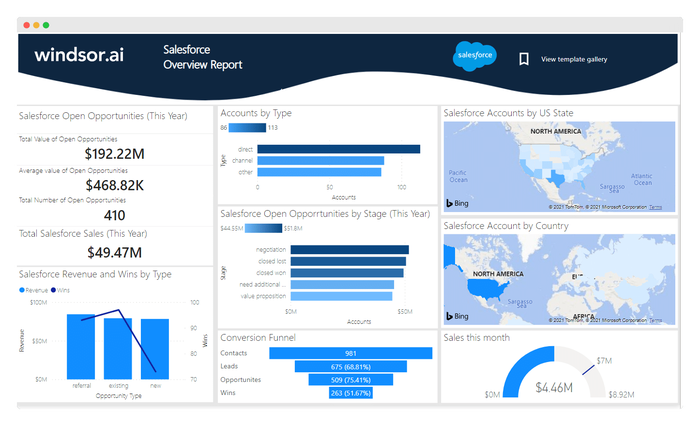

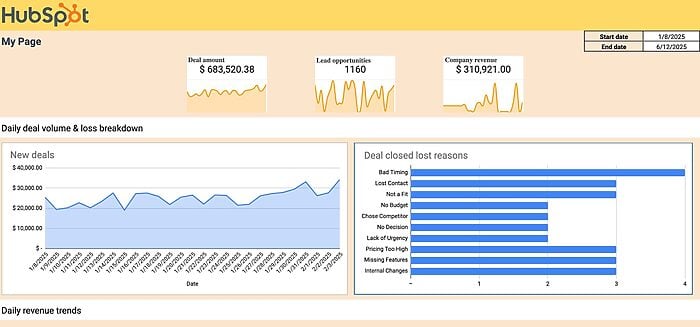
Hubspot Google Sheets Dashboard Template

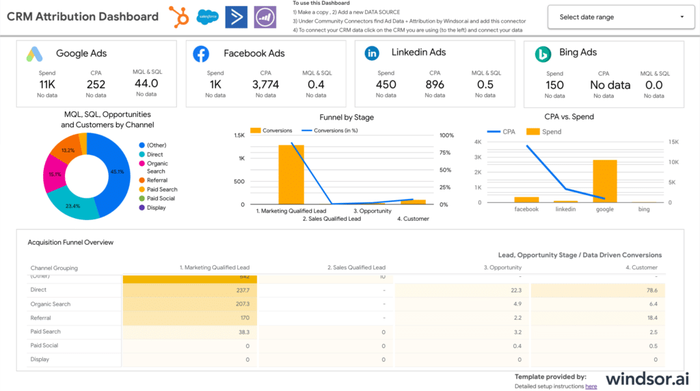
Looker Studio CRM Attribution Dashboard Template
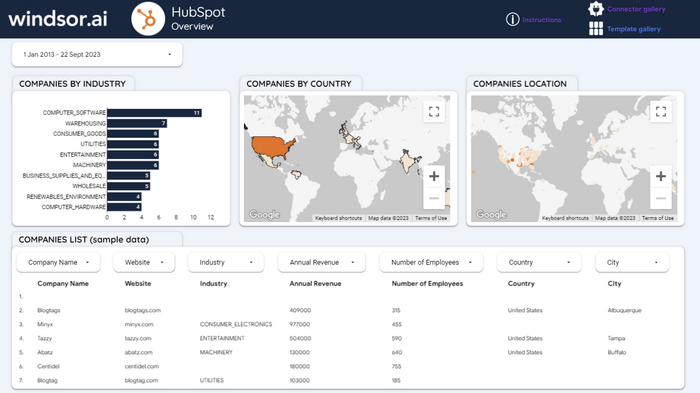
Looker Studio HubSpot Dashboard Template
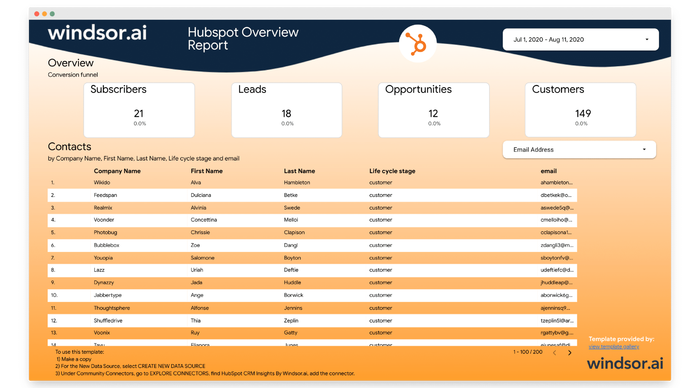
Looker Studio HubSpot Overview Report
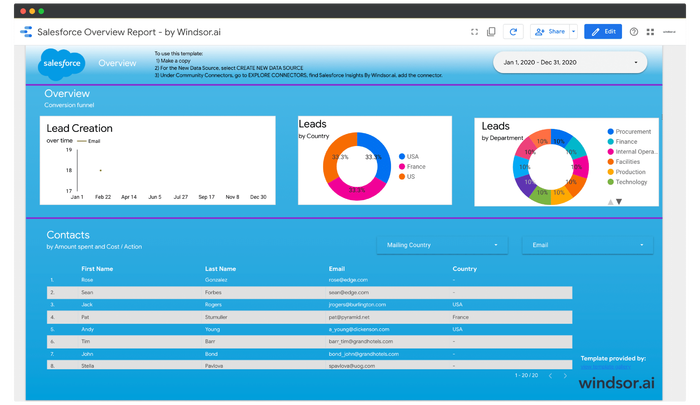
Looker Studio Salesforce Overview Report
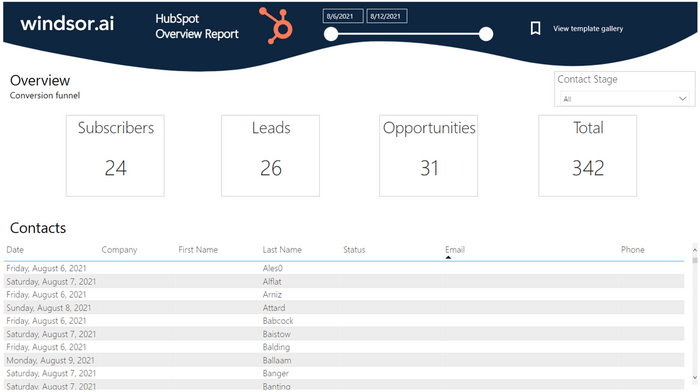
Power BI HubSpot Overview Dashboard Template
What is a CRM dashboard?
A CRM dashboard gives you an overview of your sales pipeline using data from your deals, contacts, and companies. You can see how many deals are in progress, how much they’re worth, and how many were won or lost.
The dashboard itself is a Data Studio report, a Power BI file, a Google Sheets file, or an Excel workbook. Windsor.ai pulls the data into it from HubSpot or Salesforce, with no CSV exports. Sales managers use one for the weekly pipeline review, and founders use one to check the forecast.
Which CRM template to pick
The table lists all 13 free templates in this gallery. Some template titles still say Looker Studio, Data Studio’s previous name.
| Template | Tool | Platforms | Best for | Key metrics |
|---|---|---|---|---|
| Data Studio HubSpot Dashboard | Data Studio | HubSpot | Pipeline, contacts and companies in one view | contacts, companies, leads, opportunities, customers, pipeline stage |
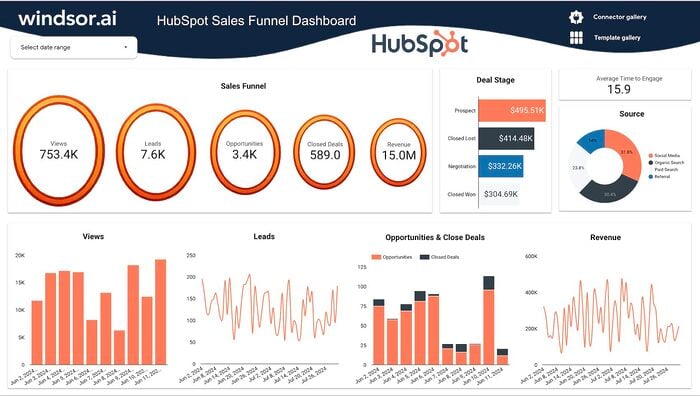
| HubSpot Sales Funnel | Data Studio | HubSpot | Prospects from first contact to closed deal | prospects per stage, closed-won deals, conversions |
| HubSpot Google Sheets | Google Sheets | HubSpot | Deals, revenue and lost reasons in a spreadsheet | deal amount, lead opportunities, company revenue, traffic sources, lost reason |
| Power BI HubSpot Overview | Power BI | HubSpot | Lifecycle counts in Power BI | subscribers, leads, opportunities |
| HubSpot Overview Report | Data Studio | HubSpot | Contact list by lifecycle stage | lifecycle stage, contacts, company name |
| Power BI Salesforce | Power BI | Salesforce | Pipeline, funnel and campaign results | opportunity amount, stage, won deals, leads, converted leads, campaign cost, expected revenue |
| Salesforce Sales Funnel | Data Studio | Salesforce | Leads to won opportunities, by lead source | leads, campaign leads, opportunities, opportunities won, opportunity amount, won amount |
| Salesforce Overview Report | Data Studio | Salesforce | Contact activity over time | contacts over time, lead source, last activity date |
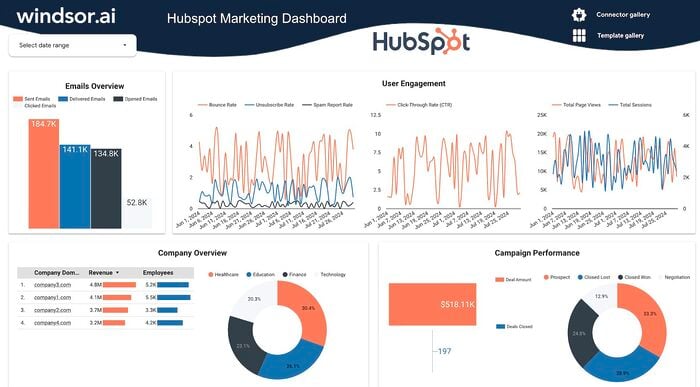
| HubSpot Marketing | Data Studio | HubSpot Marketing Hub | Email results next to web traffic and deals | emails sent, delivered, opened and clicked, CTR, bounce and unsubscribe rates, page views, sessions, deal amount by stage |
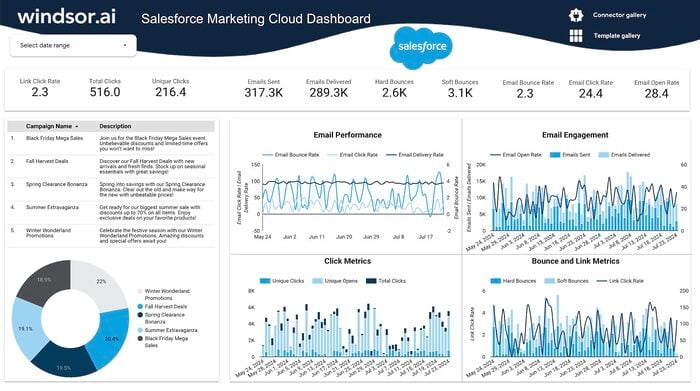
| Salesforce Marketing Cloud | Data Studio | Salesforce Marketing Cloud | Email sends, bounces and clicks by campaign | emails sent and delivered, delivery, bounce and click rates, unique opens, unique and total clicks |
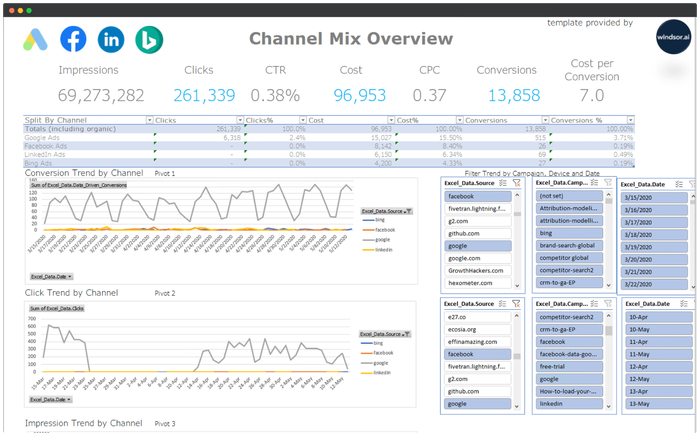
| Excel Marketing Reporting | Excel | AdRoll, Microsoft Ads, Criteo, Meta Ads, Google Ads, GA4, LinkedIn Ads, Pinterest Ads, Salesforce, Snapchat Ads, TikTok Ads, X Ads, YouTube Ads | Multi-platform reporting | spend, impressions, clicks, CTR, conversions |
| Data Studio CRM Attribution | Data Studio | Google Ads, Meta Ads, LinkedIn Ads, Microsoft Ads, plus Salesforce, HubSpot, Pipedrive, Zoho CRM, ActiveCampaign, Marketo, Microsoft Dynamics or Freshsales | Ad spend next to leads, opportunities and customers by channel | spend, conversions, revenue, MQLs, SQLs, opportunities, customers by channel |
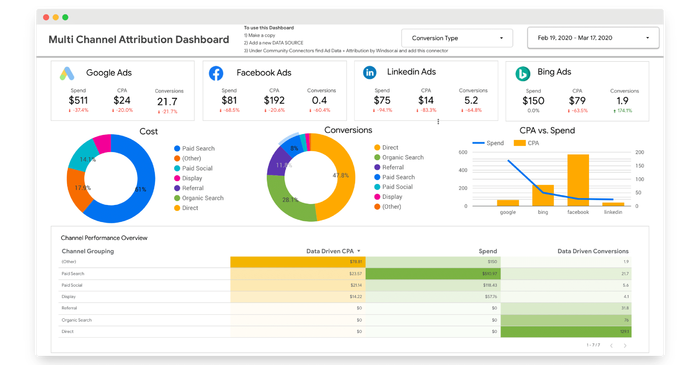
| Data Studio Multichannel Dashboard | Data Studio | Google Ads, Meta Ads, LinkedIn Ads, Microsoft Ads | Spend and conversions across four ad platforms | spend, conversions, conversions vs. spend by channel |
CRM dashboard example: A pipeline review from one quarter of HubSpot deals
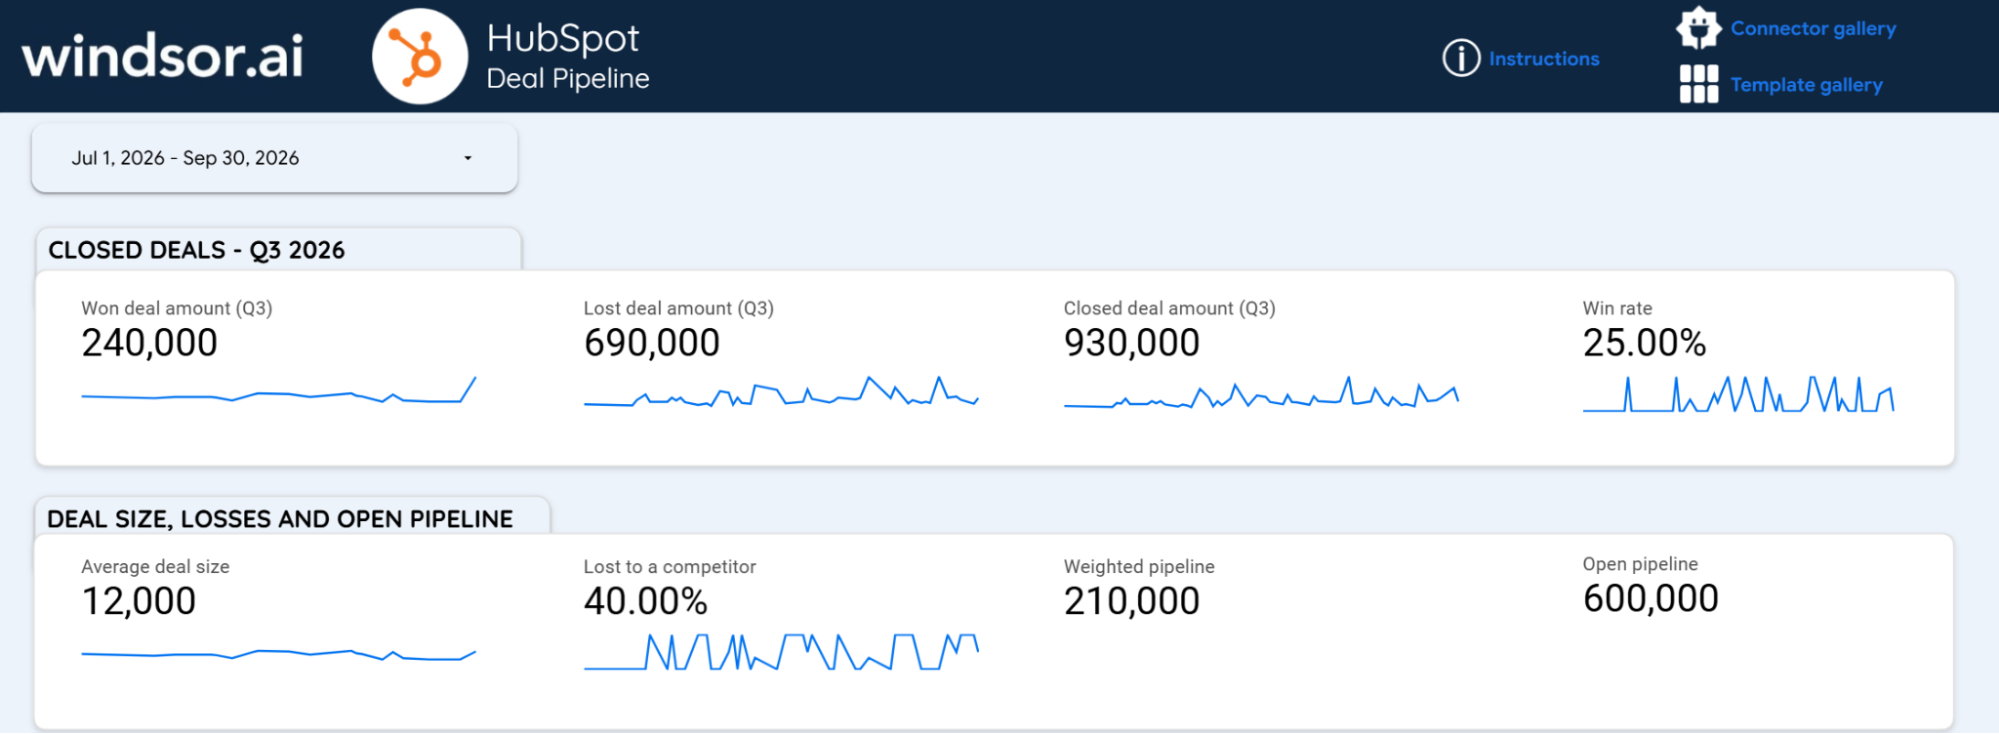
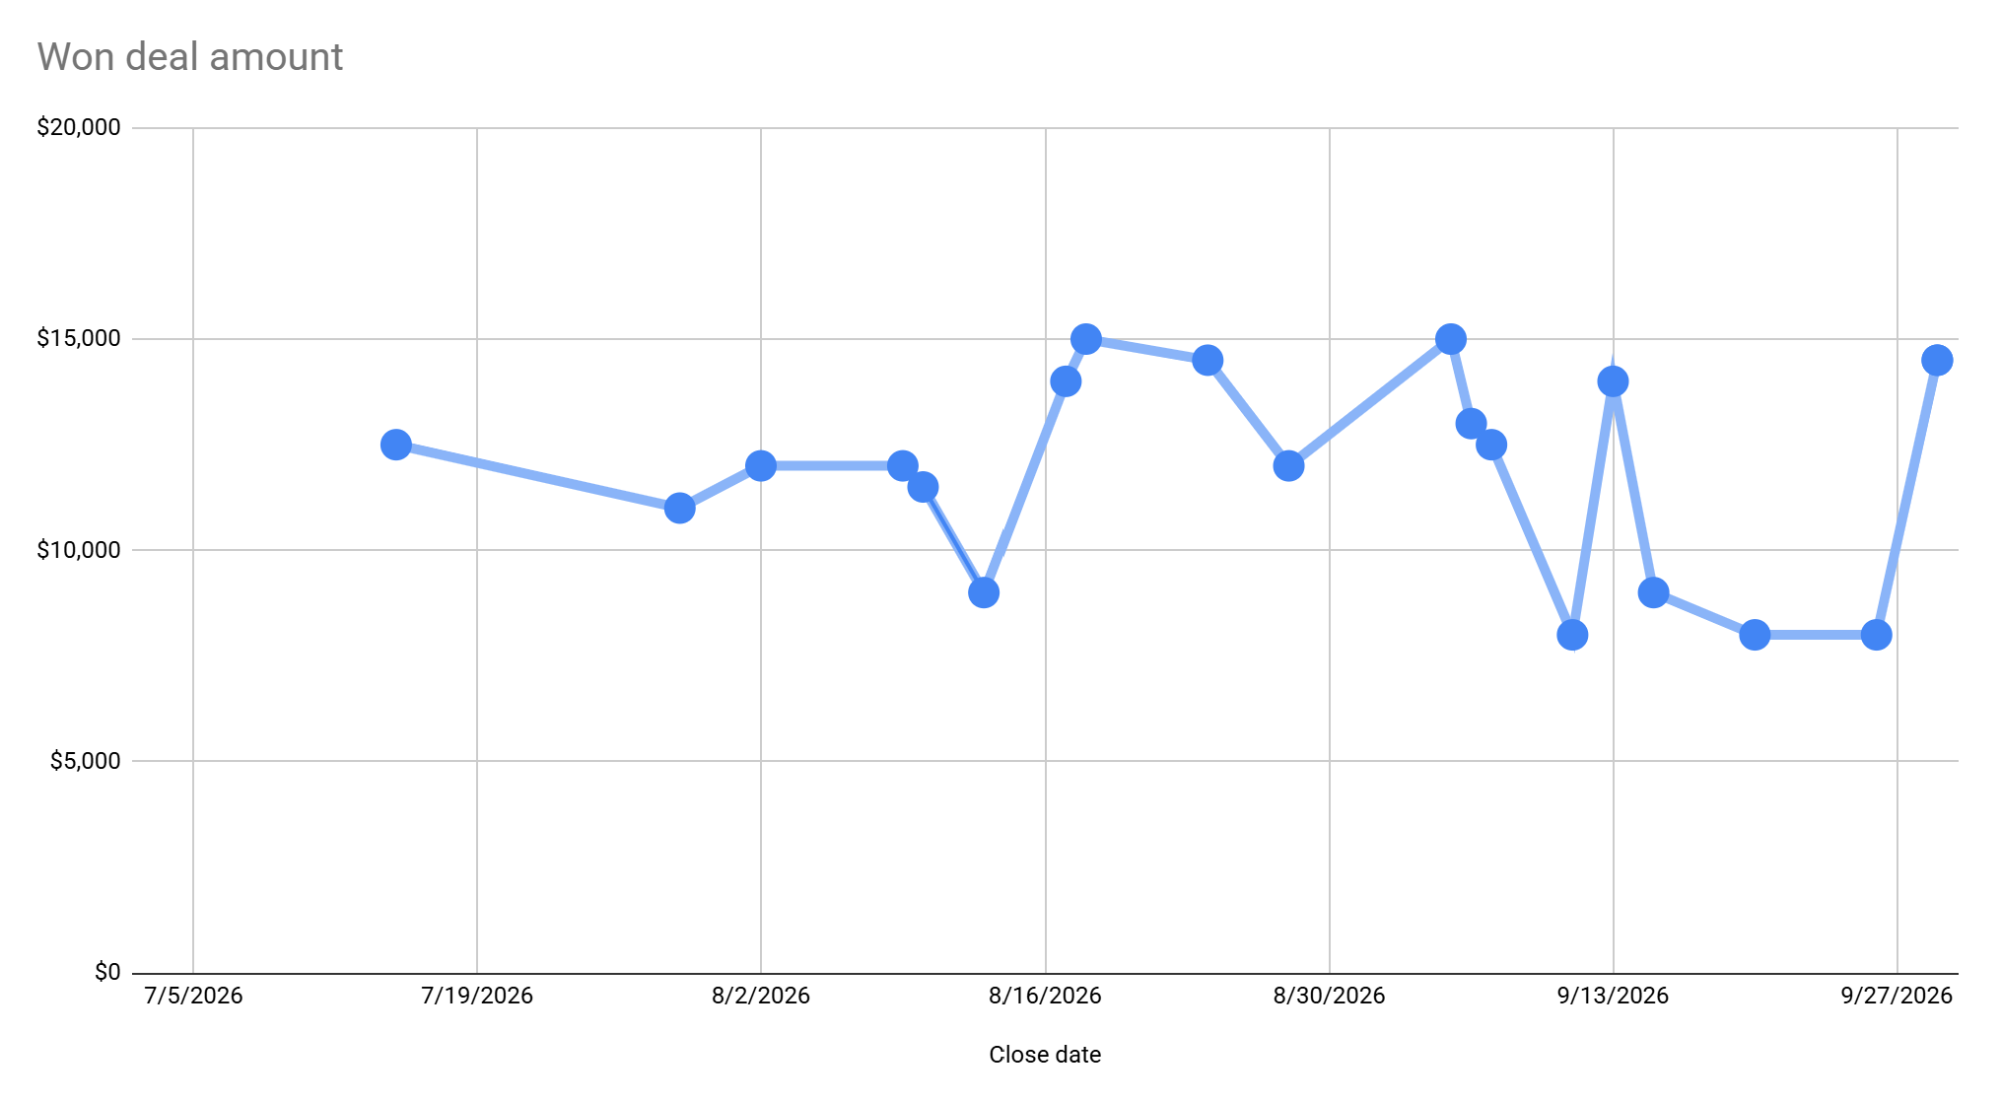
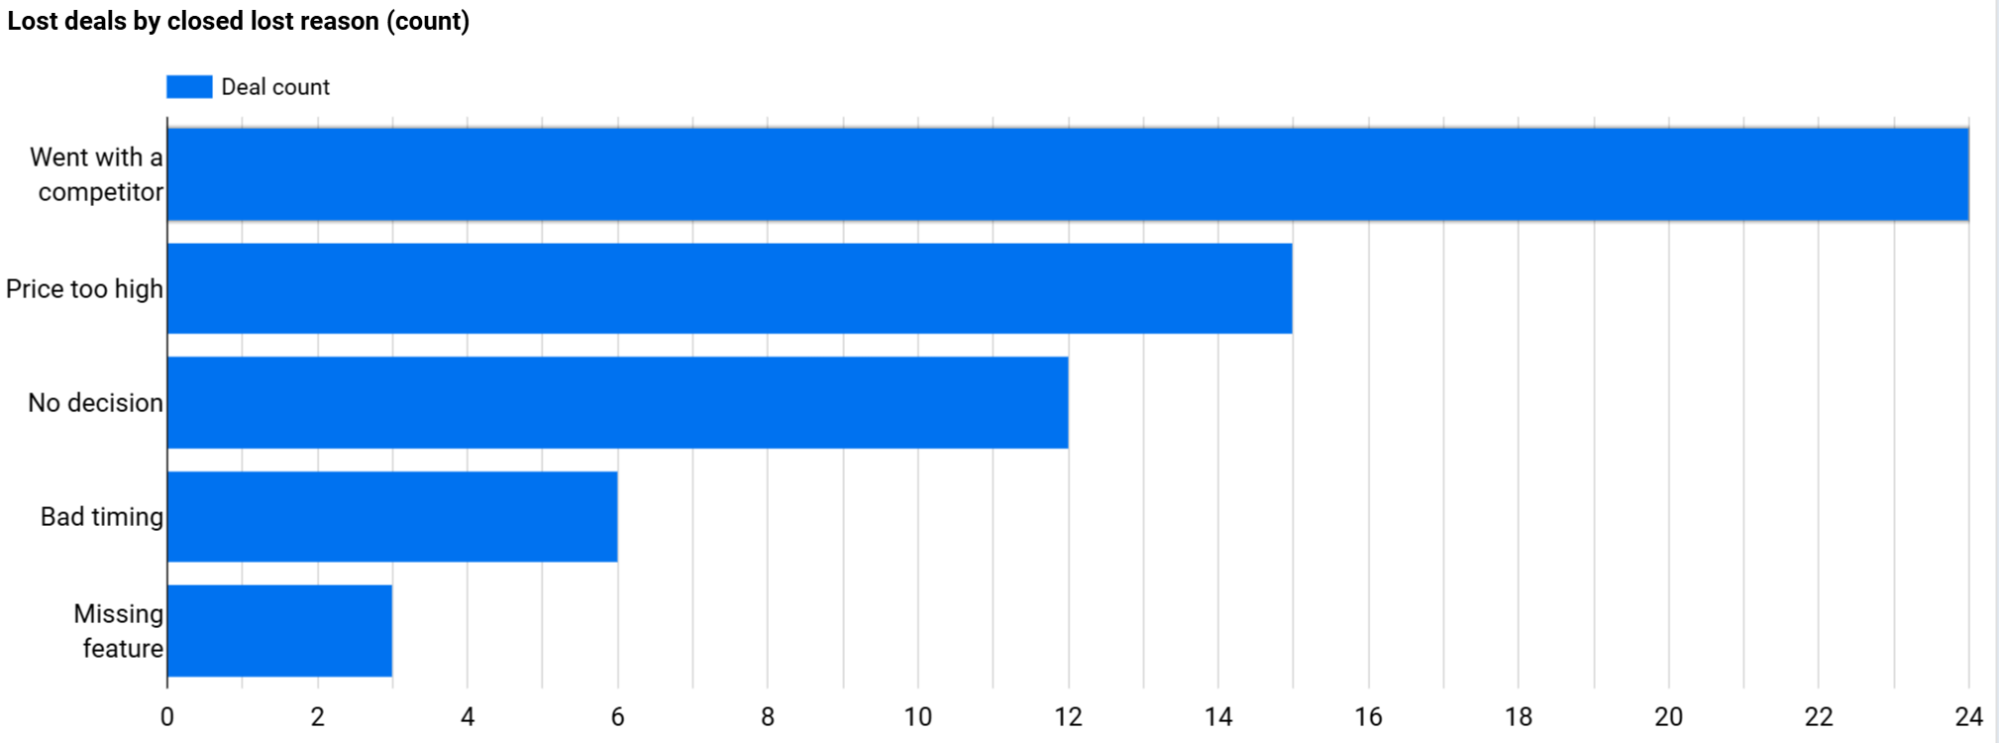
This example uses a demo HubSpot account loaded with sample deals that’s connected to Windsor.ai. The sample deals were closed in Q3 2026 (1 July to 30 September). The team won 20 of the 80 deals that closed in the quarter, and 50 deals were still open on 13 October. Every number comes from HubSpot deal fields, pulled through Windsor.ai.
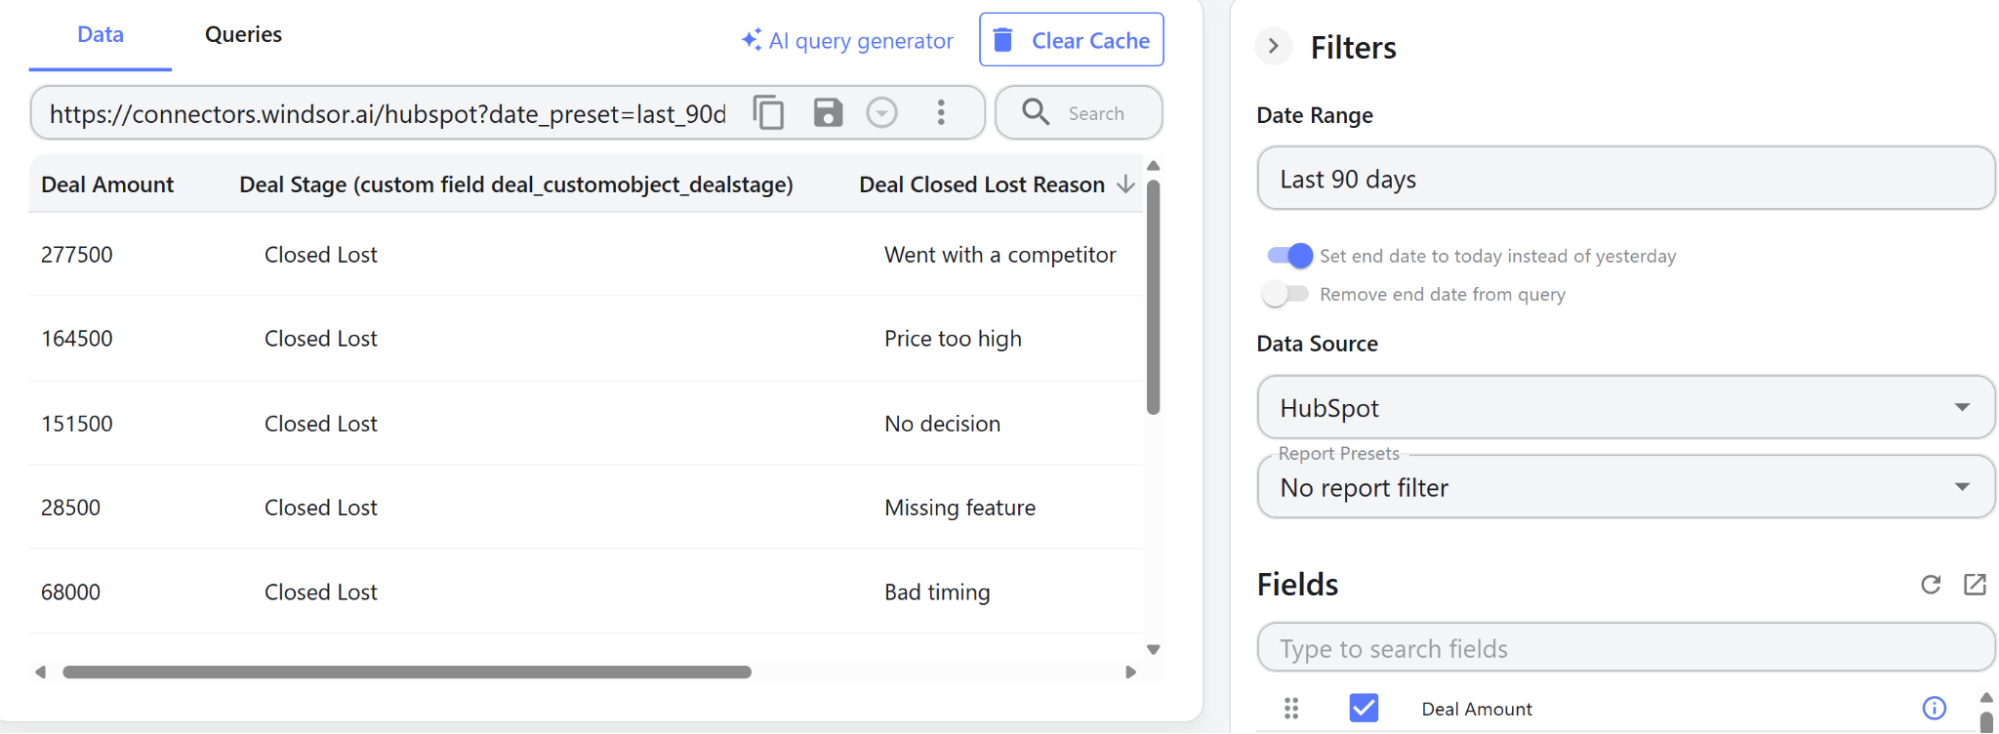
Step 1: Connect HubSpot to Windsor.ai. Sign in at onboard.windsor.ai, choose the HubSpot connector, and authorize your account.
Step 2: Query the deal fields. In the data preview, set the date range and select the fields that interest you. This example uses: Deal amount, Deal count, Deal stage, Deal Closed Lost Reason, Deal Closed Won, Deal Close Date, and Deal Projected Amount.
| Measure | HubSpot fields | Sample quarter |
|---|---|---|
| Win rate | deal_closedate, deal_hs_is_closed, deal_hs_is_closed_won | 25% of closed deals (20 of 80) |
| Average deal size | deal_amount on won deals | $12,000 ($240,000 from 20 won deals) |
| Lost to a competitor | deal_closed_lost_reason | 40% of lost deals (24 of 60) |
| Weighted pipeline | deal_hs_projected_amount on open deals | $210,000, which is 35% of the $600,000 open amount |
Use the weighted pipeline value to forecast next quarter. The full open pipeline value assumes every open deal will close. The HubSpot Google Sheets template lets you view deal amounts and lost reasons from your own account.

What KPIs does a CRM dashboard track?
Choose the KPIs that fit your sales process. Each KPI uses deal or lead fields pulled from HubSpot and Salesforce through Windsor.ai.
- Pipeline value: the total amount of all open deals.
- Weighted pipeline: each open deal’s amount multiplied by its stage probability, then added up. HubSpot returns the weighted amount for each deal as deal_hs_projected_amount; in Salesforce, multiply opportunity_amount by opportunity_probability, which is a percentage.
- Win rate: deals won divided by all closed deals, won and lost.
- Lead conversion rate: leads that became opportunities divided by all new leads in the same period.
- Average deal size: revenue from won deals divided by the number of won deals.
- Sales cycle length: the average number of days from a deal’s creation to its close, for won deals. HubSpot returns the days for each deal as deal_days_to_close.
- Lost deals by reason: each lost reason’s share of all lost deals. HubSpot stores the reason in deal_closed_lost_reason. Windsor.ai’s standard Salesforce fields include no loss reason. If your team records one in a custom field, Windsor.ai can pull it.
What to include in a CRM report?
A CRM report shows how your sales pipeline is performing, from open deals and their value to closed deals and new leads. You can compare results with past periods or sales targets.
Split the data by six fields.
- pipeline and deal stage
- deal owner
- lead source (for example, paid search, organic search, or referral)
- lifecycle stage (lead, opportunity, customer)
- lost reason
- date (created date or close date, by week or month)
For example, a weekly report for a head of sales could show pipeline value and weighted pipeline against the quarter’s target at the top. Open deals by stage and owner go in the middle, with win rate and lost reasons for the last 90 days at the bottom. Label each chart with its date field. Count new deals by created date, and won or lost deals by close date.
Browse the full template gallery for dashboards by platform and destination, or see the sales dashboard templates for revenue reporting. How to use Windsor.ai for CRM shows how to ask an AI assistant which campaigns and lead sources bring closed deals.
FAQs
Which CRMs does Windsor.ai connect to?
Windsor.ai connects to 350+ data sources, including HubSpot, Salesforce, Pipedrive, Zoho CRM, and GoHighLevel. The templates on this page use HubSpot and Salesforce, but you can send data from other CRMs to Data Studio, Power BI, Google Sheets, or Excel in the same way.
Can I put CRM deals and ad spend in one dashboard?
Yes. Connect HubSpot or Salesforce and your ad accounts to Windsor.ai, then build one report that shows ad spend next to the leads and deals from each source. The CRM attribution and the Excel marketing templates in the table already combine Salesforce with the ad platforms.
What is the CRM deal dashboard?
A CRM deal dashboard gives you an overview of your sales pipeline and deal outcomes. It shows open deals by stage and value, deals won and lost during a period, and the reasons behind lost deals. In HubSpot, these metrics come from fields such as deal stage, amount, close date, and closed lost reason. Salesforce stores the equivalent data on opportunities. Windsor.ai brings these fields into a ready-to-use template for Data Studio, Power BI, Google Sheets, or Excel. Try the HubSpot Google Sheets template to view deal amounts and lost reasons from your own account.
Where are my Windsor.ai dashboards stored?
Your dashboards live in your chosen reporting tool, not in Windsor.ai. You can access them through Data Studio, Power BI, Google Sheets, or Excel.
Can a client connect their own HubSpot account?
Yes. Send the client an Authorize via Link URL from your Windsor.ai account settings. The client signs in to HubSpot and picks the accounts to share, without creating a Windsor.ai account or sharing a password. The connection then appears under Data Sources in your account, ready for the templates on this page.
Can I report on custom objects and custom fields?
Yes. Windsor.ai pulls standard and custom objects from HubSpot and Salesforce, including custom fields. Once you connect your account, custom fields appear in the field list. The public HubSpot field reference lists standard fields only.
Can I keep contact details out of the dashboard?
Yes. Choose which fields to include in each report. A pipeline dashboard only needs deal fields such as stage, amount and close date. You can exclude contact names and email addresses.
Tired of juggling fragmented data? Get started with Windsor.ai today to create a single source of truth


