 Destinations
 Data sources
 AI insights
 About us
 Careers
 Security
 Customer reviews
 Contact us
 Affiliate program
 Solution partners
 Template gallery
 Looker Studio templates
 Power BI templates
 Excel templates
 Google Sheets templates
 Tableau templates
 Facebook Ads templates
 Google Ads templates
 Data fields & Metrics
 AI prompt library & Guides
 Product documentation
 API documentation
 Case studies
 Blog
 Data models
 Windsor vs Supermetrics
 Windsor vs Funnel.io
 Windsor vs Fivetran
 Windsor vs Rivery
 Windsor vs Portermetrics
 Windsor vs Coupler.io
Free Keyword Ranking Dashboard and Rank Tracker Report Template (Data Studio)
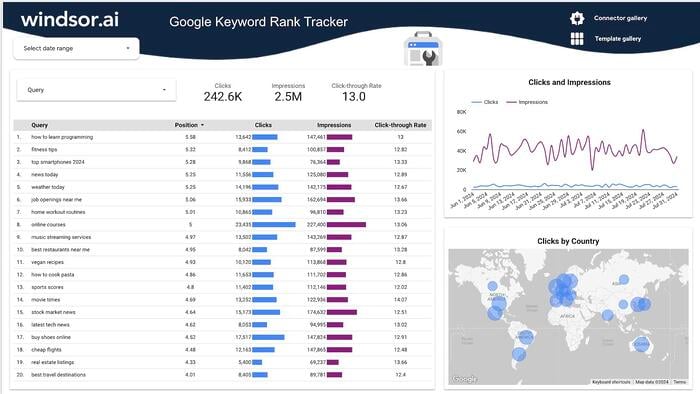
Get a free keyword ranking dashboard template for Data Studio, built on your Google Search Console data.
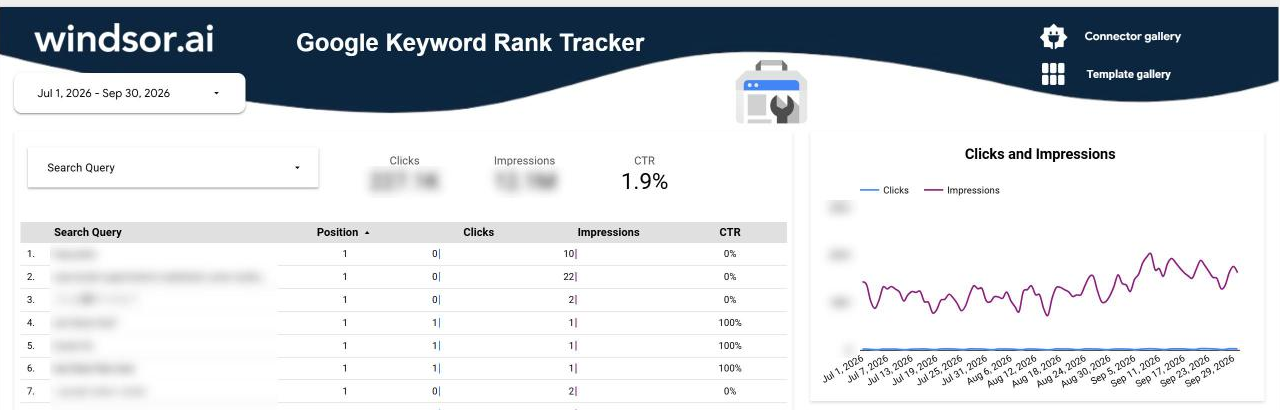
The dashboard lists the queries your site appears for, with their average position, clicks, impressions, and CTR, and charts clicks and impressions by day.
The template comes with setup steps for connecting your Search Console property through Windsor.ai.


What is a keyword ranking dashboard?
A keyword ranking dashboard helps you track where your pages appear in Google search results for each query. Compare positions across date ranges and view them alongside impressions, clicks, and CTR to understand how rankings affect traffic. SEO teams and agencies use these insights to measure progress and identify queries that are close to the first page.
The template uses data from Google Search Console, which reports the average position of your topmost result across all searches, devices, and countries. With Windsor.ai, you can bring Search Console data into Data Studio, Google Sheets, or Excel.
Explore the keyword ranking template
This gallery has one template. The template page still uses the old name, Looker Studio. Google renamed Looker Studio back to Data Studio in April 2026.
| Template | Tool | Platforms | Best for | Key metrics |
|---|---|---|---|---|
| Google Keyword Rank Tracking Dashboard | Data Studio | Search Console | Query positions with clicks and CTR, by date range | query, average position, clicks, impressions, CTR, clicks and impressions by day, clicks by country |
For Search Console reports in Google Sheets, Power BI or Tableau, see the Google Search Console dashboard templates.
Keyword ranking dashboard example: Windsor.ai’s queries by position bucket
This example groups windsor.ai’s Search Console queries by average position for the third quarter of 2026 (1 July to 30 September), then compares two four-week windows to see which queries moved onto the first page. Brand queries (those containing “windsor” or a misspelling of it) are left out, because they brought 82% of the clicks on queries Search Console reports by name and would dominate the click shares in the table. A query counts as brand when it matches the regular expression “w[iy]n?d?s[oe]?r|winsdor|widsor|windosr|windor|wndsor”, which catches “windsor” and misspellings such as “winsor” and “windosr”.
Step 1: Connect Search Console. Sign in at onboard.windsor.ai, choose the Search Console connector, and select your property.
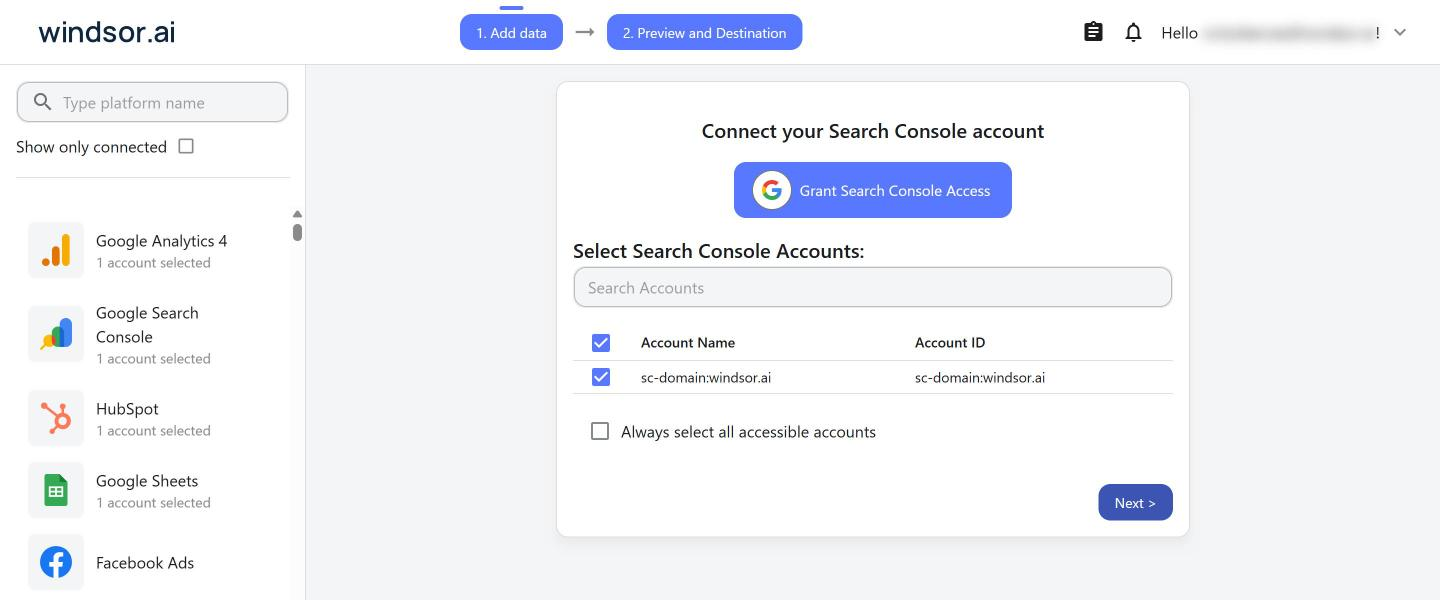
Step 2: Copy the template. Open the Google Keyword Rank Tracking Dashboard and choose File > Make a copy. Create a data source with the Windsor.ai connector for Search Console, select your property, and click Add to report. The copy then shows your own queries, positions, clicks and impressions.
Step 3: Pull query-level data for the periods you compare. Pull one row per query for the whole period into Google Sheets or Excel, so each query has one average position. Pull the same fields for each period you want to compare.
| Source | Windsor.ai fields | Date range | Used for |
|---|---|---|---|
| Search Console | query, impressions, clicks, position | 1 July to 30 September 2026 | Share of queries, impressions and clicks by position bucket |
| Search Console | query, impressions, clicks, position | 1 to 28 July 2026, and 3 to 30 September 2026 | Queries that moved between buckets |
Search Console leaves rare queries out of query-level data to protect user privacy. The shares below cover the queries it reports, which brought 58% of windsor.ai’s impressions in the period.
Step 4: Group queries by position. In the spreadsheet, add a bucket column next to the position (column D, if you pull query, impressions, clicks and position in that order): =IFS(D2<=3,"1 to 3",D2<=10,"4 to 10",D2<=20,"11 to 20",D2<=50,"21 to 50",TRUE,"51+"). Then divide each bucket’s queries, impressions and clicks by the totals.
| Average position | Share of queries | Share of impressions | Share of clicks | CTR |
|---|---|---|---|---|
| 1 to 3 | 12.1% | 4.0% | 36.6% | 5.51% |
| 4 to 10 | 43.8% | 53.8% | 53.7% | 0.59% |
| 11 to 20 | 19.0% | 21.0% | 8.3% | 0.24% |
| 21 to 50 | 20.0% | 18.2% | 1.2% | 0.04% |
| 51+ | 5.1% | 3.0% | 0.3% | 0.05% |
Queries in the top 3 brought 4.0% of windsor.ai’s non-brand impressions and 36.6% of its non-brand clicks. Queries on the second page (positions 11 to 20) brought 21.0% of non-brand impressions and 8.3% of non-brand clicks.
Step 5: Compare two periods. Match queries across both periods, keep those with at least 50 impressions in each, and count how many moved to a different position bucket.
| Average position | Share of queries, 1 to 28 Jul | Share of queries, 3 to 30 Sep |
|---|---|---|
| 1 to 3 | 4.3% | 4.4% |
| 4 to 10 | 28.9% | 33.3% |
| 11 to 20 | 26.6% | 31.3% |
| 21 to 50 | 37.1% | 28.2% |
| 51+ | 3.0% | 2.8% |
Between the two windows, 7.4% of these queries moved into the top 10 and 3.0% dropped out of it. Of the queries on the second page in July, 23% were in the top 10 by September. Almost a third of the queries at positions 21 to 50 moved up to the second page.
The numbers show that the 12.1% of non-brand queries in the top 3 brought 36.6% of non-brand clicks, and that the second page brought a fifth of impressions but few clicks. The Google Keyword Rank Tracking Dashboard lists the same queries with their average position, clicks, impressions and CTR for the date range you pick, and the split by position bucket comes from the spreadsheet in step 4.
What KPIs does a keyword ranking dashboard track?
Search Console reports position, clicks, impressions and CTR per query. Calculate the shares and changes in the dashboard or a spreadsheet.
- Average position: the position of your topmost result, averaged over every impression in the period. Lower is better, and 1 to 10 is the first page.
- Share of queries in the top 10: queries with an average position of 10 or better, divided by all queries you track.
- Impressions share by position bucket: impressions from queries in a bucket (1 to 3, 4 to 10, 11 to 20, 21 to 50, 51+), divided by all impressions.
- CTR by position bucket: clicks divided by impressions for the queries in each bucket.
- Position change: this period’s average position minus the previous period’s, per query. A negative number means the query moved up.
- Queries moved into the top 10: queries with an average position worse than 10 in the previous period and 10 or better in this one, divided by the queries tracked in both periods.
- Non-brand click share: clicks from queries without your brand name, divided by all clicks on reported queries.
What to include in a keyword ranking report
A keyword ranking report shows which queries moved up or down, how many reached the first page, and whether the moves brought clicks.
Split the data by query, page, device and country, and keep brand and non-brand queries apart. Compare the same length of period each time, such as four weeks against an earlier four weeks.
For example, a monthly report for an agency client could open with the share of non-brand queries in the top 10 and the non-brand clicks, each with its change against the previous month. Below them, add a table of the queries that moved into or out of the top 10, with clicks and impressions for each. At the bottom, show position and clicks by country and by device, since the headline average position mixes all countries and devices.
Browse the full template gallery, or see the Google Search Console dashboard templates for more reports built on Search Console. The complete guide to Search Console reporting covers the other reports you can build from the same data, and the Search Console to Data Studio connector page has the connection steps.
FAQs
Is Search Console's average position the same as a rank checker's position?
No. A rank checker records the position for one search from one location and device at one time. Search Console averages the position of your topmost result over every impression in the date range, across all countries and devices, according to Google’s metric definitions. A query at position 3 one day and 9 the next can show an average near 6.
Can I track keyword rankings by city?
No, not with Search Console data. Search Console splits position by country and device, not by city, according to Google’s Performance report help. For city-level positions, you need data from a tool that checks rankings from set locations.
Can I get the keyword ranking report by email?
Yes. In Data Studio, you can have the report emailed as a PDF on a schedule, such as every Monday.
Can I track keyword rankings in Google Sheets or Excel?
Yes. The template on this page runs in Data Studio, but Windsor.ai also sends Search Console data to Google Sheets and Excel. Pull query, position, clicks and impressions, and add a bucket column like the one in the example above. There’s also a free Search Console template for Google Sheets.
Can I add ranking data from an SEO tool such as Ahrefs?
Yes, through Windsor.ai’s Ahrefs connector. The Ahrefs connector page lists keyword fields such as best position, search volume and keyword difficulty, which you can pull into Data Studio next to your Search Console clicks and impressions.
Turn your data into a strategic asset. Get instant insights across all your platforms with Windsor.ai


