 Destinations
 Data sources
 AI insights
 About us
 Careers
 Security
 Customer reviews
 Contact us
 Affiliate program
 Solution partners
 Template gallery
 Looker Studio templates
 Power BI templates
 Excel templates
 Google Sheets templates
 Tableau templates
 Facebook Ads templates
 Google Ads templates
 Data fields & Metrics
 AI prompt library & Guides
 Product documentation
 API documentation
 Case studies
 Blog
Blog Data models
 Windsor vs Supermetrics
 Windsor vs Funnel.io
 Windsor vs Fivetran
 Windsor vs Rivery
 Windsor vs Portermetrics
 Windsor vs Coupler.io
Google Search Console Google Sheets Template


A free Google Sheets dashboard for Search Console: totals for clicks, impressions, CTR and average position, a daily chart, the top 20 queries and maps by country. The Windsor.ai add-on loads your data into it and can refresh it on a schedule.
The template opens with sample data for a fictional site, so every chart is filled before you connect anything.
How to use the template
You need:
- Access to a Search Console property
- A Windsor.ai account (free forever plan, no credit card)
- The Windsor.ai add-on for Google Sheets
Connect Search Console to Windsor.ai
Sign in to Windsor.ai, connect your Google account and select your Search Console property. Domain properties appear as sc-domain:example.com and cover every subdomain.

Copy your API key
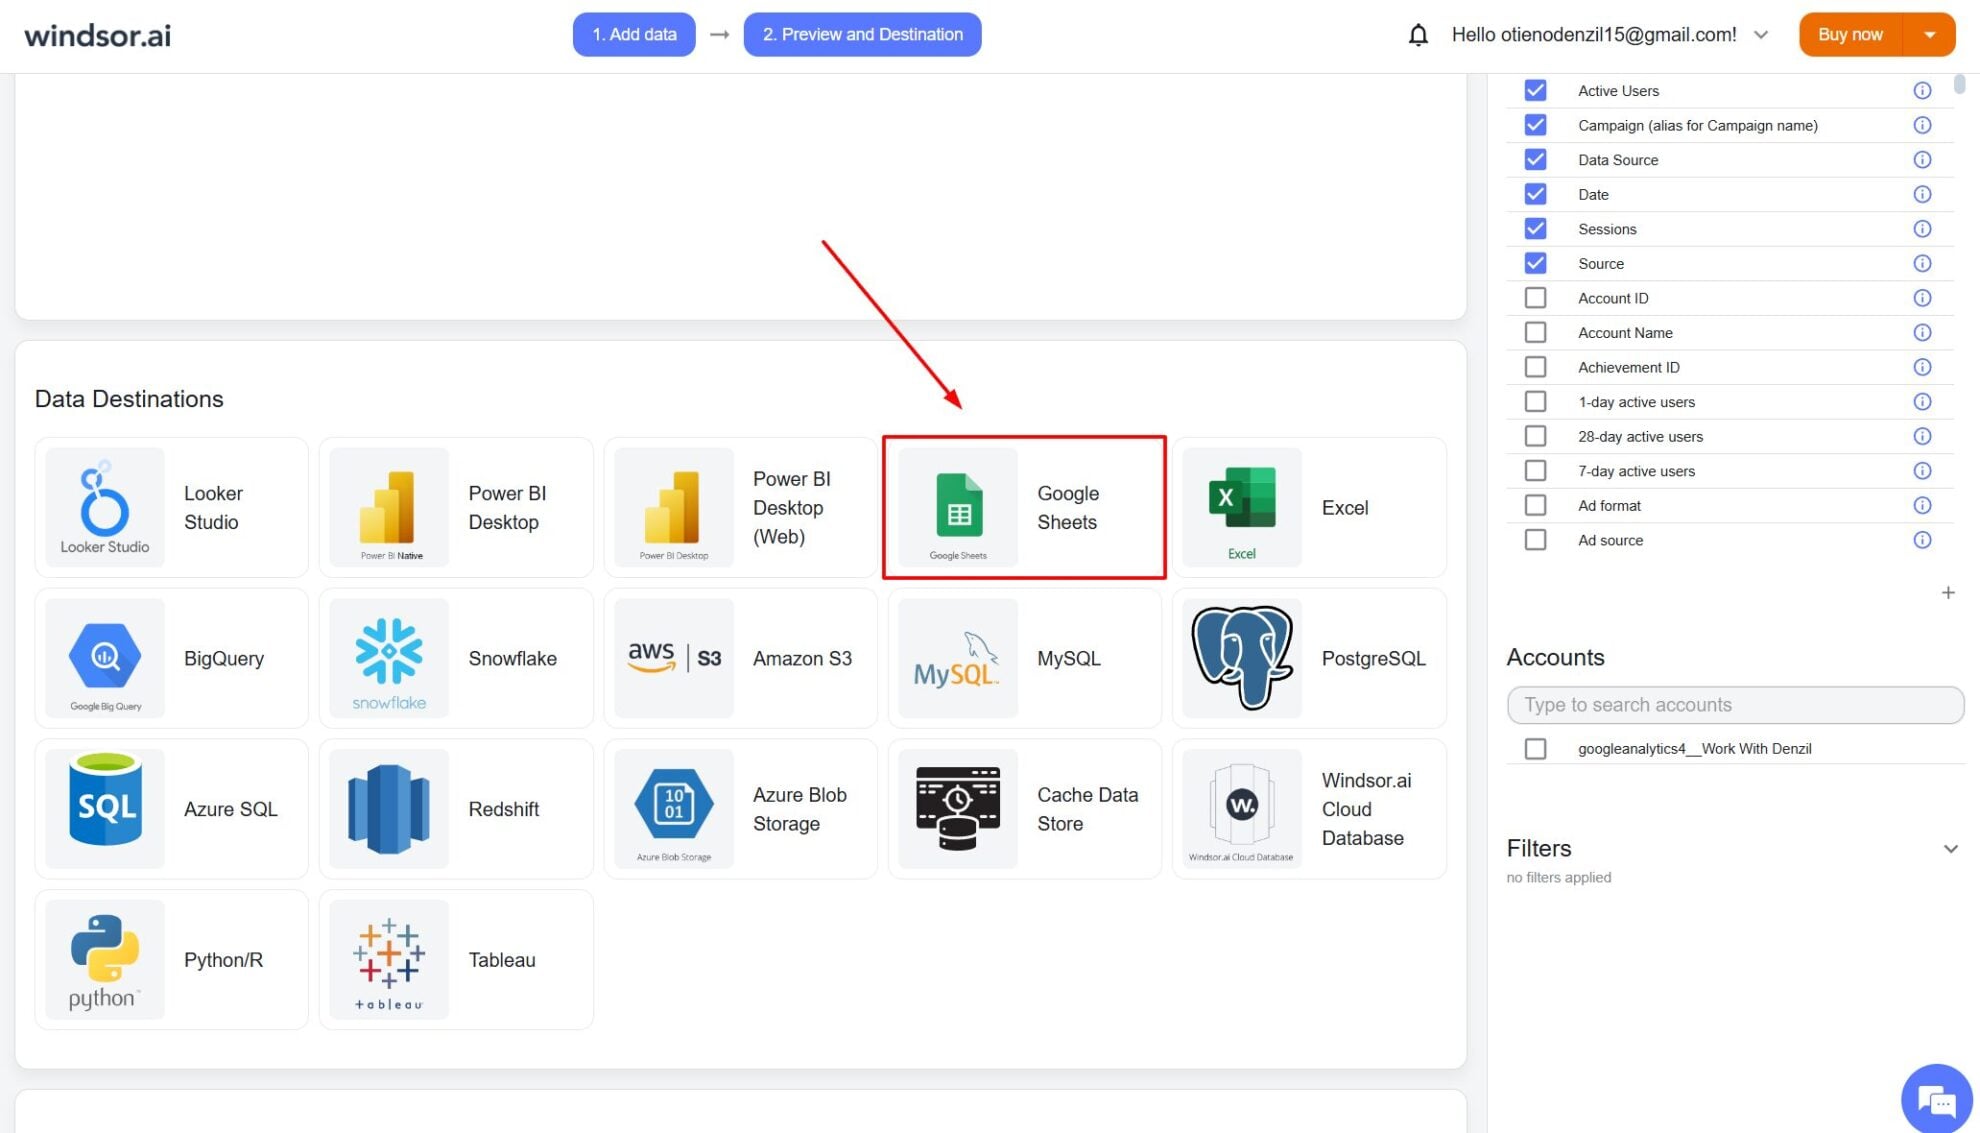
In Windsor.ai, choose Google Sheets as the destination and copy the API key from the instructions. Keep it private: anyone with the key can read your connected data.
Copy the template and install the add-on
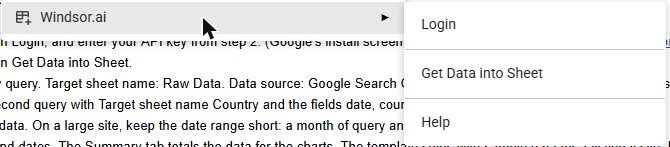
Open the Search Console template and choose File, then Make a copy. Install the Windsor.ai add-on from the Google Workspace Marketplace. Google’s permission screen calls it Data & Analytics by Windsor.ai; in the Extensions menu it is listed as Windsor.ai. Choose Extensions, Windsor.ai, Login, and paste your API key.
Load your data
Choose Extensions, Windsor.ai, Get Data into Sheet, then + Add new query. Set the target sheet name to Raw Data, the data source to Google Search Console, then your property and dates. Select these fields in this order: date, clicks, ctr, impressions, position_page, position, pagepath, query. Click Save and load data.
Add a second query with the target sheet name Country and the fields date, country, clicks, impressions. Then set the start and end dates on the KPI tab. To refresh the data automatically, set a schedule in the query panel.
What to look for in the dashboard

The day a change started
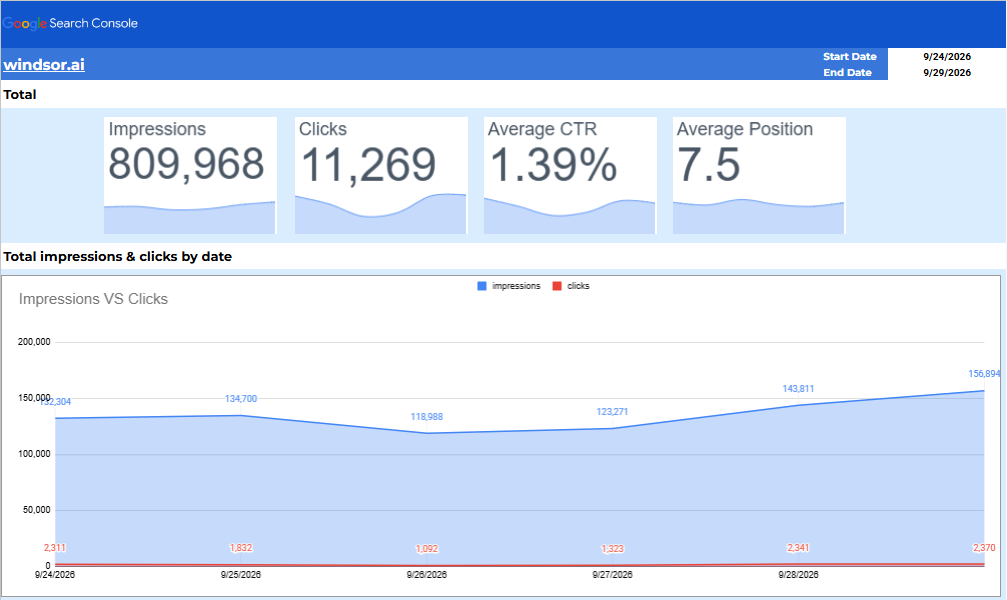
The daily chart and the sparklines show clicks and impressions per day. When clicks drop, find the first day of the drop, then filter the Raw Data tab to that day and the days before it to see which queries and pages lost clicks.

Queries with impressions and few clicks
The Raw Data tab has every query and page. Sort it by impressions to find queries with many impressions and few clicks. For a query in the top 10, a new title or meta description is the first thing to test.

Your brand name apart from the rest
On windsor.ai, the top queries by clicks were spellings of our own name. To read non-branded search on its own, add a filter to the Raw Data tab with a custom formula such as =NOT(REGEXMATCH(H2,"(?i)yourbrand")).

Where clicks come from
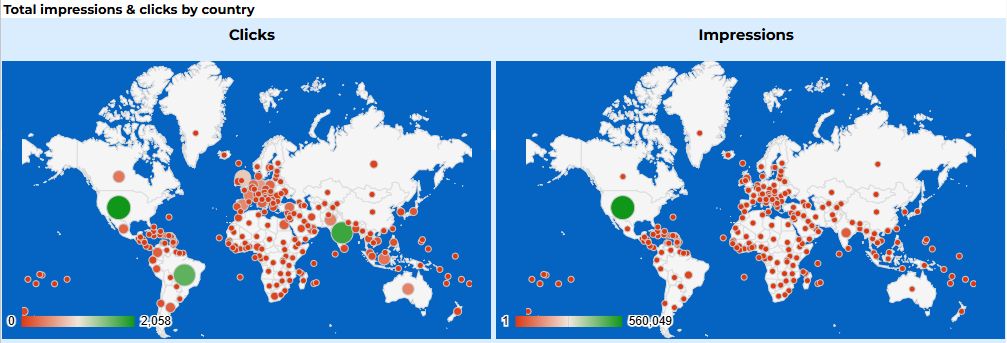
The maps show clicks and impressions by country. On windsor.ai, the United States had 61% of impressions but 13% of clicks for 24 to 29 September, and India and Brazil each had almost as many clicks as the United States.
What the template shows
The screenshot at the top of this page is the template on windsor.ai’s own Search Console property for 24 to 29 September 2026. The template has four working tabs:
- KPI: the dashboard. Impressions, clicks, CTR and average position for the dates you set, each with a daily sparkline, a daily chart of impressions and clicks, the top 20 queries by clicks, and maps of clicks and impressions by country.
- Summary: the totals behind every chart, one row per day, per query and per country.
- Raw Data: one row per date, query and page, as the add-on loads it.
- Country: one row per date and country.

How the numbers are calculated
- CTR is total clicks divided by total impressions, not an average of the CTRs of single rows.
- Average position is weighted by impressions. A query shown 40,000 times counts more than a query shown once.
- Query totals are lower than country totals. Google does not report rare queries, so their clicks appear in the country table but not in the query table. On windsor.ai, the query rows held 11,269 clicks for 24 to 29 September and the country rows held 15,993.
We rebuilt the template in October 2026 after this test. The earlier version read a fixed number of rows and averaged position across rows. On windsor.ai’s data it showed 5,235 clicks instead of 11,269 and an average position of 2.2 instead of 7.5.
Limits we hit
- Size. A month of date, query and page rows for windsor.ai was too big for one load, and the add-on returned “Too big dataset for googlesheets”. Six days (95,409 rows) loaded in about five minutes. On a large site, load a shorter date range.
- Homepage rows. The page path is the URL without the domain, so rows for your homepage have an empty page path.
- Latest days. Search Console data is usually 2 to 3 days behind. On 2 October the latest day available was 29 September.
FAQs
Where do I get the template?
Open the Google Search Console template for Google Sheets and choose File, then Make a copy. The copy is yours to edit.
Why does the template show data before I connect anything?
It ships with sample data for a fictional outdoor shop, so every chart is filled. Loading your own data into the Raw Data and Country tabs replaces it.
How often is the data updated?
The data updates when you load the query, and on a schedule if you set one in the add-on’s query panel. Search Console data itself is usually 2 to 3 days behind.
Why don't the totals match the Search Console Performance report?
There are two reasons. Google does not report rare queries, so a table split by query has fewer clicks than the site total; the country table is closer to it. The latest 2 to 3 days are also still being filled in.
What does "Too big dataset for googlesheets" mean?
The query returned more rows than the add-on loads in one run. Load a shorter date range: on windsor.ai, six days of date, query and page rows (95,409 rows) loaded, and a month did not. For longer history, send the data to BigQuery instead.
Can I use the template for several websites?
Yes. Select several properties in the query and the dashboard adds them together. For one dashboard per site, make one copy of the template per site.
Do you have other Search Console templates?
Yes. The Data Studio SEO report template runs on Google’s own Search Console connector, and the Search Console dashboard templates page compares the Data Studio, Power BI, Google Sheets and Tableau templates.
Is there documentation for the Google Sheets add-on?
Yes. The documentation explains how to integrate data into Google Sheets with Windsor.ai, including the API key and scheduling.
Tired of juggling fragmented data? Get started with Windsor.ai today to create a single source of truth


