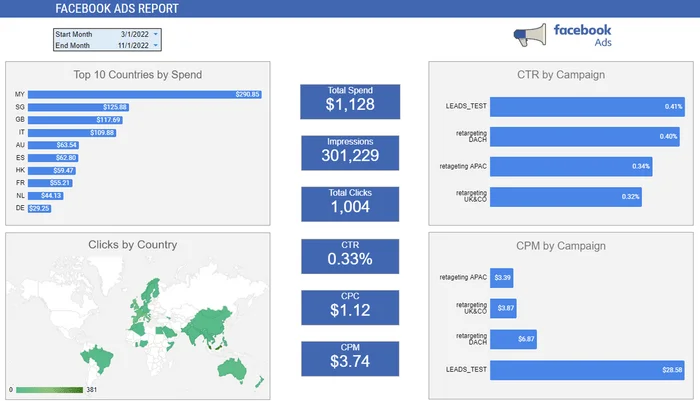
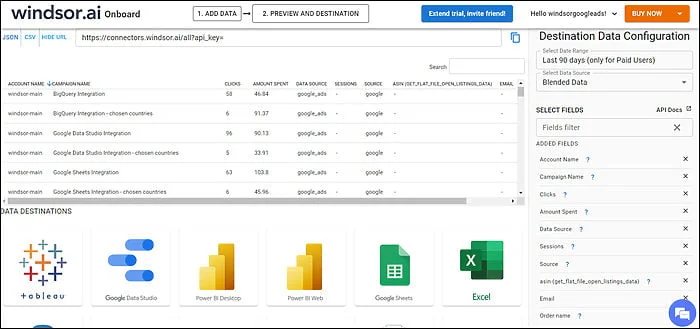
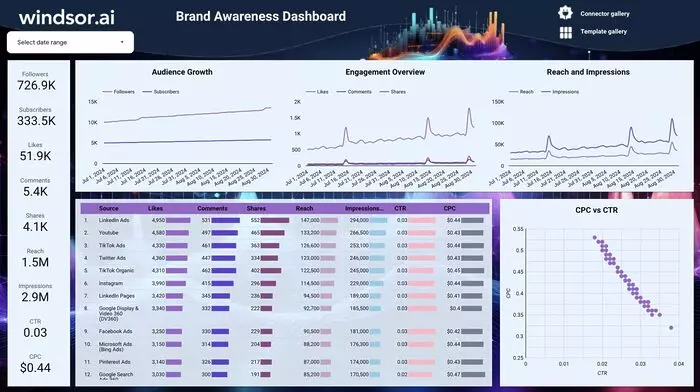
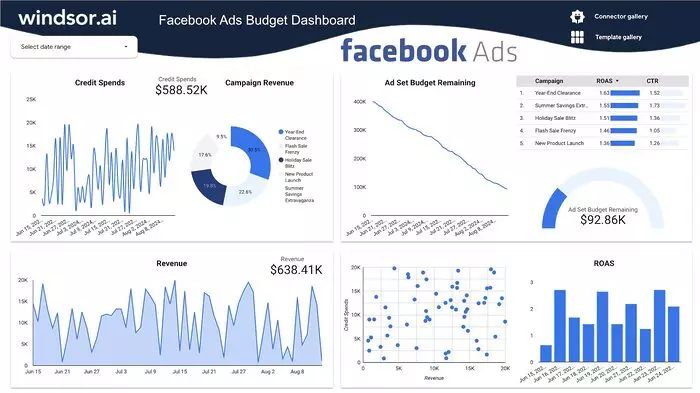
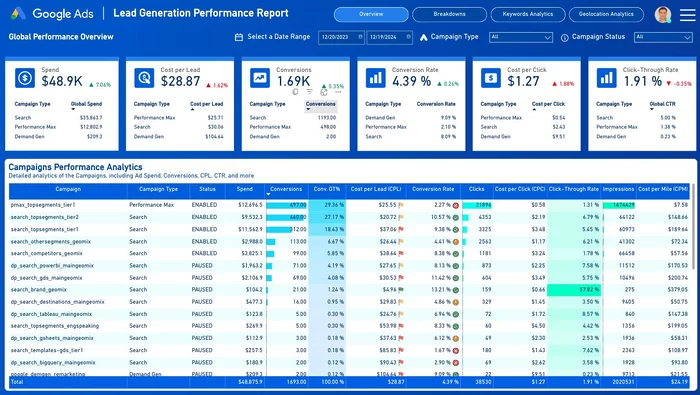
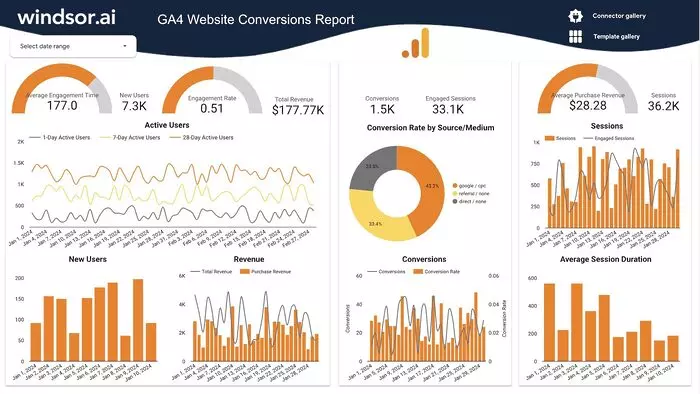
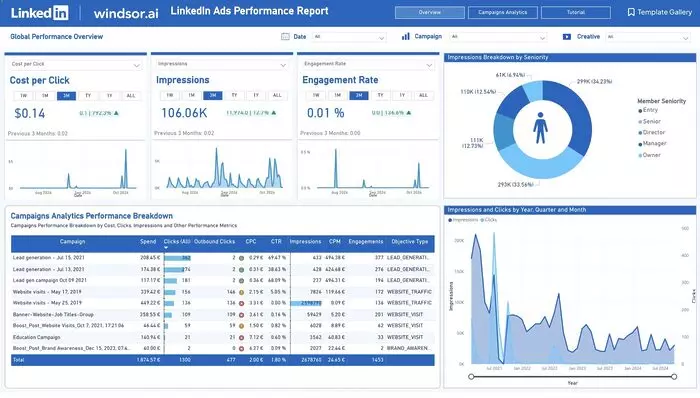
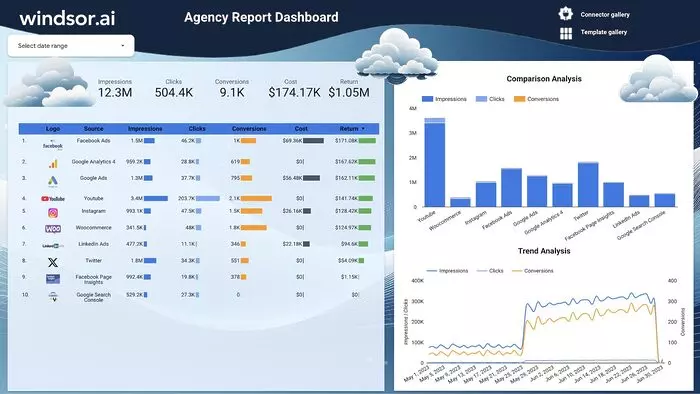
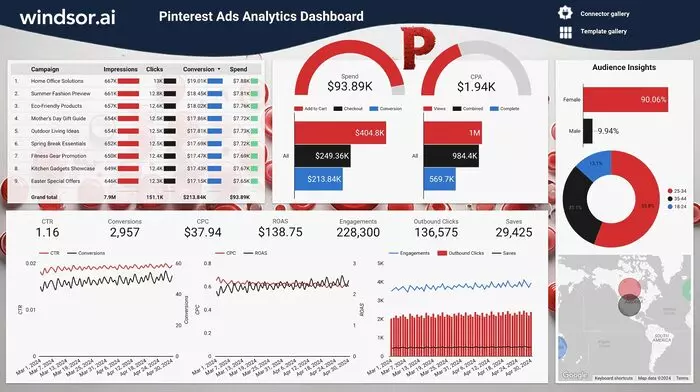
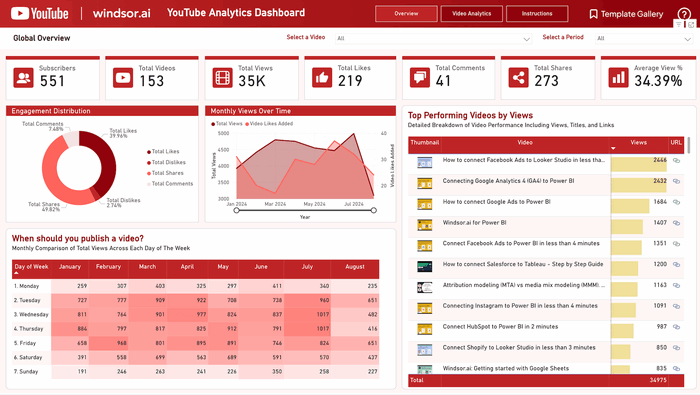
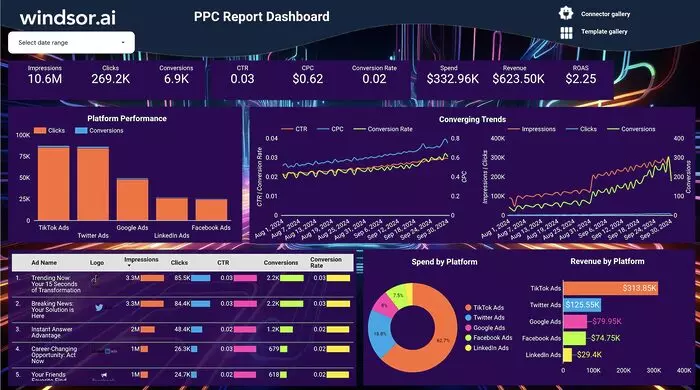
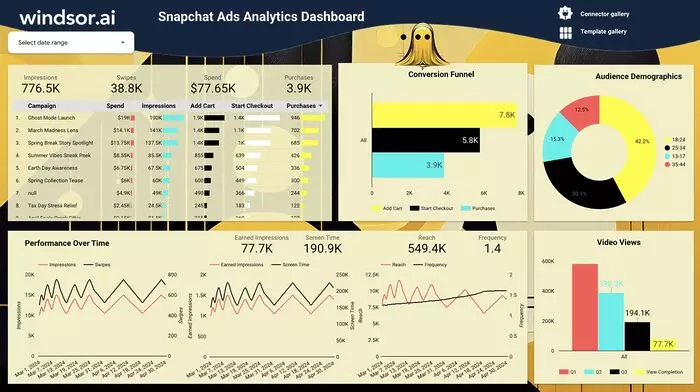
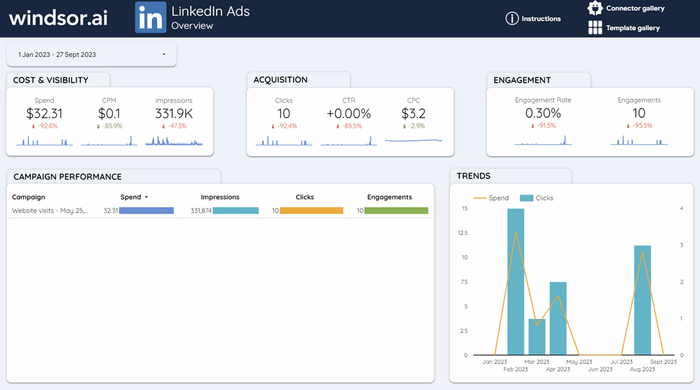
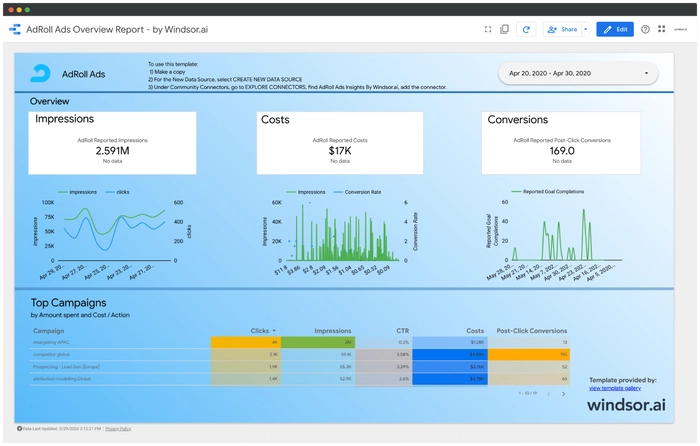
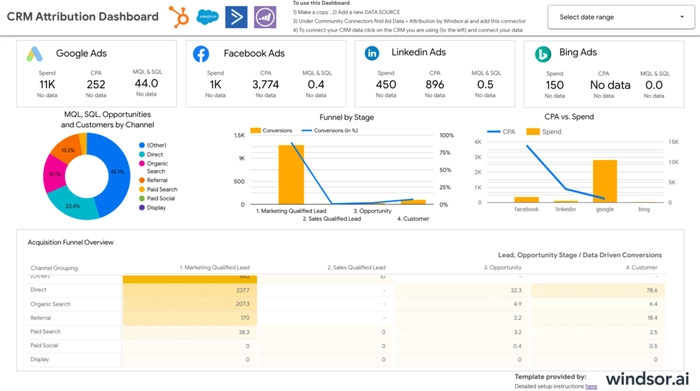
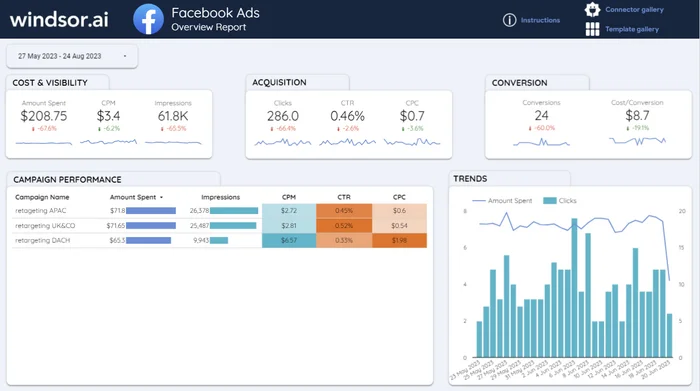
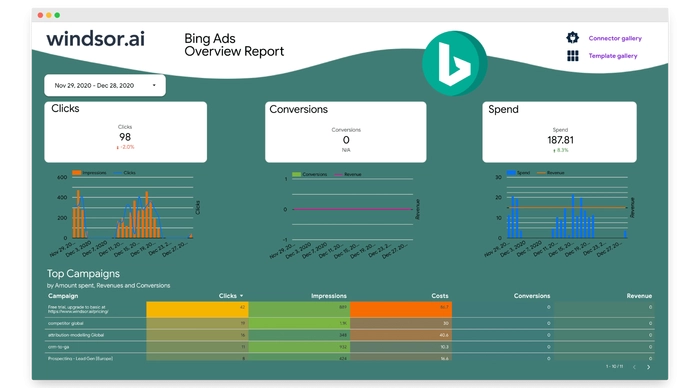
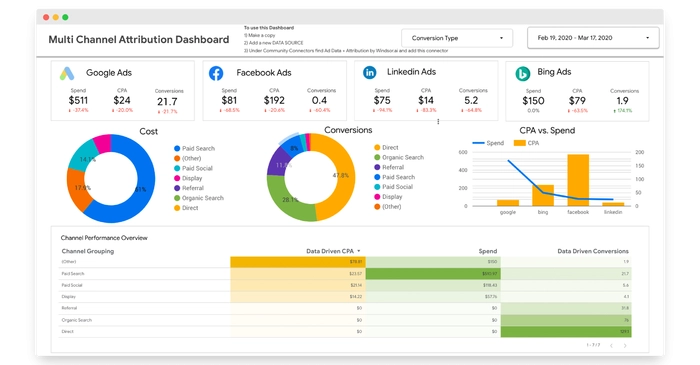
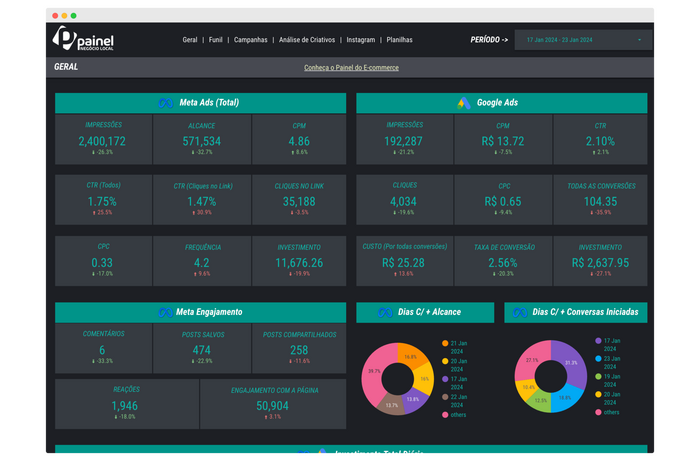
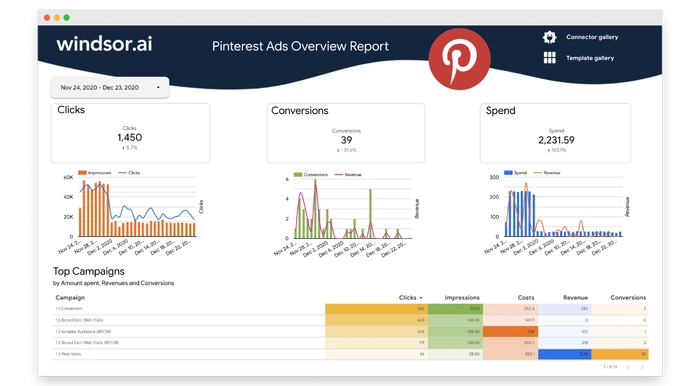
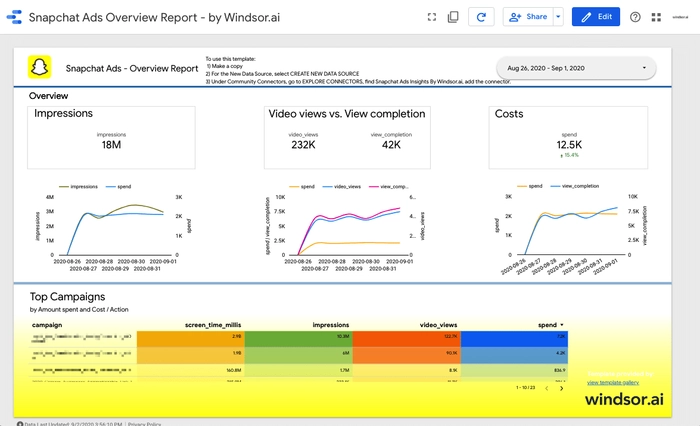
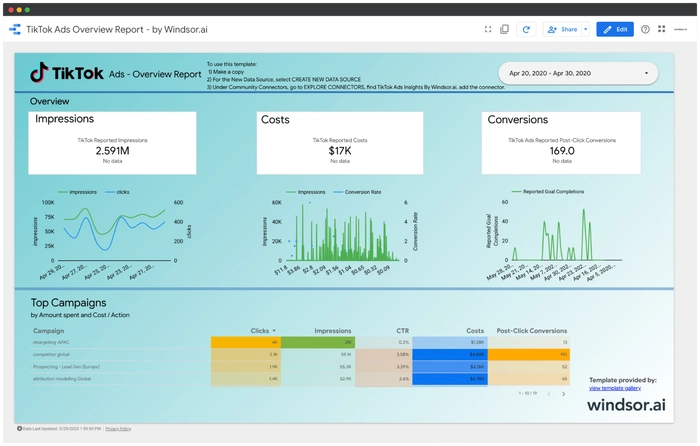
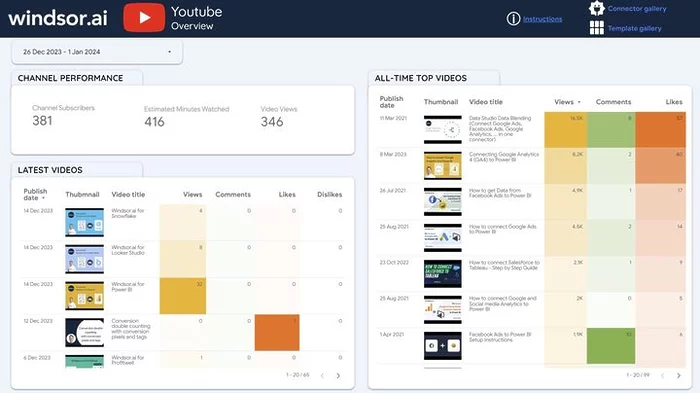
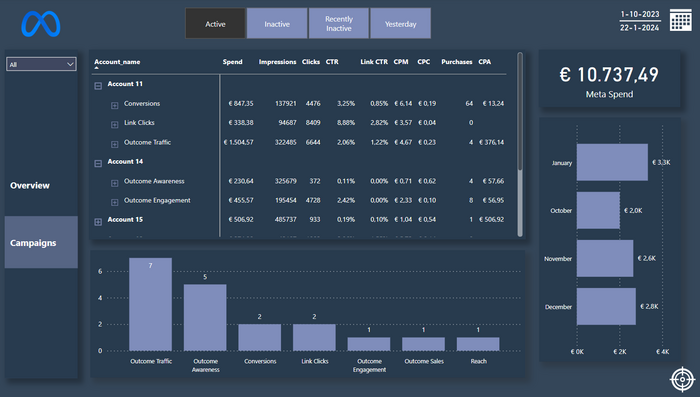
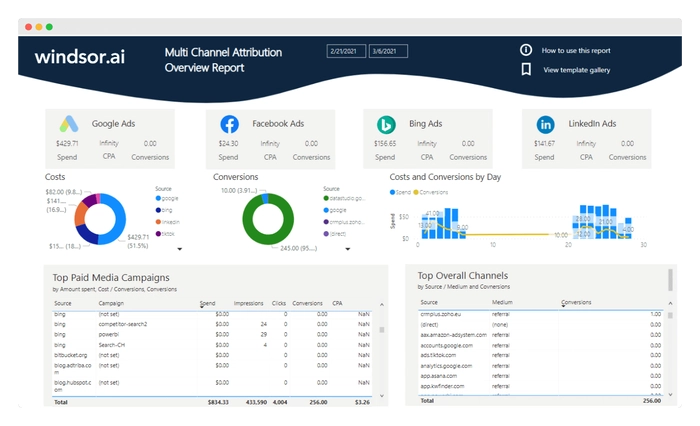
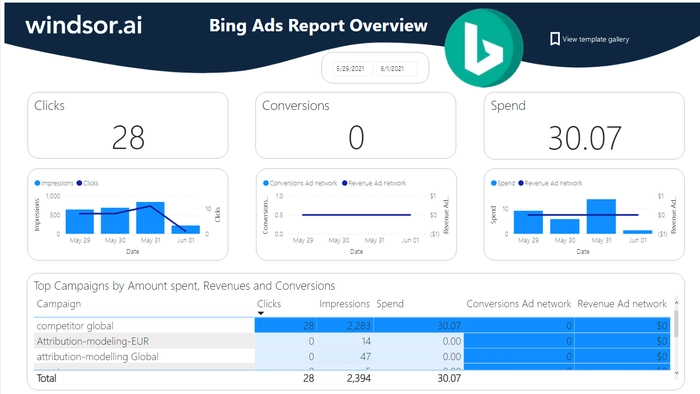
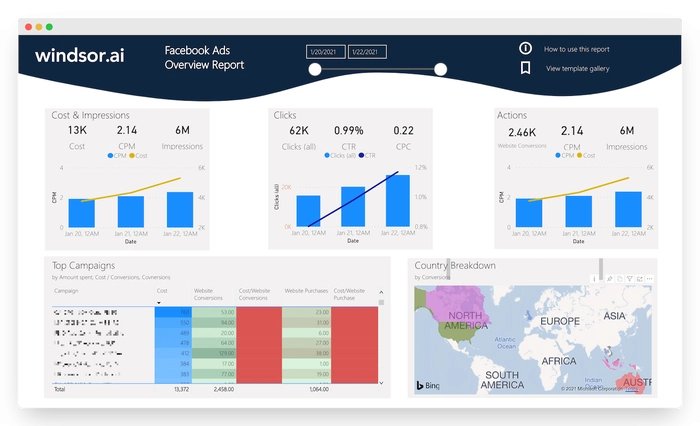
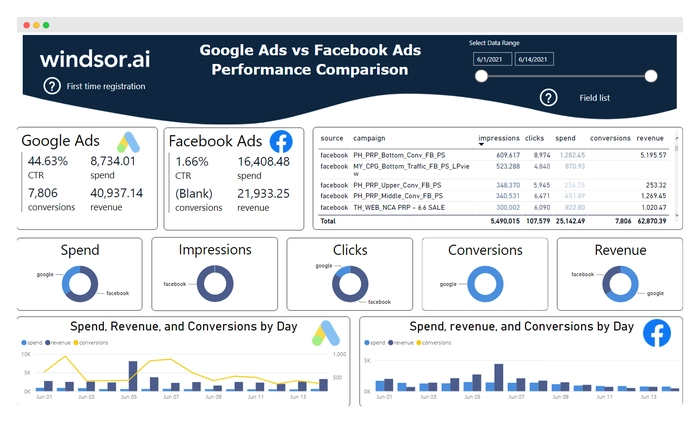
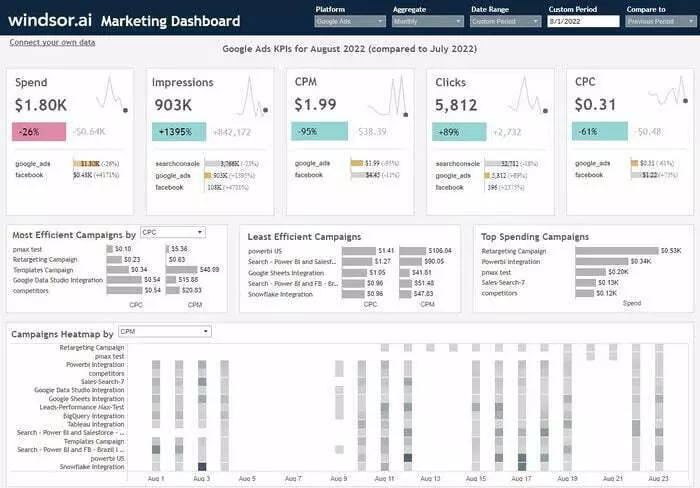
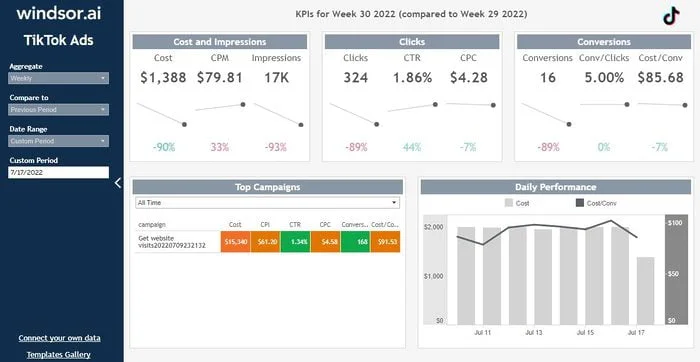
Free Paid Media Dashboard Report Templates
At Windsor.ai, we strive to make free paid media reporting as effortless as possible for our users.
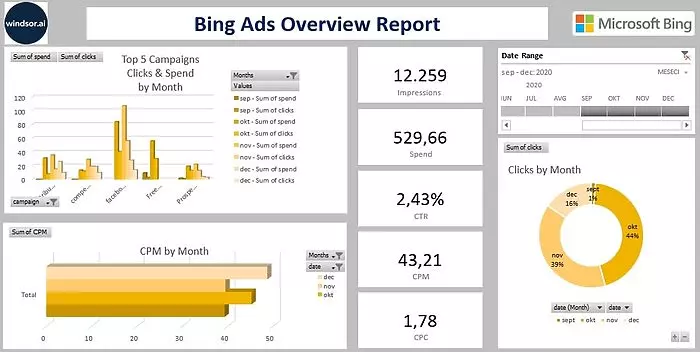
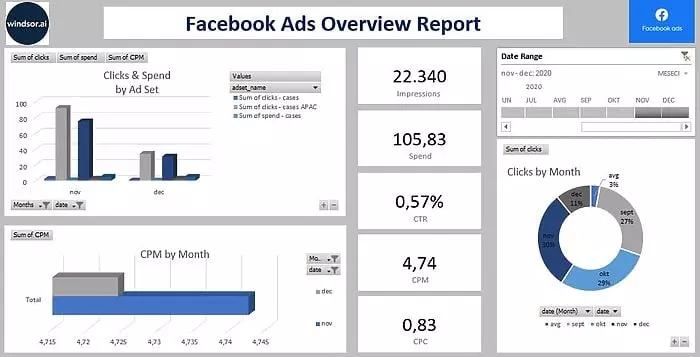
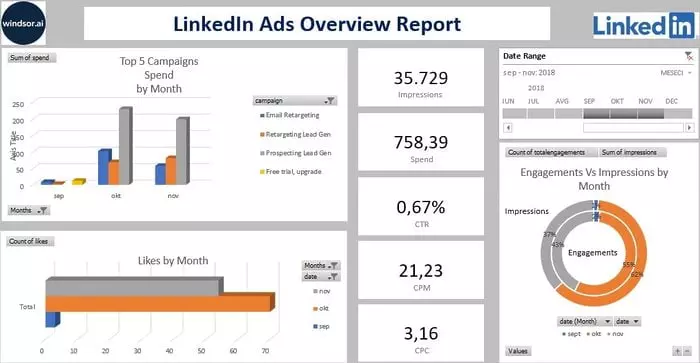
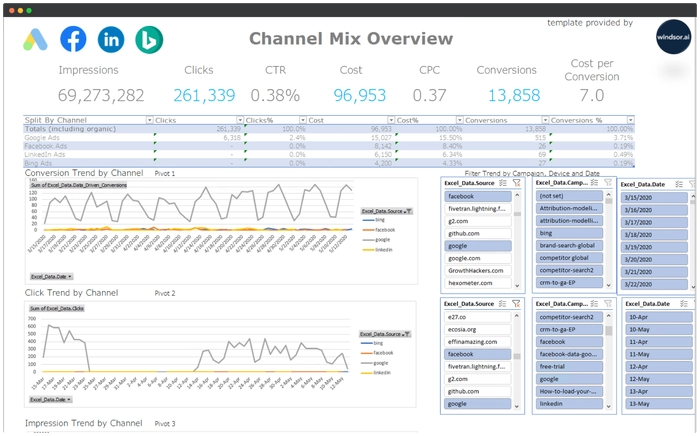
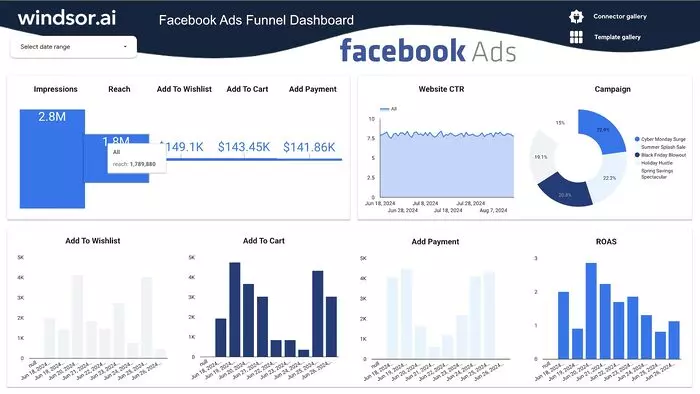
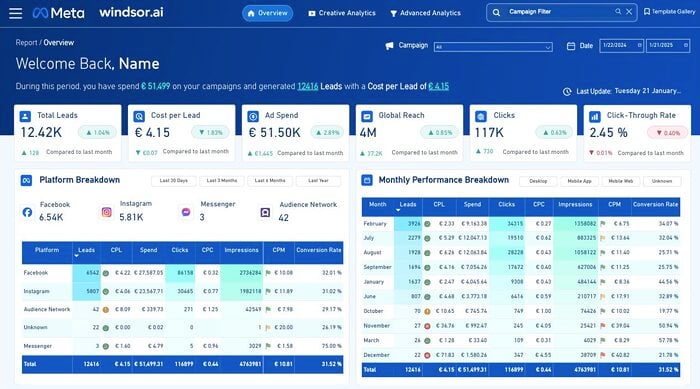
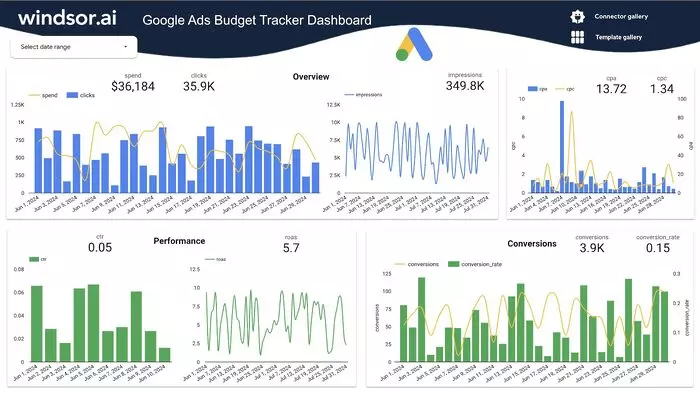
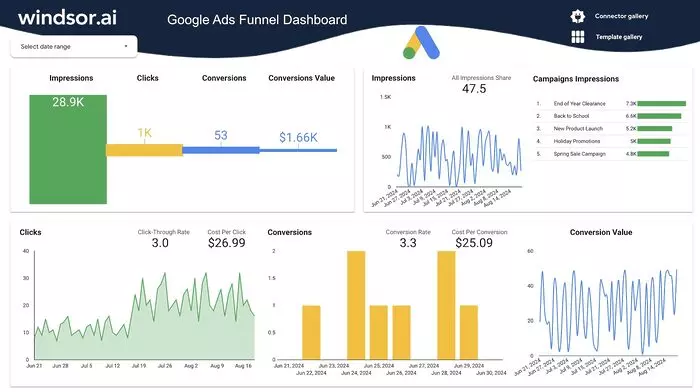
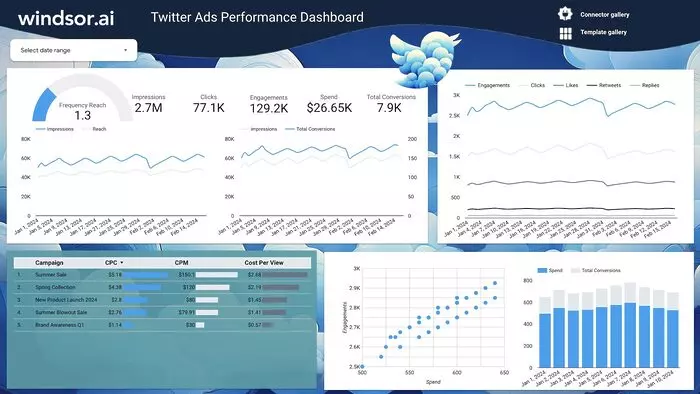
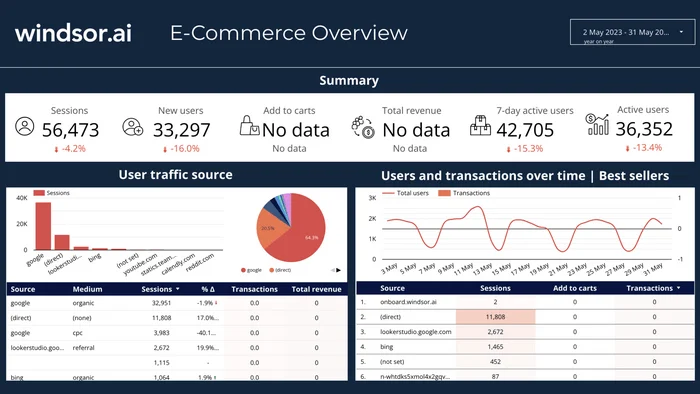
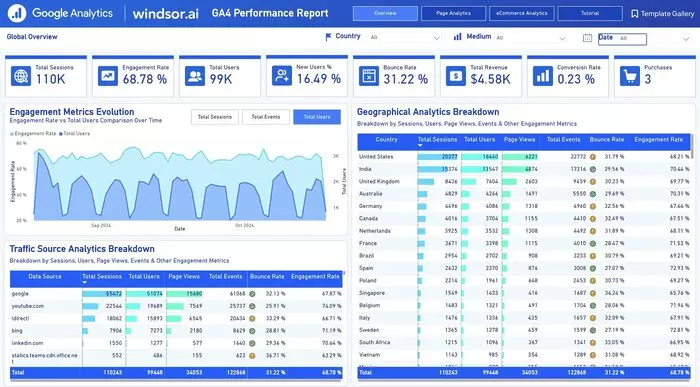
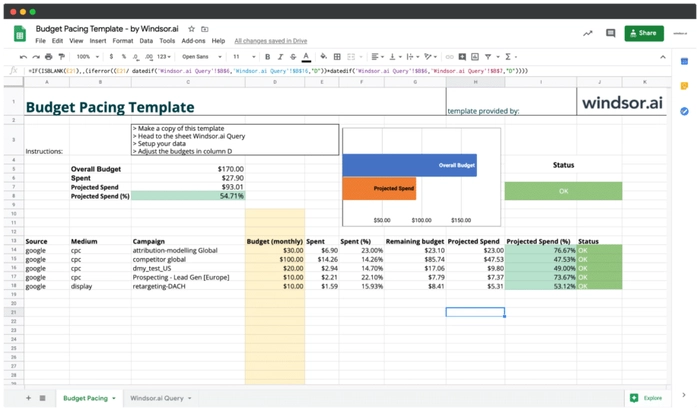
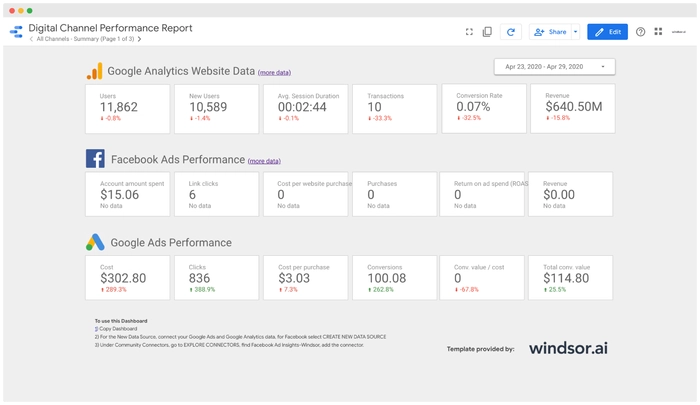
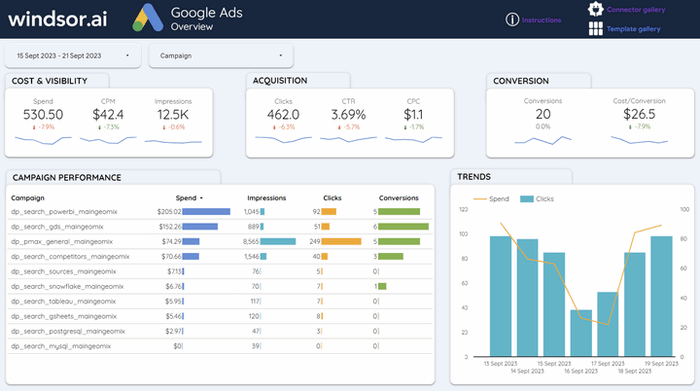
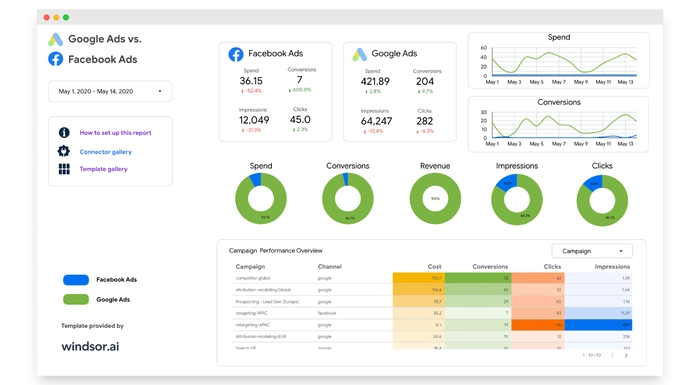
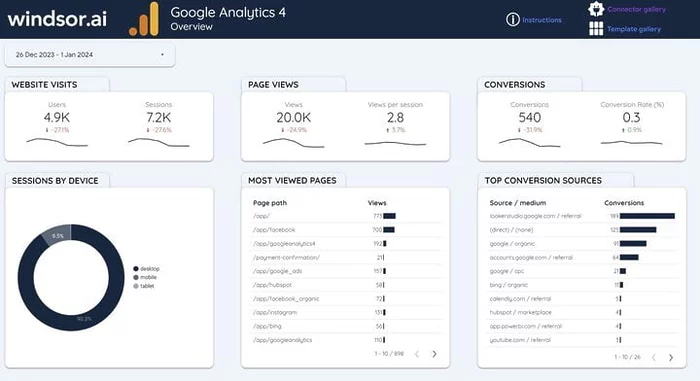
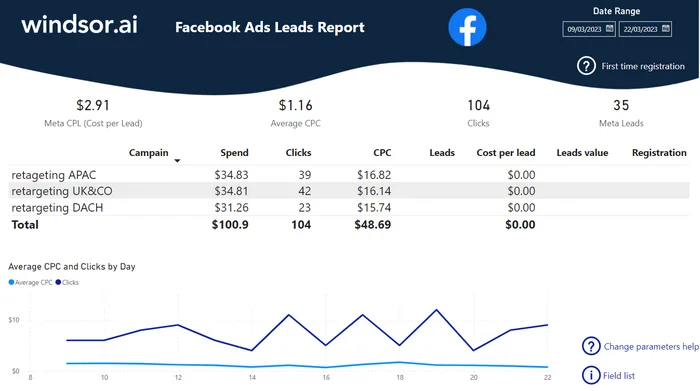
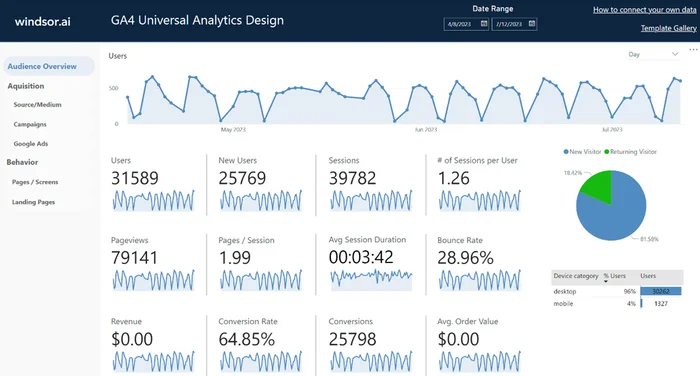
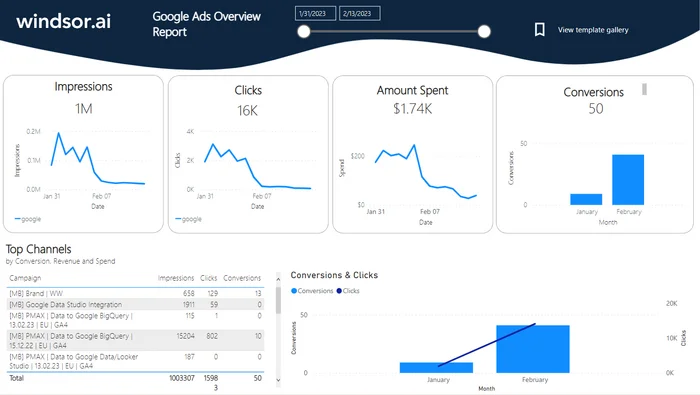
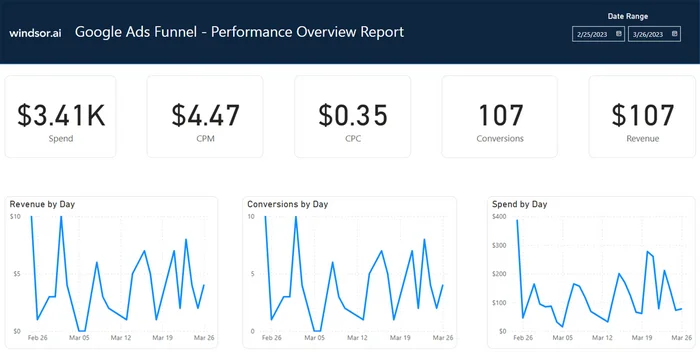
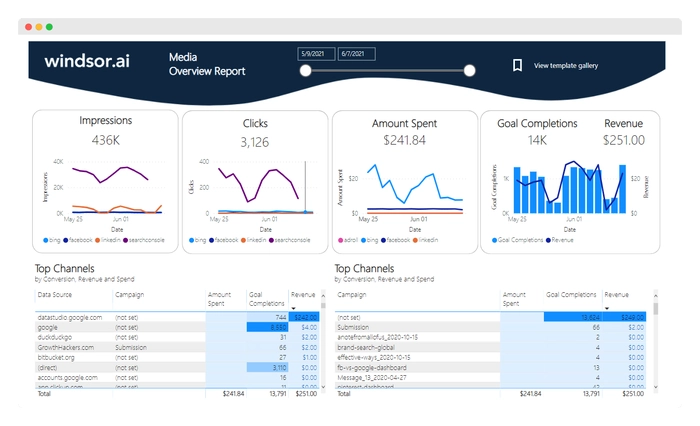
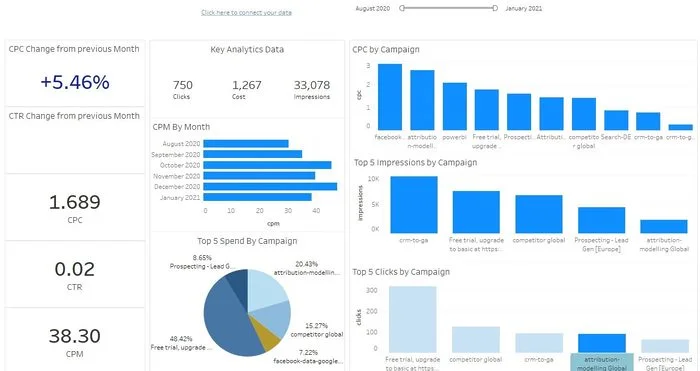
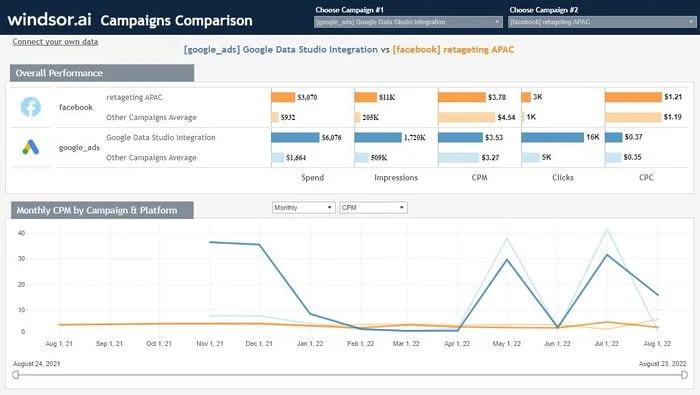
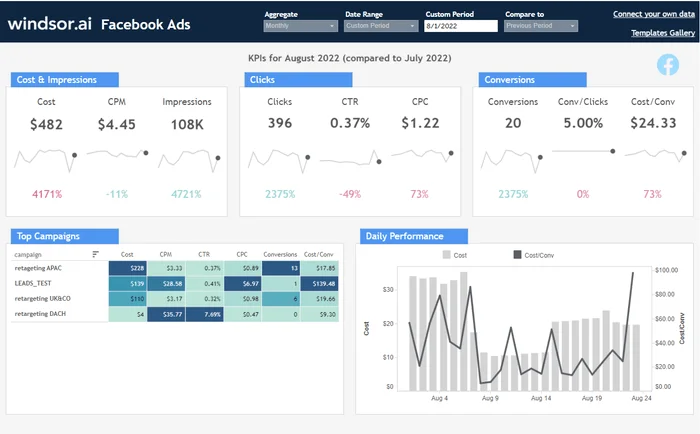
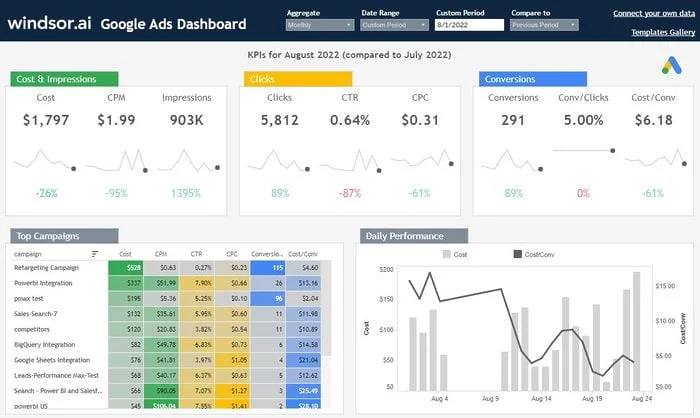
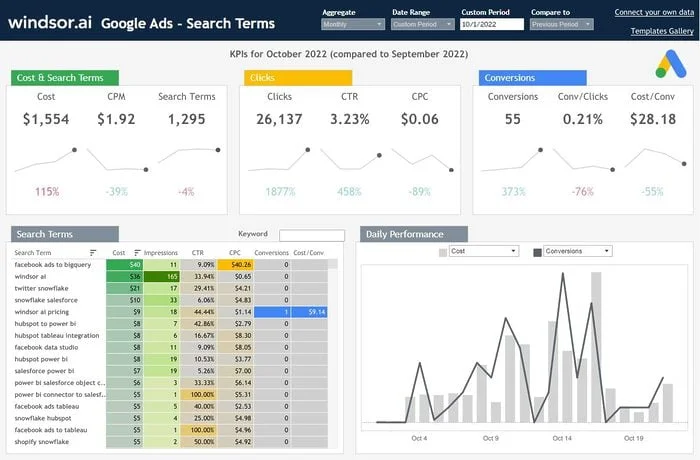
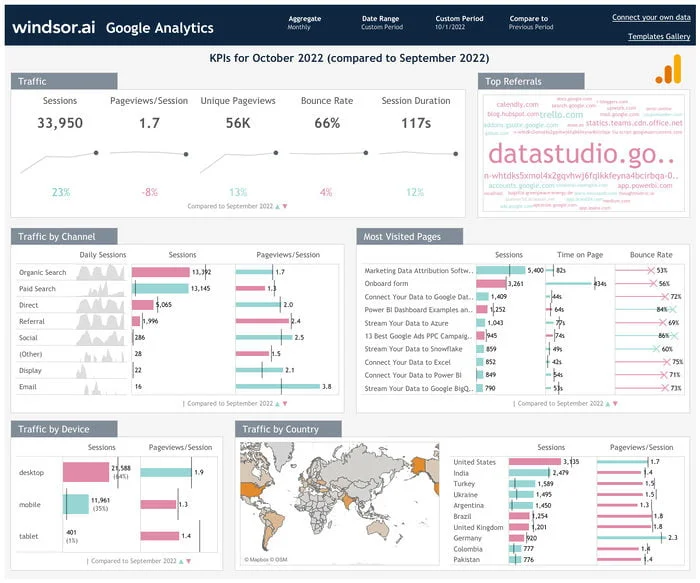
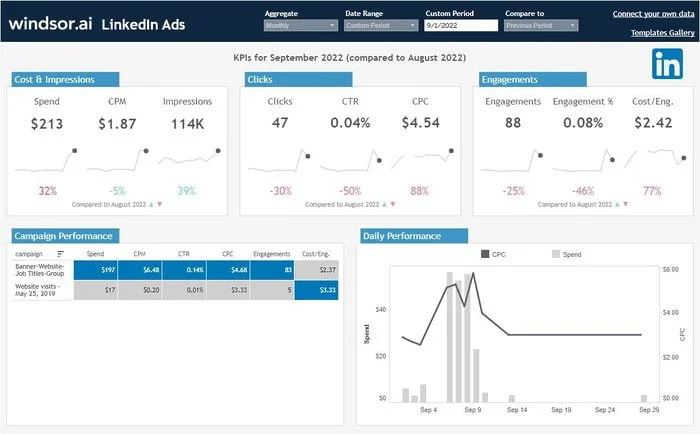
These free and customizable paid media templates will assist you in visualizing your data for easy reporting and analysis.
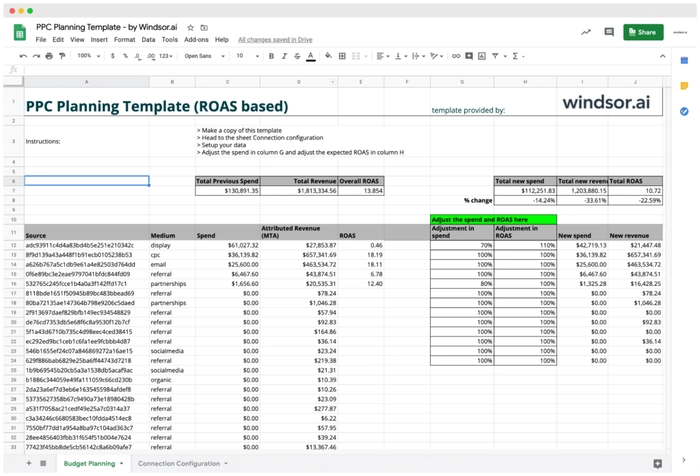
All the paid media dashboard report templates have easy-to-follow instructions.
Find the right template from paid media ’s library and start using them to save time, effort and increase productivity.
Try Windsor.ai today
Access all your data from your favorite sources in one place.
Get started for free with a 30 - day trial.
What exactly is a paid media dashboard?
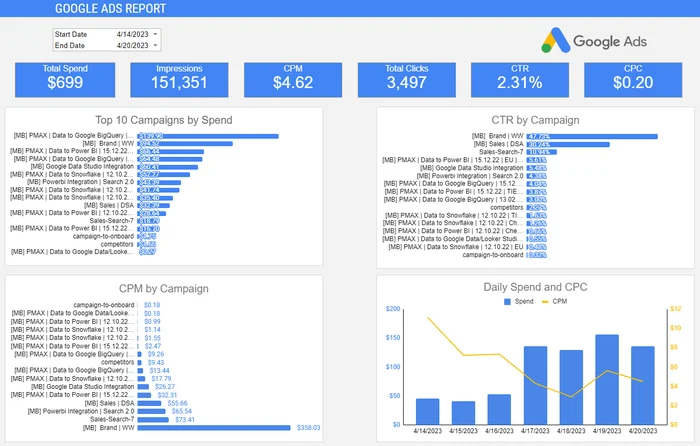
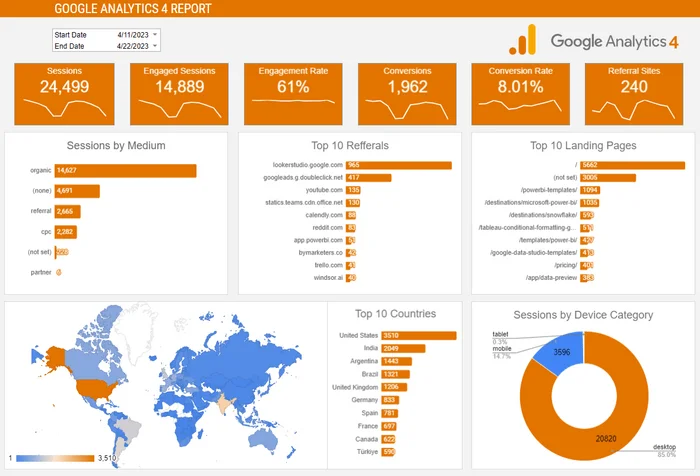
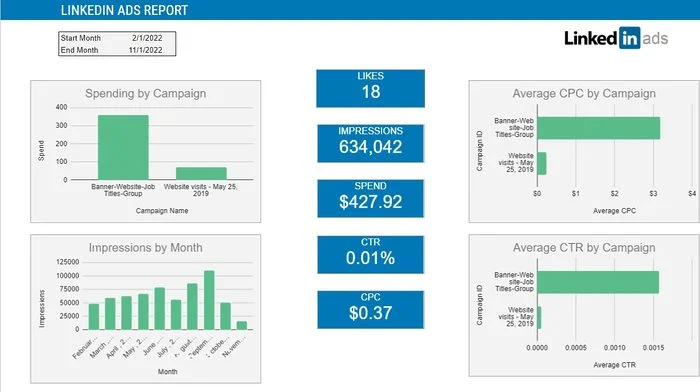
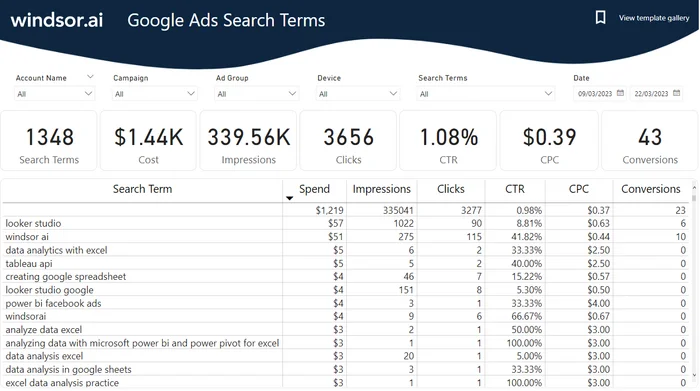
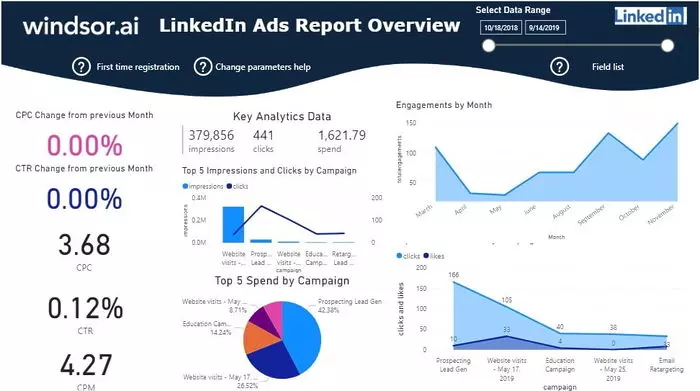
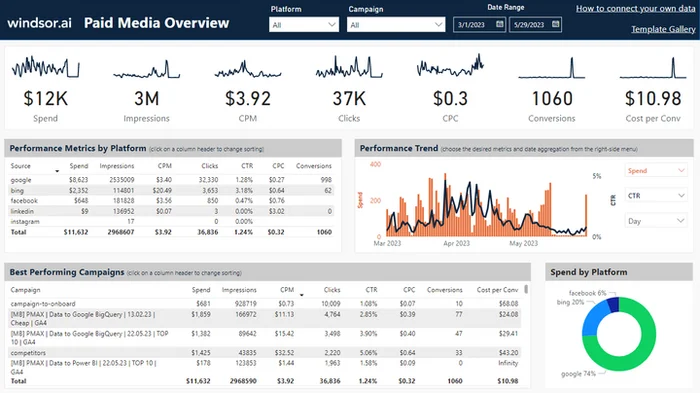
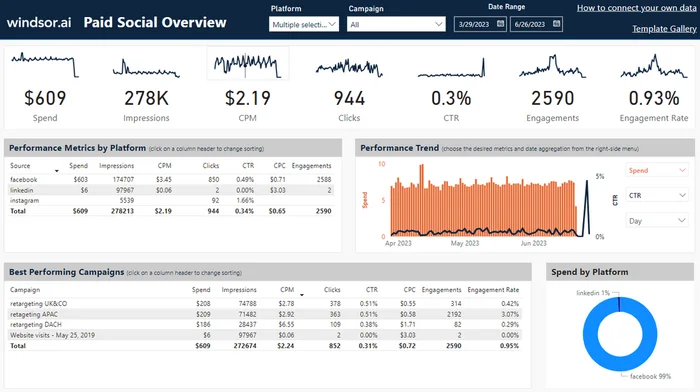
A paid media dashboard is your go-to tool that aids marketing strategies. It succinctly pulls and analyzes data from your paid media campaigns like Google Search, Google Display, and social media, among others.
These dashboards also house the opportunity to create clean reports for easy viewing and interpretation. Luckily for you, there’s no additional visual clutter to leave you confused about what you’re supposed to be looking at unlike certain platforms like Google Ads and Facebook Ads Manager.
How Do Paid Media Dashboards Measure Campaign Success?
When it comes to a dashboard, you want it to be easy to use, secure, and customizable according to the key performance indicators (KPIs) you need and the KPIs you want to display. Depending on your job and organization, your KPIs could change, so having a dashboard that is personalized for you and your objectives needs to be a priority.
The KPIs to have on paid media dashboards involve:
- Conversions (goals): how many times performed the goal you wanted
- Conversion rate: the number of conversions divided by the number of ad interactions that led to a conversion
- Cost-per-acquisition (CPA): avg. of how much a conversion cost
- Clicks: how many times someone clicks on your ad
- Impressions (reach): how many times your ad is shown
- Click-through rate (CTR): the ratio between clicks and impressions
- Cost-per-click (CPC): avg. of how much each click cost
What to include in a Paid Media report?
A comprehensive Paid Media report should encompass a breakdown of metrics across visibility (e.g., impressions, reach), engagement (e.g., clicks, CTR), and conversion (e.g., conversions, ROI).
Provide context by comparing costs, date ranges, goals, conversion rates, and industry benchmarks. For instance, compare the cost per click across different campaigns or assess the conversion rate for a specific audience segment.
The data should be segmented by key parameters:
- campaign (e.g., campaign name, goals)
- channel
- audience (e.g., demographics, interests)
- content (e.g., ad variations, landing pages)
- objective (e.g., brand awareness, lead generation)
- date (e.g., daily, weekly)
For example, a report could highlight impressions and CTR for a specific campaign across various channels, conversions segmented by audience, and ROI analyzed based on different objectives over time.
Paid media dashboards provide valuable insights to precisely identify the strengths and weaknesses of your marketing campaigns. Let us assist you in constructing a tailored performance marketing dashboard, allowing you to observe and analyze the results as they unfold.
