 AI insights
 About us
 Careers
 Security
 Customer reviews
 Contact us
 Affiliate program
 Solution partners
 Looker Studio templates
 Tableau templates
 Facebook Ads templates
 Google Ads templates
 Data fields & Metrics
 AI prompt library & Guides
 Product documentation
 API documentation
 Case studies
 Blog
Blog Data models
 Windsor vs Supermetrics
 Windsor vs Fivetran
 Windsor vs Portermetrics
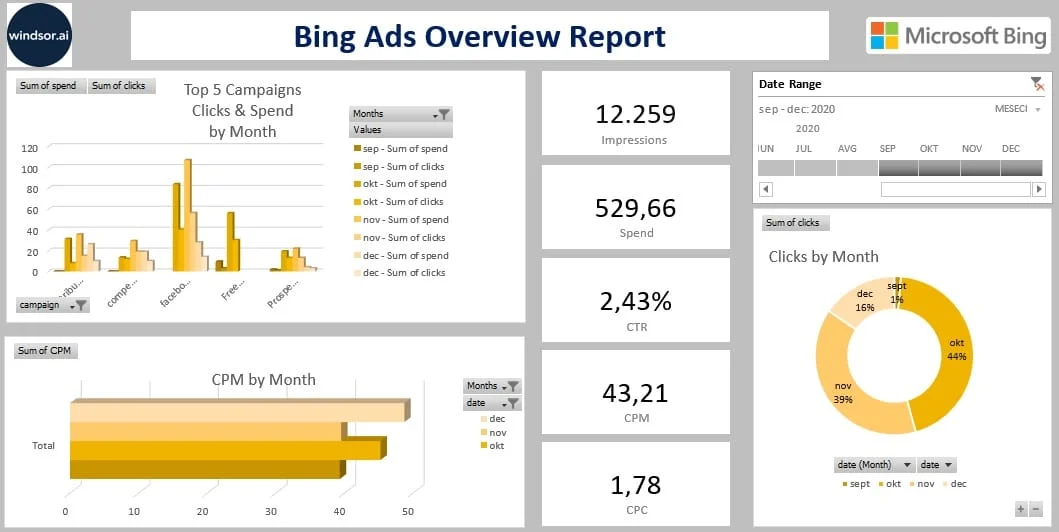
For visualizing your Microsoft Bing Ads, you can now use the Excel Bing Ads Overview Report Template.
Using the Bing Ads Overview Report template, you can create charts for the Bing Ads in Excel in just a few clicks. In this Excel dashboard template, we are using these metrics:
- Source
- Campaign
- Clicks
- Impressions
- Spend
- CPC
- CMP, and
- CTR.
You can find more details about the Bing Ads here.
This report queries the data through our connector and makes it available in real-time.
Please follow the steps shown below and connect your data:
- Connect your Bing Ads Data to Windsor.ai here.
- Sign out from your Microsoft accounts and select at least one Bing Ads account from the dropdown.

- Download the template
- Head to the sheet Instructions
- Set up your data and edit the template to accommodate your marketing data reporting needs.

If you are using a template from Windsor.ai for the first time, you will see a message about Privacy levels similar to the one below. In the case you see this message, click on “Ignore Privacy Levels checks for this file.”

For more templates, check out our template gallery. There, you can find examples for Google Sheets, Looker Studio, Power BI, Tableau template and many more.
Read also:
Connect Bing Ads to Google BigQuery