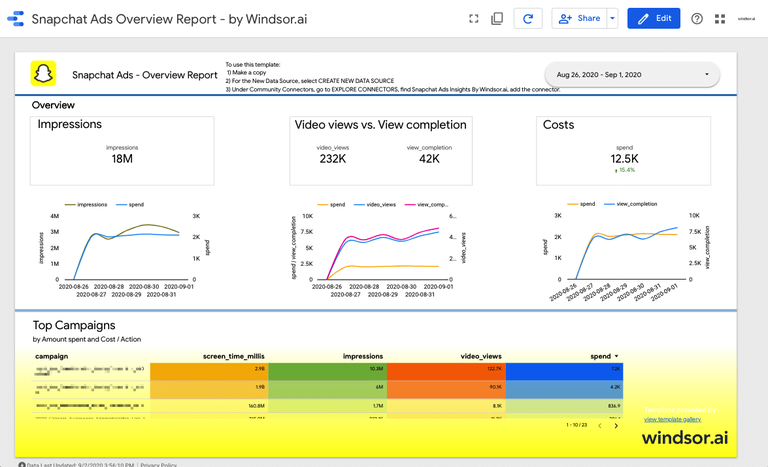
- Campaign Name
- Click Count
- Amount Spent
- Impression Count
- Swipe-Up Count
- Total Time Spent on top Snap Ad (in milliseconds)
- Video Views to 25%
- Video Views to 50%
- Video Views to 75%
- Video Views to completion
- The total number of impressions that meet the qualifying video view criteria of at least 2 seconds of consecutive watch time or a swipe up action on the Top Snap
To get started should take less than 5 minutes. In order to get your dashboard up and running you will need access to an Snapchat account which is linked to a Snapchat Ads account. During the installation of the connector, you will be prompted to authenticate and issue a token.
This dashboard connects to the following data source
- Snapchat Ads
To start using it
- Configure the Looker Studio Connector: Snapchat Ad Insights
- Once you finished adding your accounts click Finish
- Back in Looker Studio, click CREATE REPORT
- Now your Snapchat Ads dashboard is ready!
To get other channels connected and visualised please check out our Marketing Dashboard Template Gallery.
You should also read:
Free Snapchat Ads Report Templates
Connect Snapchat Ads to Snowflake
Snapchat Ads Google BigQuery Integration
Connect Snapchat Ads to Tableau
Connect Snapchat Ads to Google Sheets
Snapchat Ads Power BI Integration
Best Free & Paid Looker Studio Connectors in 2023
9 Best Looker Studio Example Dashboards
Looker Vs Power BI: Compare BI Tools
Looker Studio Template Gallery
Best Social Media Dashboarr Reports
Best E-Commerce Dashboard Templates
Best Lead Generation Dashboard Templates
Best Web Analytics Report Templates
Best Data Analyst Report Templates
