 AI insights
 About us
 Careers
 Security
 Customer reviews
 Contact us
 Affiliate program
 Solution partners
 Looker Studio templates
 Tableau templates
 Facebook Ads templates
 Google Ads templates
 Data fields & Metrics
 AI prompt library & Guides
 Product documentation
 API documentation
 Case studies
 Blog
Blog Data models
 Windsor vs Supermetrics
 Windsor vs Fivetran
 Windsor vs Portermetrics
Free Web Analytics Report Templates
At Windsor.ai, we strive to make Web Analytics marketing reporting as effortless as possible for our users.
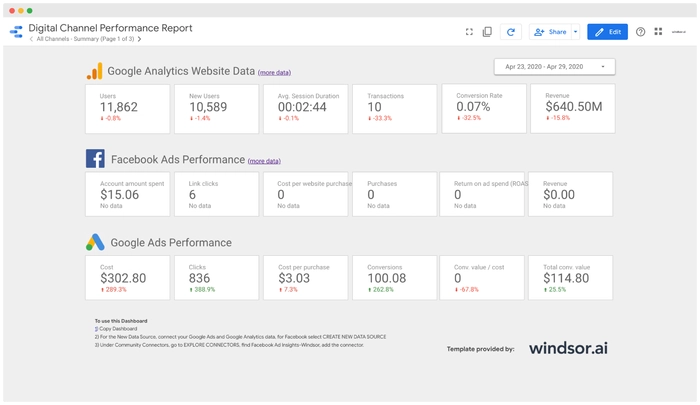
These Web Analytics report templates will help you optimize your marketing spending and investments.
Free Web Analytics dashboard templates with easy-to-follow instructions for connecting your own data.
Find the right template from Web Analytics’s library and start using them to save time, effort and increase productivity.


Try Windsor.ai today
Access all your data from your favorite sources in one place.
Get started for free with a 30 - day trial.
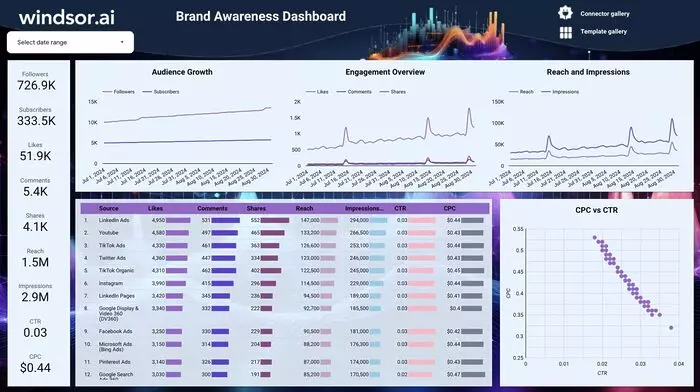
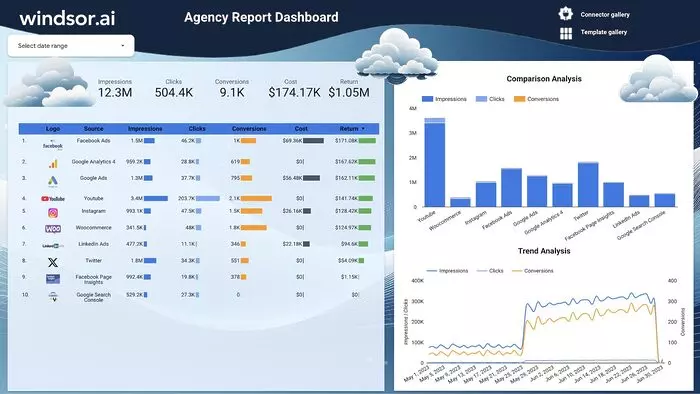
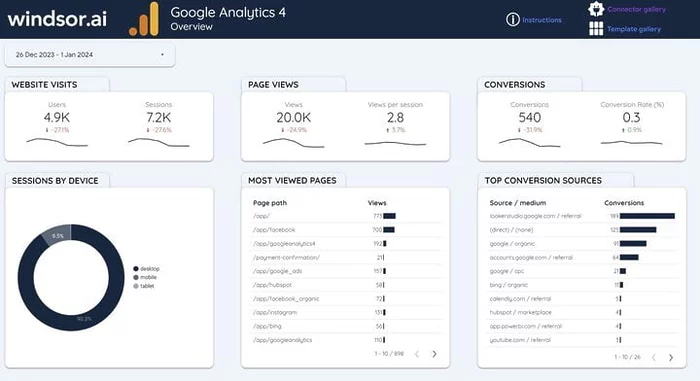
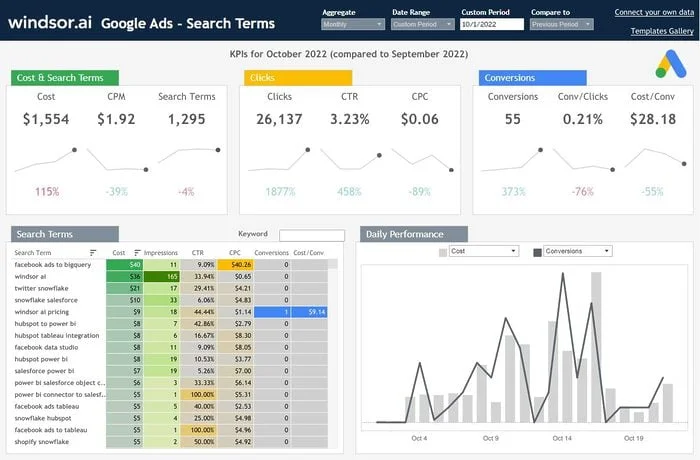
What is a Web Analytics Dashboard?
A web analytics dashboard or report is an indispensable tool for businesses looking to maximize the effectiveness of their online presence.It typically includes a detailed overview of various metrics and key performance indicators (KPIs) related to the website’s traffic, user engagement, conversions, and other relevant data points.
Here are some key elements that are commonly found in a web analytics report:
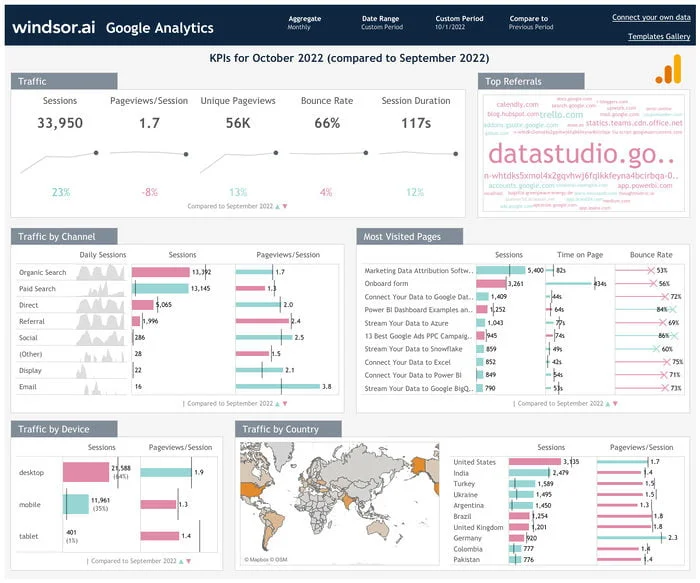
- Traffic Overview:
- Total Visits: The total number of visits to the website.
- Unique Visitors: The number of distinct individuals who visited the website.
- Pageviews: The total number of pages viewed on the website.
- Bounce Rate: The percentage of visitors who left the site after viewing only one page.
- Traffic Sources:
- Organic Search: The number of visits from search engines.
- Direct: The number of visits directly typing the URL or using bookmarks.
- Referral: The number of visits from external websites.
- Social: The number of visits from social media platforms.
- Paid Search: The number of visits from paid search advertising.
- User Behavior:
- Average Session Duration: The average amount of time visitors spend on the site.
- Pages per Session: The average number of pages viewed in a session.
- Conversion Rate: The percentage of visitors who completed a desired action (e.g., form submission, purchase).
- Goal Completions: The number of times a specific goal was achieved.
- Audience Demographics:
- Age: The age distribution of visitors.
- Gender: The gender distribution of visitors.
- Location: The geographic location (country, city) of visitors.
- Devices and Platforms:
- Desktop vs. Mobile: The breakdown of visitors by device type.
- Operating Systems: The distribution of operating systems used by visitors.
- Content Performance:
- Top Pages: The most visited pages on the website.
- Exit Pages: The pages where visitors most frequently leave the site.
- E-commerce Performance:
- Total Revenue: The total revenue generated from e-commerce transactions.
- Average Order Value: The average value of each order.
- Conversion Rate: The percentage of visitors who made a purchase.
- Custom Metrics and KPIs:
- Depending on the specific goals and objectives of the website, custom metrics and KPIs may be included (e.g., newsletter sign-ups, video views, downloads).
Why Сreate a Web Analytics Dashboard or Report?
Building a web analytics dashboard or report is crucial for several reasons:
- Performance Evaluation: It allows you to assess how well your website is performing in terms of traffic, user engagement, conversions, and other key metrics. This evaluation is essential for making data-driven decisions to improve the website’s effectiveness.
- Data-Driven Marketing Campaigns: A dashboard provides insights into the effectiveness of your digital marketing efforts. By analyzing the data, you can refine your campaigns, allocate resources more efficiently, and optimize strategies for better results.
- Visibility and Transparency: For companies that prioritize transparency and want to keep stakeholders informed about the performance of their website, a dashboard serves as a visual representation of key metrics. This fosters trust and helps stakeholders understand the value of digital marketing efforts.
- Handling High Traffic Websites: Websites that receive a large volume of visitors generate a significant amount of data. A well-designed dashboard helps in efficiently processing and visualizing this data, making it easier to derive meaningful insights.
- Integrating Data for Comprehensive Analysis: For a holistic view of your business performance, it’s important to combine web analytics data with other sales and marketing data. A dashboard can consolidate data from various sources, providing a unified view for comprehensive analysis.
- Simplifying Monitoring: While tools like Google Analytics 4 provide a wealth of data, they can sometimes be overwhelming. A customized dashboard simplifies the monitoring process by focusing on the most critical metrics that matter to your specific business goals.
- Facilitating Quick Decision-Making: Dashboards provide real-time or near-real-time updates on website performance. This allows for timely decision-making and enables you to respond promptly to any emerging trends or issues.
- Customization for Specific Needs: Every business has unique objectives and KPIs. A customized dashboard allows you to track the metrics that are most relevant to your business goals, providing tailored insights for actionable improvements.