 AI insights
 About us
 Careers
 Security
 Customer reviews
 Contact us
 Affiliate program
 Solution partners
 Looker Studio templates
 Tableau templates
 Facebook Ads templates
 Google Ads templates
 Data fields & Metrics
 AI prompt library & Guides
 Product documentation
 API documentation
 Case studies
 Blog
Blog Data models
 Windsor vs Supermetrics
 Windsor vs Fivetran
 Windsor vs Portermetrics
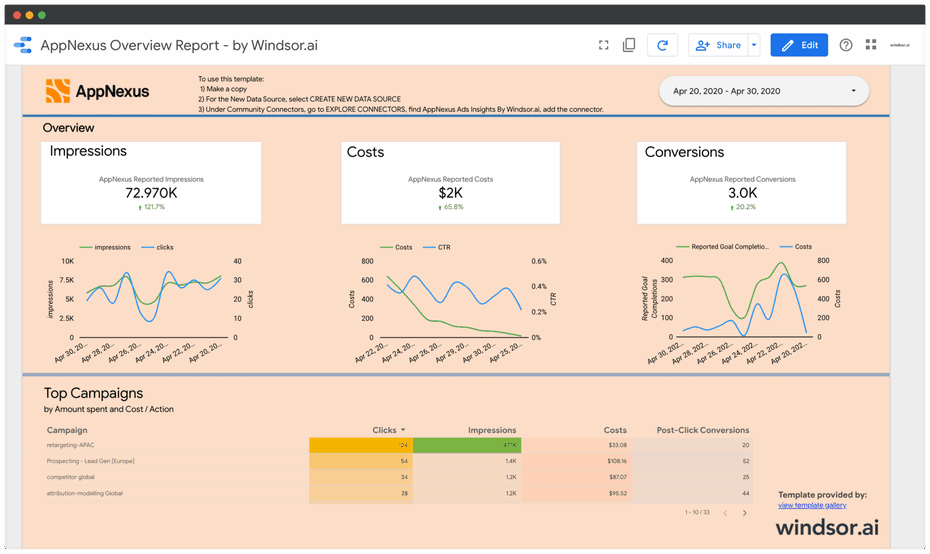
AppNexus helps marketers to serve ads and measure performance. Having cost, impression, click and conversion information in one place helps to reduce the time needed to get to insights. To get all your AppNexus data into Looker Studio you will need to connect your AppNexus data and then build a report. This template can help you safe time on the creation of a new dashboard. You can simply reuse it and change it as you like.
By default, we visualise the most commonly used metrics on a campaign level but you can change this and drill deeper into the data once you connect it.
This dashboard connects to the following data source
- AppNexus
To start using it
- Configure the Looker Studio Connector: AppNexus Ad Insights
- In the connector configuration screen enter your AppNexus username and password. Click Add
- In 2. Select Destination click Finish
- Back in Looker Studio click on CONNECT, then click on CREATE REPORT
- Now your report is set up. Depending on your data volume it might take up to a minute to load.

Try Windsor.ai today
Access all your data from your favorite sources in one place.
Get started for free with a 30 - day trial.
You might also like to read:
Connect AppNexus to Google Sheets
Best Free & Paid Looker Studio Connectors in 2023
Best Looker Studio Example Dashboards
Looker Vs Power BI: Compare BI Tools