Destinations
 Data sources
 AI insights
 About us
 Careers
 Security
 Customer reviews
 Contact us
 Affiliate program
 Solution partners
 Template gallery
 Looker Studio templates
 Power BI templates
 Excel templates
 Google Sheets templates
 Tableau templates
 Facebook Ads templates
 Google Ads templates
 Data fields & Metrics
 AI prompt library & Guides
 Product documentation
 API documentation
 Case studies
 Blog
Blog Data models
 Windsor vs Supermetrics
 Windsor vs Funnel.io
 Windsor vs Fivetran
 Windsor vs Rivery
 Windsor vs Portermetrics
 Windsor vs Coupler.io
 Last updated: 12 October 2026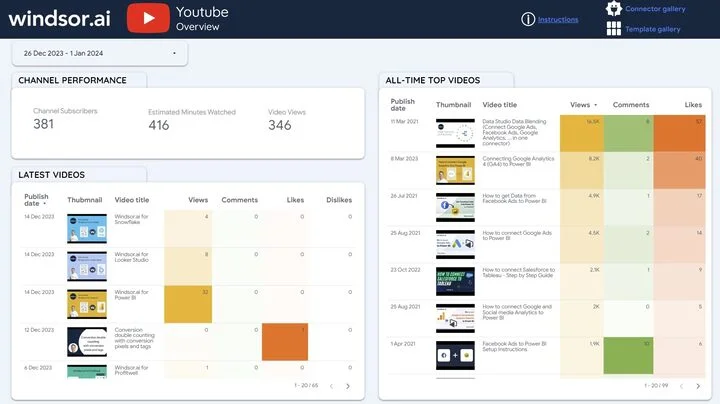




This free YouTube template for Looker Studio, renamed Data Studio in April 2026, shows your channel’s views, watch time, likes, comments and subscribers, with per-video tables and an all-time top videos list. It reads the data through the Windsor.ai YouTube connector, so after you copy it and connect your channel, the report updates from your own YouTube Analytics.
We checked the template against the Windsor.ai YouTube channel on 12 October 2026. Views, watch time, likes and comments matched the connector exactly. A few cards can show wrong numbers, so we list below what to check them against.
To connect YouTube to Data Studio without the template, see Connect YouTube to Data Studio.

Get started for free
Access all your data from your favorite sources in one place.
Free forever plan, no credit card
What the template shows
1. Overview page
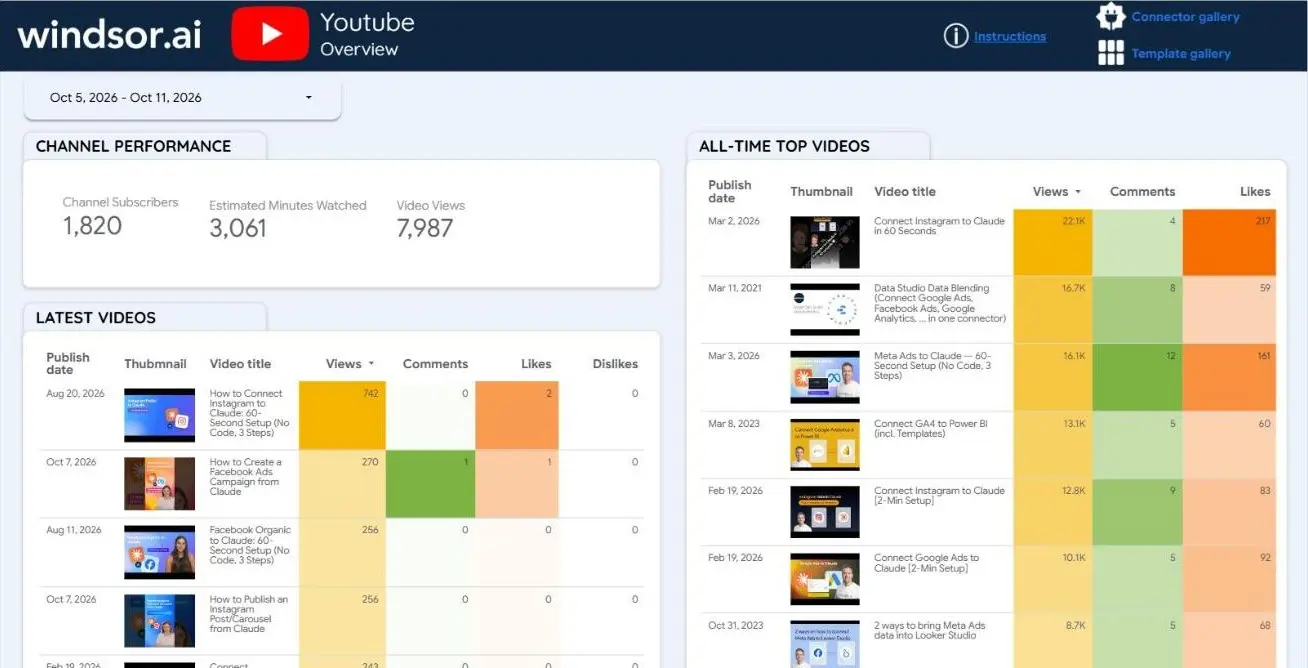
The template on our channel, captured 12 October 2026 with the default range (5 to 11 October).
- Channel performance: current subscribers, estimated minutes watched and video views for the selected dates
- Latest videos: publish date, thumbnail, title, views, comments, likes and dislikes for every video that got views in the period. It’s sorted by views; click Publish date to sort by date.
- All-time top videos: each video’s lifetime view count, the same number YouTube shows publicly
2. Video stats page
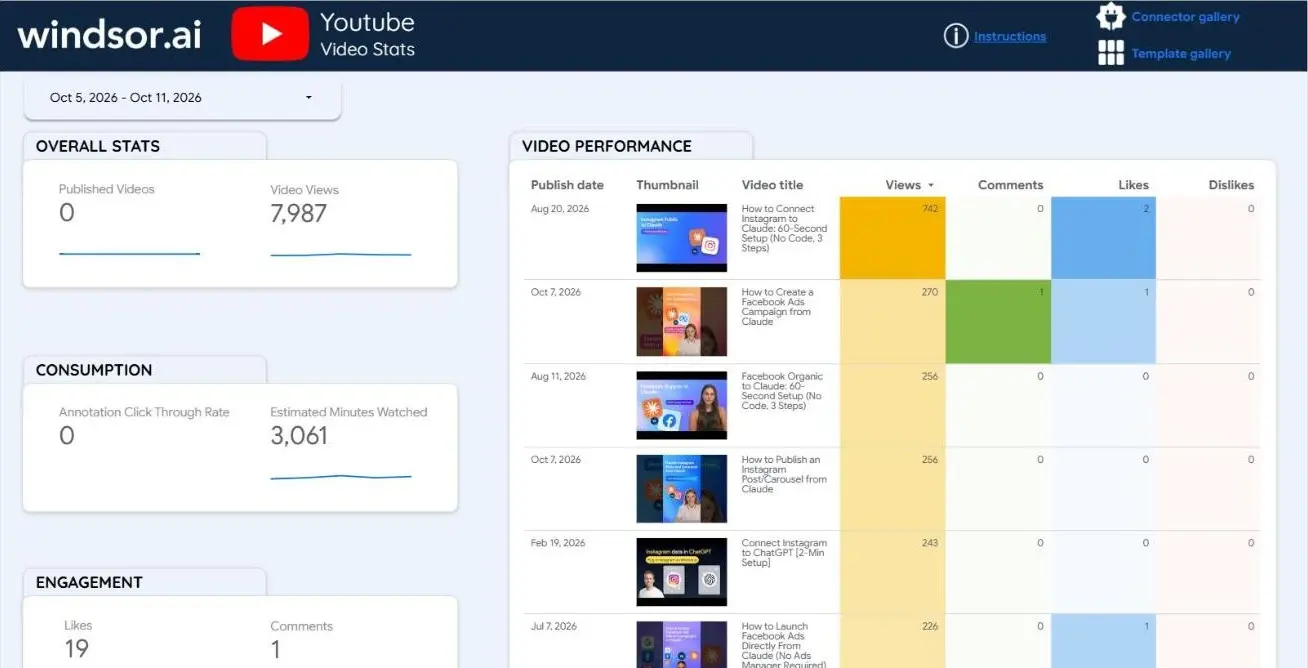
Views, estimated minutes watched, likes and comments with daily trend lines, plus the per-video table.
3. Channel info page
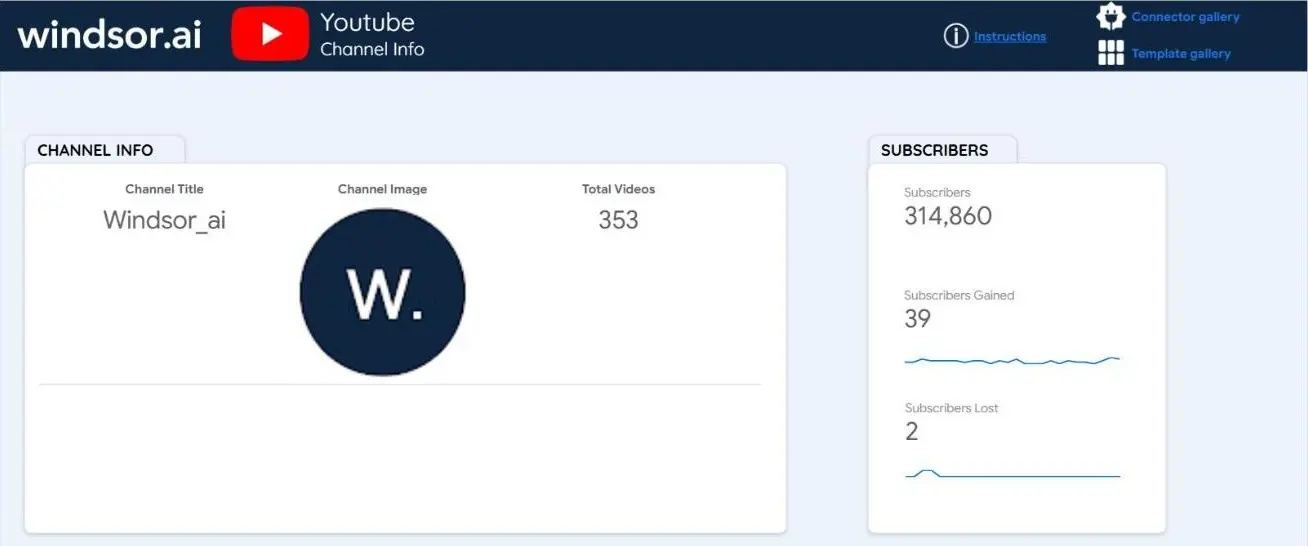
Channel name and image, number of public videos, and subscribers gained and lost.
Dislikes show up because the data comes from the channel owner’s YouTube Analytics, not the public video page.
What it showed on our channel
With the default range (last 7 days, 5 to 11 October 2026), the report showed 7,987 views, 3,061 minutes watched, 19 likes and 1 comment. Pulled straight from the connector for the same days, the totals were identical. The top video for the week had 742 views, also an exact match.
The data stopped at 9 October. YouTube Analytics reports with a delay of about three days, so the last two days of a “last 7 days” range are empty.
How we tested: Matei Ioan Nicolae (SEO Director, Windsor.ai) ran the test on 12 October 2026 on the Windsor.ai YouTube channel. He checked the public template, then made a copy with his own YouTube data source using the steps below, and compared each card with the same fields pulled from the Windsor.ai connector for 5 to 9 October 2026, the latest days available. Views, minutes watched, likes, comments and the top video matched exactly. The cards listed under “Check these numbers before you report them” did not.
How to use the template
You need a YouTube channel you can access, a Windsor.ai account and a Google account for Data Studio.
- Connect YouTube to Windsor.ai. Sign in at onboard.windsor.ai, choose YouTube and grant access to your channel.
- Open the YouTube template and choose Make a copy from the menu (three dots) at the top right.
- Create your data source. Under New Data Source, choose Create data source, search for “Windsor” and pick YouTube (By Windsor.ai) under Partner Connectors.
- Authorize twice. The first popup lets Data Studio use the connector; the second signs you in to Windsor.ai. If the page still shows Authorize, look for a popup you did not finish. Signing in to only one Google account in the browser avoids failed authorizations.
- Select your account and connect. The list shows each connected YouTube account by its Google email and Windsor.ai account ID. Tick yours, click Connect, then Add to report.
- Copy the report. In the Copy this report dialog, pick YouTube under New Data Source and click Copy Report. If you land back on the template instead, choose Make a copy again: your new YouTube data source is now in the list.
Your copy opens in edit mode with your channel’s data. In our test the copied report showed the same totals as the template.
Check these numbers before you report them
Some cards in the template can show wrong numbers. Before you use them, check each one against the source below.
- Subscribers on the Channel Info page can show an inflated total: 314,860 for our channel, which has 1,820 subscribers. Use the Channel Subscribers card on the Overview page for the correct current total.
- Published Videos can show the number of videos that got views instead of the number you uploaded: 0 in the template preview and 261 in our copy, when we had published 10 videos between 5 and 9 October 2026. To count uploads, sort the Latest videos table by Publish date.
- Subscribers gained and lost on the Channel Info page can come in low, because they include only subscribers credited to a video and always cover the last 28 days: 39 gained and 2 lost for us, against 80 and 12 for the whole channel. In your copy, add a scorecard with the Subscribers Gained (Channel) and Subscribers Lost (Channel) fields for the channel total.
- Totals for “last 7 days” can come in low, because the newest two to three days have no data yet. To compare full weeks, set the date range to end three days before today.
- Latest videos can look like your newest uploads, but it’s sorted by views. Click Publish date to sort newest first.
- The annotation card always shows 0, because YouTube retired annotations in January 2019. Don’t read it as a drop in engagement.
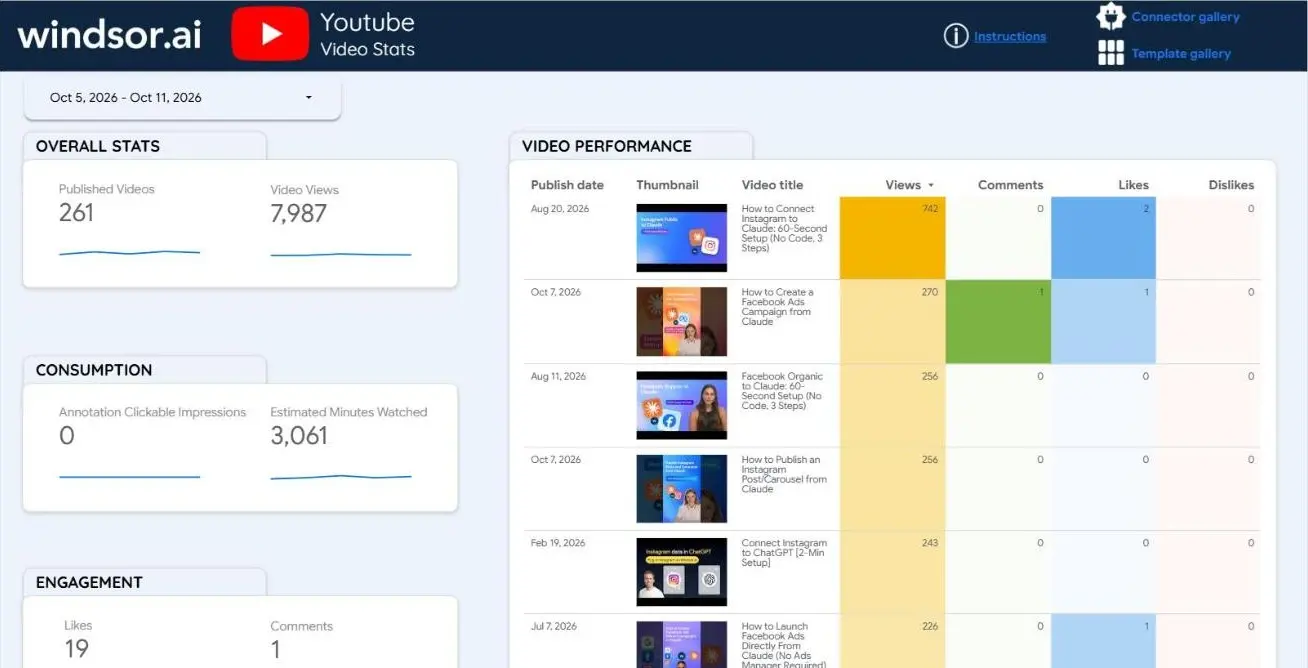
Our copied report for the same week: Published Videos shows 261, the videos that got views, while we published 10 videos that week.
Two more things in your copy: it includes two hidden pages (page 5, an unfinished draft, and page 6, blank) that you can delete under Page in edit mode, and its Instructions page is out of date, so follow the steps above instead.
Data limits
- About three days behind. YouTube Analytics reports with a delay; on 12 October 2026 the newest data was for 9 October.
- Data Studio refreshes every 12 hours. That’s the default data freshness of the data source you create, on top of YouTube’s delay.
- No impressions or thumbnail click-through rate. The connector doesn’t include them, so the template can’t show them.
- The free plan covers the last 30 days. Longer date ranges need a paid plan. Windsor.ai has a free forever plan, no credit card, and paid plans from $19/month.
Questions the template answers
- Which videos got the most views, likes and comments in a period?
- How did views and watch time move day by day?
- Which videos are the most viewed of all time?
- How many subscribers did videos bring in over the last 28 days?
Customize it
In your copy, click Edit and add charts with fields the template doesn’t use: traffic source (YouTube search, suggested videos, external links), content type (Shorts, long-form, live), engaged views, and viewer age and gender as percentages. The YouTube field reference lists every field.
For YouTube next to GA4 or ad data in one report, browse the template gallery.
FAQs
Is Looker Studio the same as Data Studio?
Yes. Google renamed Looker Studio back to Data Studio on 11 April 2026. lookerstudio.google.com redirects to datastudio.google.com, and reports and connectors carried over, including this template.
Why don't the numbers match YouTube Studio?
The connector data runs about three days behind, so the last days of a range are missing. The subscriber gained and lost figures are counted per video, which is lower than the channel total in Studio. Views, watch time, likes and comments matched the connector exactly in our test.
Can I add YouTube Ads data?
Not through this template. YouTube ad campaigns are reported through Google Ads. Connect Google Ads to Windsor.ai and add it as a second data source in your copy.
Is there a Power BI version?
Yes, see the Power BI YouTube dashboard template.